Genetic variability of 10 microsatellite markers in the characterization of
Brazilian Nellore cattle (
Bos indicus
)
Marcelo Cervini
1, Flávio Henrique-Silva
2, Norma Mortari
1and Euclides Matheucci Jr
1 1Laboratório de Imunogenética, Departamento de Genética e Evolução,
Universidade Federal de São Carlos, São Carlos, SP, Brazil.
2
Laboratório de Biologia Molecular, Departamento de Genética e Evolução,
Universidade Federal de São Carlos, São Carlos, SP, Brazil.
Abstract
We assessed the polymorphism of 10 microsatellites in Brazilian Nellore cattle (Bos indicus) using a commercial multiplex system. Allele frequencies, polymorphism information content, heterozygosity and exclusion probability were calculated. Allele frequencies revealed that in the sample analyzed the markers were not equally polymorphic. The exclusion probabilities and the polymorphism information content of some loci in Nellore cattle were lower than inBos taurus breeds. When all the microsatellites were considered the combined exclusion probability was 0.9989. This multiplex analysis can contribute toward pedigree information, adequate genetic improvements and breeding programs.
Key words: alleles, frequencies, microsatellite, Nellore, polymorphism, zebu.
Received: May 11, 2005; Accepted: November 16, 2005.
Introduction
The Bos indicus Nellore herd is one of the largest commercial beef herds in the world and is well-adapted to tropical regions. According to the Brazilian Ministry of Ag-riculture, Livestock and Supply (http://www.agricultura. gov.br), the Nellore herd is the most important beef herd in Brazil, where the total number of both purebred and cross-breed Nellore cattle totals over 140 million head. Due to ge-netic improvement programs and adequate international sanitary standards, Brazil has ranked as the top beef ex-porter since 2003, with an export volume exceeding 1.18 million tons (Brazilian Association of Meat Export Indus-tries http://www.abiec.com.br). Accurate pedigree infor-mation is essential to maintaining the quality of breed improvement programs and molecular markers have be-come an important genetic tool in animal genetics studies, allowing the analysis of genetic variability within and be-tween herds. Many of the current molecular marker tech-niques are based on variations of the polymerase chain reaction (PCR) such as random amplification of polymor-phic DNA (RAPD).
Microsatellites markers have been widely used as a genetic markers in bovine population studies and pedigree verification (Visscher et al. 2002, Hansen et al, 2002, Ibeagha-Awemu and Erhardt, 2005), mainly because of their large polymorphism information content, widespread distribution in the eukaryotic genome (Tautz and Renz, 1984) and robust methodology. Microsatellites have been effective in evaluating differences within cattle breeds and in determining population substructures (MacHughet al, 1998; Ciampoliniet al., 1995). More than 1400 microsa-tellites have been mapped in the cattle genome (Luikartet al., 1999) and some of them have been employed in popula-tion genetics studies and parentage verificapopula-tion. Many mi-crosatellite loci have been used in Nellore improvement programs but, to date, there have been no reports of gree verification studies using microsatellite markers, pedi-gree verification in Brazilian livestock currently being based on blood groups and biochemical polymorphism analyses.
The aim of the study described in this paper was to characterize Brazilian Nellore cattle through the analysis of the genetic variability of ten microsatellite markers and to evaluate if these markers are informative in parentage tests.
Send correspondence to Euclides Matheucci Jr. Laboratório de Imu-nogenética, Departamento de Genética e Evolução, Universidade Federal de São Carlos, Rodovia Washington Luiz km 235, 13565-905 São Carlos, SP, Brazil. E-mail [email protected].
Materials and Methods
Sample collection and DNA extraction
We sampled 200 unrelated adult Nellore cattle (150 dams and 50 bulls) registered in their breeding associations and randomly selected from private and research herds be-longing to 43 farms located in various regions of Brazil. Blood samples were collected in heparinized glass tubes and total genomic DNA isolated as described by Debomoy
et al. (1991) and stored at -20 °C.
Microsatellite amplification
As recommended by the International Society of Ani-mal Genetics (ISAG), ten microsatellites (Table 1) were se-lected for the analysis, using the Stockmarks for Cattle Bovine Genotyping Kit (Applied Biosystems Division, Perkin-Elmer, Foster City, CA). Multiplex amplification was carried out in a final volume of 15mL containing 50 ng
of template DNA, 0.5 units of AmpliTaq GoldTM polymer-ase (PE Applied Biosystems, Foster City, CA), 3.0 mL
Stockmarks Buffer, 400mM of each dNTP and 5.5mL of
primer mix (Table 1). The reactions were carried out using a Programmable Thermal Controller PTC-100TM(MJ Re-search, INC) in an initial denaturation phase of 15 min at 95 °C, followed by 31 cycles of 45 s at 94 °C, 45 s at 61 °C and 1 min at 72 °C. A final extension was carried out at 72 °C for 1 h and then at 25 °C for 2 h. After amplification, 90mL of water was added to the tubes and 0.4mL of this
so-lution was mixed with 2mL loading mix (DI formamide:
dye: GS350Rox - 6:1:1) and analyzed in a 6% (w/v) dena-turing gel using an ABI PRISMTM377 DNA Sequencer. The fluorescence data was collected by GeneScanTM Anal-ysis 2.0 and analyzed using GenotyperTM2.0 software.
Data analysis
The GENEPOP package Version 3.4 (Raymond & Rousset, 1995) was used to calculate an exact test for devia-tion from Hardy-Weinberg equilibrium (HWE), allele frequencies and heterozygotic deficiency. Since the micro-satellite loci have more than four alleles, an unbiased esti-mate of the exact HWE probability was calculated using the Markov chain method of Guo & Thompson (1992). The gene diversity (D) was calculated with FSTAT 2.9.3.2 (Goudet, 2001). Exclusion probability (EP), combined ex-clusion probability (CEP), expected heterozygosity (He) and observed heterozygosity (Ho), and polymorphism in-formation content (PIC) were calculated using Cervus 2.0 software (Marshallet al., 1998).
Results
Ninety-four alleles were detected from the 10 loci surveyed, yielding a mean value of 9.4 alleles per locus. The allele frequencies of 10 microsatellites are listed in Ta-ble 2. Allele frequencies revealed that not all markers were equally informative. TheTGLA227,BM1824andTGLA53
loci each had one allele with a much higher frequency than the other alleles (75 bp, 180 bp and 160 bp respectively). The lociETH10andETH3each had two alleles with high frequencies (209 bp -207 bp and 115 bp -117 bp,
respec-Table 1- Details of the ten microsatellite loci analyzed.
Locus Size range (bp) Primer sequence* Reference
TGLA227 64-115 F: 5’-cga att cca aat ctg tta att tgc t-3’ R: 5’-aca gac aga aac tca atg aaa gca-3’
Barendseet al., 1992
BM2113 116-146 F: 5’-cgt gcc ttc tac caa ata ccc-3’ R: 5’-ctt cct gac aga agc aac acc-3’
Bishopet al., 1994
TGLA53 147-197 F: 5’-gct ttc aga aat agt ttg cat tca-3’ R: 5’-atc ttc aca tga tat tac agc aga-3’
Barendseet al., 1992
ETH10 198-234 F: 5’-gtt cag gac tgg ccc tgc taa ca-3’ R: 5’-cct cca gcc cac ttt ctc ttc tc-3’
Toldoet al., 1993
TGLA126 104-133 F: 5’-cta att tag aat gag aga ggc ttc t-3’ R: 5’-ttg gtc tct att ctc tga ata ttc c-3’
Barendseet al., 1992
TGLA122 130-193 F: 5’-aat cac atg gca aat aag tac ata c-3’ R: 5’-aat cac atg gca aat aag tac ata c-3’
Barendseet al., 1992
INRA023 193-235 F: 5’-gag tag agc tac aag ata aac ttc-3’ R: 5’-taa cta cag ggt gtt aga tga act c-3’
Vaiman,et al., 1992
ETH3 90-135 F: 5’-gaa cct gcc tct cct gca ttg g-3’ R: 5’-act ctg cct gtg gcc aag tag g-3’
Toldoet al., 1993
ETH225 135-165 F: 5’-gat cac ctt gcc act att tcc t-3’ R: 5’-aca tga cag cca gct gct act-3’
Steffenet al., 1993
BM1824 170-218 F: 5’-gag caa ggt gtt ttt cca atc-3’ R: 5’-cat tct cca act gct tcc ttg-’3’
Bishopet al., 1994
tively). The number of alleles per locus ranged from six for
TGLA227to 16 forTGLA122. TheTGLA122locus showed the highest allele polymorphism, while theINRA023locus displayed the highest exclusion probability. Six loci (TGLA 53,ETH10,ETH3,ETH225,TGLA122andINRA023) de-viated significantly (p < 0.05) from HWE. A significant deficit of heterozygosity (p < 0.01) was detected in the
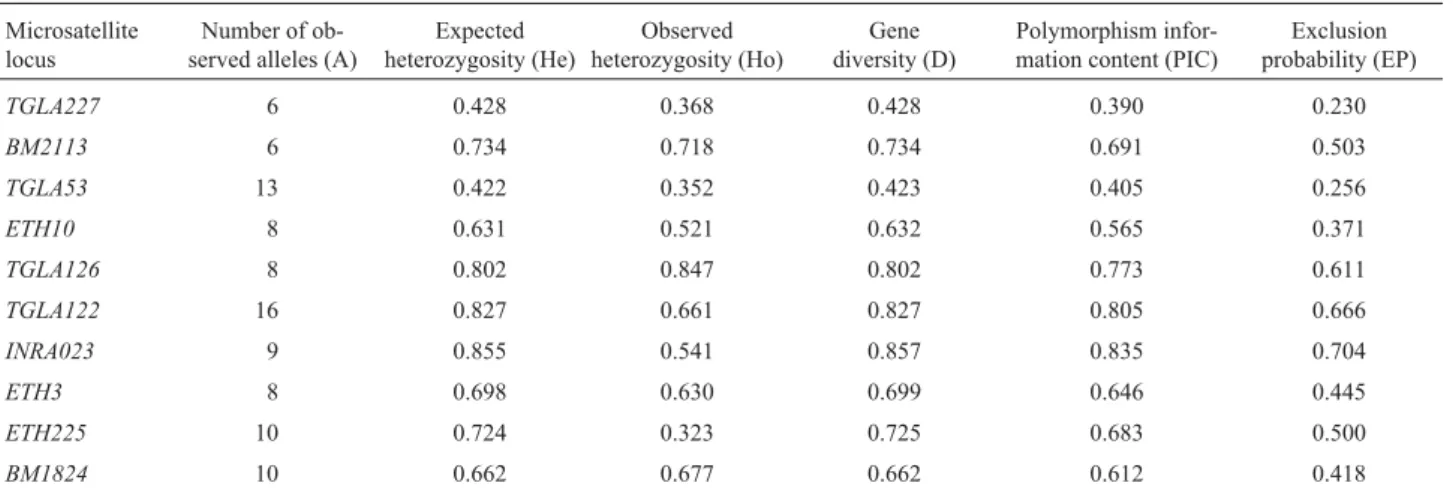
TGLA53,ETH10 ETH225,TGLA122, andINRA023loci. TheETH3locus did not show heterozygote deficiency, al-though its P value was close to p < 0.01. The mean PIC value was 0.640 and the mean expected heterozygosity value was 0.679. Expected and observed heterozygosity, probability of exclusion and PIC values are shown in Table 3. The combined probability of parentage exclusion for the 10 microsatellites was 0.9989.
Discussion
Accurate cattle pedigree information is essential for the optimal development of breed and selection programs, improving productivity in the animal industry. Misidentifi-cation of parentage can lead to breeding inaccuracy, caus-ing great financial losses in herd management and in the beef industry. Geldermannet al. (1986) estimated misiden-tification rates of 13% using blood group factors and bio-chemical polymorphisms in cattle. Ronet al. (1996) found a 5% misidentification rate using microsatellite analysis in Israeli dairy cattle. Rosa (1997) reported a misidentifica-tion rate of 15% in Brazilian livestock, based on restricmisidentifica-tion fragment length polymorphism (RFLP) and microsatellite analysis. Microsatellites are the most widely used molecu-lar markers in pedigree control. The use of microsatellites
Table 2- Allele frequencies (Freq.) of the ten microsatellite loci analyzed.
Microsatellite loci
TGLA122 TGLA53 ETH225 INRA023 BM1824 ETH10 ETH3 TGLA126 TGLA227 BM2113
Allele Freq. Allele Freq. Allele Freq. Allele Freq. Allele Freq. Allele Freq. Allele Freq. Allele Freq. Allele Freq. Allele Freq. 133 0.3061 160 0.7520 138 0.0833 194 0.1757 176 0.0032 205 0.0630 101 0.0450 109 0.0026 75 0.7338 129 0.3927 135 0.0212 162 0.0160 140 0.1210 196 0.0901 178 0.1899 207 0.3445 103 0.0125 115 0.1553 77 0.1741 135 0.1723 137 0.0030 164 0.0160 142 0.0081 198 0.0135 180 0.5032 209 0.4958 115 0.3475 117 0.0211 79 0.0597 137 0.0169 139 0.0152 166 0.0200 146 0.0242 200 0.0631 182 0.2215 211 0.0420 117 0.4050 119 0.0711 81 0.0174 139 0.0621 141 0.2273 168 0.1080 150 0.0027 202 0.1261 184 0.0222 213 0.0042 119 0.1125 121 0.3000 95 0.0050 141 0.2684 143 0.0303 170 0.0200 152 0.0645 208 0.0360 186 0.0032 215 0.0210 121 0.0075 123 0.2316 97 0.0100 143 0.0876 145 0.0273 172 0.0240 154 0.0027 210 0.0135 192 0.0063 217 0.0084 123 0.0100 125 0.1447
147 0.0606 174 0.0040 158 0.2661 212 0.0901 194 0.0285 219 0.0210 125 0.0600 127 0.0737 149 0.0121 176 0.0080 160 0.4247 214 0.2342 196 0.0222
151 0.0303 182 0.0080 162 0.0027 216 0.1577 153 0.0394 184 0.0120
155 0.0879 186 0.0080 159 0.0030 190 0.0040 161 0.0152
163 0.1182 165 0.0030
Table 3- Variability measures of ten microsatellite markers in Brazilian Nellore cattle.
Microsatellite locus
Number of ob-served alleles (A)
Expected heterozygosity (He)
Observed heterozygosity (Ho)
Gene diversity (D)
Polymorphism infor-mation content (PIC)
Exclusion probability (EP)
TGLA227 6 0.428 0.368 0.428 0.390 0.230
BM2113 6 0.734 0.718 0.734 0.691 0.503
TGLA53 13 0.422 0.352 0.423 0.405 0.256
ETH10 8 0.631 0.521 0.632 0.565 0.371
TGLA126 8 0.802 0.847 0.802 0.773 0.611
TGLA122 16 0.827 0.661 0.827 0.805 0.666
INRA023 9 0.855 0.541 0.857 0.835 0.704
ETH3 8 0.698 0.630 0.699 0.646 0.445
ETH225 10 0.724 0.323 0.725 0.683 0.500
with high polymorphism information content would help to correctly identify individual cattle, allowing for the better operation of cattle breeding programs.
Little information is available regarding the allele fre-quencies of the ten microsatellites studied in this work and the other variability estimates for Nellore cattle and, to date, there are no estimates of the multiplex variability in Brazilian cattle breeds. Since the evaluation of polymor-phism is strictly dependent on the allele number and the fre-quency distribution of the alleles, estimates of allele frequencies are essential.
A comparison of the results obtained for B. indicus
Nellore cattle with those ofB. taurusbreeds indicated a dif-ference in variability for some loci, which are highly infor-mative in B. taurus but less informative in B. indicus
(Nellore). The exclusion probability values for the
TGLA227,ETH10 andTGLA53loci of taurine cattle de-scribed by Peelmanet al. (1998) and Heyenet al. (1997) are much higher than that of Nellore cattle.
According to Peelman et al. (1998), who analyzed Belgium cattle, the number ofTGLA53locus alleles in Hol-stein Friesian (13 alleles), Belgian Red Pied (12 alleles), East Flemish (12 alleles) and Belgian Blue (10 alleles) cat-tle were very similar to that found in Nellore catcat-tle (13 al-leles). However, we found that the exclusion probability for theTGLA53locus in Brazilian Nellore (EP = 0.256) cattle is much lower than in the four Belgian breeds (Holstein Friesian = 0.742, Belgian Red Pied = 0.711, East Flemish = 0.698 and Belgian Blue = 0.682). We obtained similar re-sults for theTGLA227locus (EP 0.230), much lower than the values described by Heyen (1997) for Holstein (0.69), Red Angus (0.63) and Gelbvieh (0.68) cattle. Thus, the ef-fectiveness of these markers in EuropeanB. tauruscattle is not always the same for IndianB. indicuszebu (Brahman, Nellore) cattle. The substitution of the markers with low variability values for others with improved EP values could render this multiplex more efficient for pedigree verifica-tion and individual identificaverifica-tion in Nellore. Characteriza-tion of Brazilian cattle breeds with microsatellite loci is useful to identify informative markers for each breed, opti-mizing parentage tests along with the variability values of each marker, thus using the least number of markers with higher levels of information while simultaneously facilitat-ing genotypic identification.
The combined exclusion probability value for the 10 loci was 0.9989, an acceptable value more than ideal for parentage tests (Baronet al, 2002). Jiaet al(2004) showed that the CEP value was 0.9957 for Holstein Friesian cattle using six microsatellite markers, while Radkoet al(2002) obtained a CEP value of 0.9999 using 11 microsatellites and it is known that the CEP values found in Nellore cattle is lower than that of other taurine breeds (Heyen et al., 1997).
In our study we found significant (p < 0.01) devia-tions from HWE for six loci (TGLA122, INRA023,
TGLA53, ETH10, ETH225 and ETH3). Machado et al
(2003) also found significant deviations from HWE for Nellore, Gyr and Guzerat cattle breeds using microsatelli-tes markers. Almeidaet al(2000) found that theTGLA122
locus was in HWE in Brazilian hybrid bovine breed (5/8 Aberdeen Angus x 3/8 Nellore). We found deviations from HWE caused by heterozygote deficiency at theTGLA122,
INRA023,TGLA53,ETH10andETH225loci. Bejaet al. (2003) and Loftuset al. (1999) found deviations from HWE in other European bovine populations, also caused by a heterozygosity deficit, and similar results have been re-ported by Loftus (1999) in six populations, including In-dian Nellore cattle.
Several factors can lead to heterozygote deficiency, in-cluding null alleles, assortive mating, the Wahlund effect, se-lection against heterozygotes, inbreeding, or a combination of these. Null alleles are alleles that are not amplified (usu-ally due to a mutation in one of the primer binding sites) and are commonly reported in microsatellite studies as being the source of heterozygosity deficit (Pemberton et al., 1995). The frequency of microsatellite loci containing null alleles has proved to be as high as 30% in humans (Callenet al., 1993). In paternity tests, an undetected null allele may have profound consequences, since it may cause rejection of an otherwise correctly assigned parent (Holmet al., 2001).
To date, there are no reports of studies on Nellore cat-tle indicating the presence of null alleles for the markers an-alyzed, although the presence of null alleles has previously been observed in segregation analyses using other micro-satellite loci in Nellore cattle (Tambascoet al., 2000). This hypothesis cannot be excluded because segregation analy-sis using the loci evaluated in this study has not yet been un-dertaken for Nellore cattle.
Despite the paucity of information provided by some of the loci analyzed in this study, the use of this multiplex analysis proved efficient in Nellore characterization and can be used in pedigree verification.
Acknowledgements
Marcelo Cervini has a fellowship from the Brazilian agency Coordenação de Aperfeiçoamento de Pessoal de Nível Superior (CAPES). This work was financially sup-ported by Fundação de Apoio Institucional Desenvolvi-mento Científico e Tecnológico - Universidade Federal de São Carlos (FAI-UFSCar).
References
Baron EE, Martinez ML, Verneque RS and Coutinho LL (2002) Parentage testing and effect of misidentification on the esti-mation of breeding value in Gir cattle. Genet Mol Biol 25:389-394.
Soller M, Womack JE and Hetzel DJS (1994) A genetic link-age map of the bovine genome. Nature Genet 6:227. Beja-Pereira A, Alexandrino P, Bessa I, Carretero Y, Dunner S,
Ferrand N, Jordana J, Laloe D, Moazami-Goudarzi K, San-ches A and Cañon J (2003) Genetic characterization of Southwestern European bovine breeds: A historical and bio-geographical reassessment with a set of 16 microsatellites. J Hered 94:243-50
Bishop MD, Kappes SM and Keele JWet al(1994) A genetic linkage map for cattle. Genetics 136:619-39.
Botstein D, White RL, Skolnick M and Davis RW (1980) Con-struction of a genetic linkage map in man using restriction fragment length polymorphisms. Amer J Human Genet 32:314-31.
Callen DF, Thompson AD, Shen Y, Phillips HA, Richards RI, Mulley JC and Sutherland GR (1993) Incidence and origin of null alleles in the (AC)n microsatellite markers. Amer J Human Genet 52:922-27.
Ciampolini R, Moazami-Goudarzi K, Vaiman D, Dillman C, Mazzanti E, Foulley JL, Leveziel H and Cianci D (1995) In-dividual multilocus genotypes using microsatellite polymor-phisms to permit the analysis of the genetic variability within and between Italian beef cattle breeds. J Animal Sci 73:3259-68.
Curi RA and Lopes CR (2002) Evaluation of nine microsatellite loci and misidentification paternity frequency in a popula-tion of Gyr breed bovines. Braz J Veterin Res Animal Sci 39:129-35.
Debomoy KL and Nurnberger JI (1991) A rapid non-enzymatic method for preparation of HMW DNA from blood for RFLP studies. Nucleic Acids Res 19:5444.
Geldermann H, Pieper U and Weber WE (1986) Effect of mis-identification on the estimation of breeding value and herita-bility in cattle. J Animal Sci 63:1759-68.
Guo S and Thompson EA (1992) Performing exact test of Hardy-Weinberg proportions for multiple alleles. Biometrics 48:361-72.
Hansen C, Shrestha JN, Parker RJ, Crow GH, McAlpine PJ and Derr JN (2002) Genetic diversity among Canadienne, Brown Swiss, Holstein, and Jersey cattle of Canada based on 15 bovine microsatellite markers. Genome 45:897-904. Heyen DW, Beever JE, Da Y, Evert RE, Green C, Bates SRE,
Ziegle JS and Lewin HA (1997) Exclusion probabilities of 22 bovine microsatellite markers in fluorescsnt multiplexes for semi-automated parentage testing. Animal Genet 28:21-27.
Holm LE, Loeschcke V and Bendixen C (2001) Elucidation of the molecular basis of a null allele in a rainbow trout micro-satellite. Marine Biotechnol 3:555-60.
Ibeagha-Awemu EM and Erhardt G (2005) Genetic structure and differentiation of 12 African Bos indicus andBos taurus cat-tle breeds, inferred from protein and microsatellite poly-morphisms. J Anim Breed Genet 122:12-20
Jamieson A and Taylor St CS (1997) Comparisons of three proba-bility formulae for parentage exclusion. Animal Genet 28:397-400.
Loftus R, Ertrugrul O, Harba A, El-Barodys M, MacHugh D, Park S and Bradley D (1999) A microsatellite survey of cattle from a centre of origin: The Near East. Mol Ecol 8:2015-22. Luikart G, Biju-Duval M-P, Ertugrul O, Zagdsuren Y, Maudet C
and Taberlet P (1999) Power of 22 microsatellite markers in fluorescent multiplexes for parentage testing in goats (Capra hircus). Animal Genet 30:431-38.
MacHugh DE, Loftus RT, Bradley DG, Sharp PM and Cun-ningham P (1994) Microsatellite DNA variation within and among European cattle breeds. Proc Royal Soc 256:25-31. MacHugh DE, Loftus RT, Cunningham P and Bradley DG (1998)
Genetic structure of seven European cattle breeds assessed using 20 microsatellite markers. Animal Genet 29:333-40. Marshall TC, Slate J, Kruuk LEB and Pemberton JM (1998)
Sta-tistical confidence for likelihood-based paternity inference in natural population. Mol Ecol 7:639-55.
Peelman LJ, Mortiaux F, Van Zeveren A, Dansercoer A, Mom-mens G, Coopman F, Bouquet Y, Burny A, Renaville R and Portelle D (1998) Evaluation of the genetic variability of 23 bovine microsatellite markers in four Belgian cattle breeds. Animal Genet 29:161-67.
Pemberton JM, Slate J, Bancroft DR and Barret JA (1995) Non-amplifying alleles at microsatellite loci: A caution for par-entage and population studies. Mol Ecol 4:249-52. Radko A, Duniec M, Zabek T, Janik A and Natonek M (2002)
Polymorphism of 11 microsatellite DNA sequence and their usefulness for paternity control in cattle. Polish Soc Veterin Sci 58:708-710.
Raymond M and Rousset F (1995) GENEPOP (version 1.2): Pop-ulation genetics software for exact tests and ecumenicism. J Hered 86:248-49.
Ron M, Blanc Y, Band M, Ezra E and Weller JI (1996) Misidenti-fication rate in the Israeli Dairy Cattle population and its im-plications for genetic improvement. J Dairy Sci 79:676-81. Rosa AJM (1997) Caracterização da raça Nelore e testes de
paternidade por marcadores moleculares. Master’s Thesis, Escola Superior de Agricultura “Luiz de Queiroz”, Univer-sidade de São Paulo, Piracicaba.
Steffen P, Eggen A, Dietz AB, Womack JE and Stranzinger G (1993) Isolation and mapping of polymorphic microsatelli-tes in cattle. Animal Genet 24:121.
Tambasco DD, de Alencar MM, Coutinho LL, Tambasco AJ, Tambasco MD and Regitano LCA (2000) Caracterização molecular de animais da raça Nelore utilizando microssaté-lites e genes candidatos. Rev Bras Zootecnia 29:1044-49. Tautz D and Renz M (1984) Simple sequences are ubiquitous
components of eukaryotics genomes. Nucleic Acids Res 12:4127-38.
Toldo S, Fries SR, Steffen P, Neibergs HL and Barendse W (1993) Physically mapped cosmid-derived microsatellite markers as anchor loci on the bovine chromosome. Mamma-lian Genome 4:720-27.
Vaiman D, Mercier D, Moazami-Goudarzi K, Eggen A, Ciampo-lini R, Lepingle A, Velmala R, Kaukinen J, Varvio SL, Mar-tin P, Levéziel H and Guérin G (1994) A set of 99 cattle microsatellite: characterization, synteny mapping and poly-morphism. Mammalian Genome 5:288-297.
Visscher PM, Woolliams JA, Smith D and Williams JL (2002) Es-timation of pedigree errors in the UK dairy population using microsatellite markers and the impact on selection. J Dairy Sci 85:2368-75.
Internet Resources
Goudet J (2001) FSTAT, a program to estimate and test gene di-versities and exation indices (version 2.9.3). Available from http://www.unil.ch/izea/softwares/fstat.html.