Genetic variability of Brazilian wheat germplasm
obtained by high-density SNP genotyping
Adriana Scherlosky
1, Volmir Sérgio Marchioro
2, Francisco de
Assis Franco
3, Alessandro Lucca Braccini
1and Ivan Schuster
4Abstract: The aim of this study was to evaluate the genetic diversity of the wheat germplasm using high-density genotyping with SNP markers. A set of 211 wheat varieties genotyped with 35,142 SNP markers were used in the experiment. Genetic distances ranged from 0.013 to 0.471, with the highest frequency of distances varying between 0.31 and 0.40. In the cluster analysis by the UPGMA method, 81% of the varieties were clustered in three groups. Genetic variability in the Brazilian wheat germplasm has remained constant for over 70 years. Mean genetic distances among the varieties developed in each decade ranged from 0.33 to 0.34. A trend of genetic distance between genotypes from different eras has been observed over time as a result of breeding. Results described in this study can help Brazilian wheat breeders to manage more adequately genetic variability in the Brazilian wheat germplasm.
Keywords: Triticum aestivum (L.), genetic variability, genotypes from different eras, breeding.
Crop Breeding and Applied Biotechnology 18: 399-408, 2018 Brazilian Society of Plant Breeding. Printed in Brazil
http://dx.doi.org/10.1590/1984-70332018v18n4a59
ARTICLE
*Corresponding author:
E-mail: ivanschuster.ivan@gmail.com
Received: 21 February 2018 Accepted: 13 September 2018
1 Universidade Estadual de Maringá,
Departa-mento de Agronomia, 87.020-900, Maringá, PR, Brazil
2 Universidade Federal de Santa Maria,
98.400-000, Frederico Westphalen, RS, Brazil
3 Coodetec, 85.813-450, Cascavel, PR, Brazil 4 Longping High-Tech, 14.140-000, Cravinhos,
SP, Brazil
INTRODUCTION
One of the features of plant breeding in Brazil is the possibility of using commercial varieties in crosses regardless of the intellectual property associated with them (Riede et al. 2001). This is the so-called breeder’s right, provided for by the Plant Variety Protection (PVP) Law in Brazil (Law 9456, from 1997). This possibility allows the sharing of genetic variability between the various breeding programs. Varieties developed by a breeding program can be used as germplasm source by other breeding programs.
Genetic variability is the foundation of breeding. Breeding programs are aimed at exploiting the genetic variability of species to obtain genetic combinations of adapted, high yielding, disease-resistant, and higher-quality varieties, in addition to other characteristics. Although genetic variability can be increased through the introduction of exotic germplasm, only a fraction of this variability is useful in breeding. The most part of the exotic genome is not adapted and must be eliminated after being introduced as a source of variability, through successive breeding cycles. For this reason, in most cases, breeding programs use exclusively germplasm already improved for the generation of breeding populations and variability.
germplasm used by breeding programs is essential for the rational use of this germplasm. Further, it is essential to monitor variability over the years, since short-term monitoring may erroneously lead to biases in the interpretation of the data towards reduction of variability.
Molecular markers have been one of the main tools employed in studies of genetic variability (Caixeta et al. 2009, Cruz et al. 2014). Among them, Single Nucleotide Polymorphism (SNP) markers stand out for their abundance in the genome of species; their high automation capacity; and the existence of high-density SNP microarrays for the many species of interest to the breeder. Wheat germplasm evaluation with SNP markers is just beginning, and only few works have been published using this marker in wheat, e.g. Shavrukov (2014) in Kazakstan.
In view of the management and preservation of the existing genetic variability in the Brazilian wheat germplasm, the present study was conducted to analyze the genetic variability present in the Brazilian wheat germplasm by using, for the first time, high-density SNP markers. Additionally, this study examined the evolution of genetic variability in the Brazilian wheat germplasm over four decades.
MATERIAL AND METHODS
Genetic material
This work was conducted in the biotechnology laboratory of Coodetec, in Cascavel, PR, Brazil. The genetic material was composed by 185 varieties and one elite line of wheat [(Triticum aestivum (L.)] developed in Brazil; 11 varieties from Paraguay; seven from Mexico; six from China; and one from Argentina, totaling 211 varieties (Table 1). Among the Brazilian varieties, twenty-one were developed before 1980, thirty-five were developed in the 1980s, twenty-four in the 1990s, sixty-four in the 2000s, and forty-one in the 2010s.
DNA extraction and genotyping of SNP markers
DNA was extracted according to the protocol described by Schuster et al. (2004). DNA samples were genotyped using the AxiomTM WhtBrd-1 Array kit, which contained 35,143 SNP markers, at Affymetrix Company (Santa Clara, CA,
USA). All information pertaining to the SNP present in the platform can be accessed at http://www.cerealsdb.uk.net. After genotyping, the obtained data were filtered in Excel sheet to discard monomorphic markers, markers that did not have one of the homozygous genotypes, markers with a call rate lower than 90% (over 10% of missing data), markers with minimum allele frequency lower than 5%, and markers with over 30% heterozygous genotypes among the 211 varieties of wheat used.
Analysis of genetic variability
Genetic distances among the wheat varieties were obtained by 1-IBS (identity by state), where IBS is defined as the probability of the alleles observed in the same locus in two individuals being the same at random. Therefore, the distance between one individual and itself is defined as 0.
This estimate is based on the following definition: for a bi-allelic locus with A and B alleles, the probability of IBS, pIBS (AA, AA) = 1, pIBS (AA, BB) = 0, pIBS (AB, xx) = 0.5, where xx is any genotype other than AB. For two taxa, pIBS is obtained as the average of all loci without lost data. The estimates of genetic distance among the wheat varieties were obtained using Tassel software (Bradbury et al. 2007).
Genetic distances among the groups of varieties developed in each period were obtained by Rogers’ genetic distance estimator:
Where m is the number of markers; ni is the number of alleles in marker i; and pij and qij are the frequencies of allele j in marker i in the pairs of eras considered in each comparison of group of genotypes. Rogers’ genetic distances were
Table 1. List of varieties used in the study of genetic variability with high-density SNP markers
Variety Company Year Country Variety Company Year Country
Estrela Atria Biotrigo 2013 Brazil Ocepar 6 Flamingo Coodetec 1983 Brazil
FPS Nitron Biotrigo 2011 Brazil Ocepar 7 Batuira Coodetec 1984 Brazil
TBIO Alvorada Biotrigo 2012 Brazil Ocepar 8 Macuco Coodetec 1984 Brazil
TBIO Bandeirante Biotrigo 2012 Brazil Ocepar 9 Perdiz Coodetec 1984 Brazil
TBIO Iguaçu Biotrigo 2012 Brazil Pavão Coodetec 1982 Brazil
TBIO Itaipu Biotrigo 2012 Brazil Tucano Coodetec 1980 Brazil
TBIO Mestre Biotrigo 2012 Brazil JF90 DNA Melhoramento Vegetal 2012 Brazil
TBIO Pioneiro Biotrigo 2010 Brazil Frontana EEF de Bagé 1940 Brazil
TBIO Seleto Biotrigo 2012 Brazil Encruzilhada EEF de Encruzilhada do Sul 1970 Brazil
TBIO Sinuelo Biotrigo 2012 Brazil Colonias EEF de Veranópolis 1949 Brazil
TBIO Tibagi Biotrigo 2010 Brazil Vacaria EEF de Veranópolis 1976 Brazil
TBIO Toruk Biotrigo 2014 Brazil BR 18 Terena Embrapa Agropecuária Oeste 1986 Brazil
Candeias Coodetec 1982 Brazil BR 30 Cadiveu Embrapa Agropecuária Oeste 1988 Brazil
CD 101 Coodetec 1997 Brazil BRS 207 Embrapa Cerrados 1999 Brazil
CD 102 Coodetec 1996 Brazil BRS 254 Embrapa Cerrados 2005 Brazil
CD 103 Coodetec 1998 Brazil BRS 264 Embrapa Cerrados 2005 Brazil
CD 104 Coodetec 1999 Brazil EMBRAPA 21 Embrapa Cerrados 1993 Brazil
CD 105 Coodetec 1999 Brazil EMBRAPA 42 Embrapa Cerrados 1995 Brazil
CD 106 Coodetec 2000 Brazil BRS 193 Embrapa Soja 2000 Brazil
CD 107 Coodetec 2002 Brazil BRS 208 Embrapa Soja 2001 Brazil
CD 108 Coodetec 2003 Brazil BRS 210 Embrapa Soja 2002 Brazil
CD 109 Coodetec 2003 Brazil BRS 220 Embrapa Soja 2003 Brazil
CD 110 Coodetec 2003 Brazil BRS 229 Embrapa Soja 2004 Brazil
CD 1104 Coodetec 2014 Brazil BRS Albatroz Embrapa Soja 2011 Brazil
CD 111 Coodetec 2003 Brazil BRS Pardela Embrapa Soja 2007 Brazil
CD 112 Coodetec 2004 Brazil BRS Sabiá Embrapa Soja 2013 Brazil
CD 113 Coodetec 2004 Brazil BR 1 Embrapa Trigo 1979 Brazil
CD 114 Coodetec 2004 Brazil BR 14 Embrapa Trigo 1985 Brazil
CD 1144* Coodetec # Brazil BR 15 Embrapa Trigo 1985 Brazil
CD 115 Coodetec 2005 Brazil BR 2 Embrapa Trigo 1979 Brazil
CD 116 Coodetec 2006 Brazil BR 23 Embrapa Trigo 1987 Brazil
CD 117 Coodetec 2007 Brazil BR 27 Embrapa Trigo 1988 Brazil
CD 118 Coodetec 2008 Brazil BR 28 Embrapa Trigo 1988 Brazil
CD 119 Coodetec 2009 Brazil BR 34 Embrapa Trigo 1989 Brazil
CD 120 Coodetec 2009 Brazil BR 37 Embrapa Trigo 1990 Brazil
CD 121 Coodetec 2010 Brazil BR 4 Embrapa Trigo 1979 Brazil
CD 122 Coodetec 2010 Brazil BR 43 Embrapa Trigo 1991 Brazil
CD 123 Coodetec 2010 Brazil BR 5 Embrapa Trigo 1980 Brazil
CD 124 Coodetec 2012 Brazil BR 7 Embrapa Trigo 1981 Brazil
CD 1252 Coodetec 2012 Brazil BR 8 Embrapa Trigo 1983 Brazil
CD 1440 Coodetec 2013 Brazil BRS 120 Embrapa Trigo 1997 Brazil
CD 150 Coodetec 2009 Brazil BRS 177 Embrapa Trigo 1999 Brazil
CD 154 Coodetec 2012 Brazil BRS 179 Embrapa Trigo 1999 Brazil
CD 1550 Coodetec 2012 Brazil BRS 276 Embrapa Trigo 2008 Brazil
CD 1805 Coodetec 2014 Brazil BRS 296 Embrapa Trigo 2009 Brazil
Esporão Coodetec 2014 Brazil BRS 327 Embrapa Trigo 2010 Brazil
Jandaia Coodetec 1981 Brazil BRS 328 Embrapa Trigo 2012 Brazil
Nambu Coodetec 1979 Brazil BRS 329 Embrapa Trigo 2012 Brazil
Ocepar 10 Garça Coodetec 1984 Brazil BRS 331 Embrapa Trigo 2012 Brazil
Ocepar 11 Juriti Coodetec 1984 Brazil BRS 49 Embrapa Trigo 1996 Brazil
Ocepar 12 Maitaca Coodetec 1985 Brazil BRS Angico Embrapa Trigo 2002 Brazil
Ocepar 13 Acauã Coodetec 1985 Brazil BRS Camboatá Embrapa Trigo 2003 Brazil
Ocepar 14 Coodetec 1988 Brazil BRS Camboin Embrapa Trigo 2004 Brazil
Ocepar 15 Coodetec 1988 Brazil BRS Guamirim Embrapa Trigo 2005 Brazil
Ocepar 16 Coodetec 1989 Brazil BRS Louro Embrapa Trigo 2003 Brazil
Ocepar 17 Coodetec 1989 Brazil BRS Parrudo Embrapa Trigo 2012 Brazil
Ocepar 18 Coodetec 1990 Brazil BRS Timbaúva Embrapa Trigo 2002 Brazil
Ocepar 19 Coodetec 1990 Brazil BRS Umbu Embrapa Trigo 2003 Brazil
Ocepar 20 Coodetec 1990 Brazil CNT 1 Embrapa Trigo 1975 Brazil
The cluster analyses between varieties and between genotypes of different eras were performed by the UPGMA hierarchical method, using JMP software (SAS Institute 2015).
RESULTS AND DISCUSSION
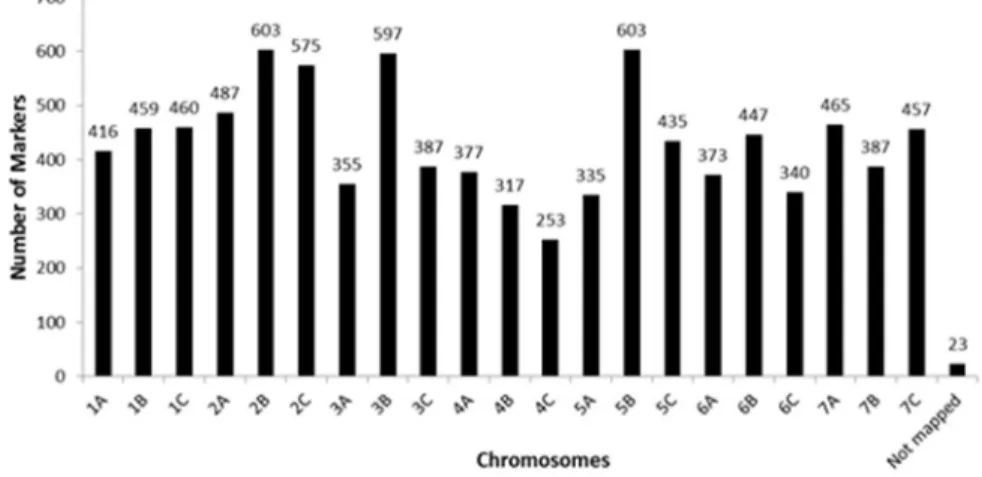
Of the 35,143 markers used, 10,049 met the quality requirements, accounting for 28.6% of the total number of markers present in the SNP panel. In the set of useful markers, the number of markers per chromosome ranged from
Variety Company Year Country Variety Company Year Country
CNT 5 Embrapa Trigo 1976 Brazil Alcover OR Sementes 2000 Brazil
CNT 6 Embrapa Trigo 1976 Brazil Ametista OR Sementes 2011 Brazil
CNT 7 Embrapa Trigo 1976 Brazil Avante OR Sementes 2001 Brazil
CNT 9 Embrapa Trigo 1977 Brazil Campeiro OR Sementes 2009 Brazil
MGS 1 Aliança Epamig 1999 Brazil Jadeíte 11 OR Sementes 2012 Brazil
CEP 14 Tapes Fundacep 1985 Brazil Marfim OR Sementes 2007 Brazil
CEP 29 Fundacep 2001 Brazil Mirante OR Sementes 2008 Brazil
CEP 72 Sulino Fundacep 1982 Brazil Onix OR Sementes 2001 Brazil
Fundacep 30 Fundacep 1999 Brazil Pampeano OR Sementes 2003 Brazil
Fundacep 37 Fundacep 2002 Brazil Quartzo OR Sementes 2007 Brazil
Fundacep 40 Fundacep 2002 Brazil Rubi OR Sementes 1998 Brazil
Fundacep 50 Fundacep 2005 Brazil Safira OR Sementes 2004 Brazil
Fundacep 52 Fundacep 2005 Brazil Supera OR Sementes 2004 Brazil
Fundacep Bravo Fundacep 2010 Brazil Taurum OR Sementes 1998 Brazil
Fundacep Campo Real Fundacep 2009 Brazil Topázio OR Sementes 2011 Brazil
Fundacep Cristalino Fundacep 2006 Brazil Turquesa OR Sementes 2011 Brazil
Fundacep Horizonte Fundacep 2009 Brazil Valente OR Sementes 2004 Brazil
Fundacep Nova Era Fundacep 2004 Brazil Vanguarda OR Sementes 2008 Brazil
Fundacep Raízes Fundacep 2006 Brazil Vaqueano OR Sementes 2008 Brazil
TEC Frontale Fundacep 2012 Brazil Bandeirantes Unknown origin 1949 Brazil
TEC Triunfo Fundacep 2012 Brazil Pasuco Introduction # Argentina
TEC Veloce Fundacep 2012 Brazil Canindé 11 IPTA 2010 Paraguay
TEC Vigore Fundacep 2012 Brazil Canindé 12 IPTA 2010 Paraguay
IAC 375 Parintins IAC 2003 Brazil Canindé 13 IPTA 2010 Paraguay
IAC 5 Maringá IAC 1966 Brazil Canindé 3 IPTA 2007 Paraguay
Altar IAPAR 2000 Brazil IAN 10 CAPECO/INBIO # Paraguay
IAPAR 1 Mitacoré IAPAR 1980 Brazil IAN15 CAPECO/INBIO # Paraguay
IAPAR 17 Caeté IAPAR 1986 Brazil Itapua 40 CAPECO/INBIO # Paraguay
IAPAR 28 Igapó IAPAR 1988 Brazil Itapua 45 CAPECO/INBIO # Paraguay
IAPAR 3 Aracatu IAPAR 1981 Brazil Itapua 50 CAPECO/INBIO # Paraguay
IAPAR 30 Pirata IAPAR 1988 Brazil Itapua 60 CAPECO/INBIO # Paraguay
IAPAR 6 Tapejara IAPAR 1982 Brazil Itapua 70 CAPECO/INBIO # Paraguay
IAPAR 78 IAPAR 1996 Brazil Anahuac Introduction/CIMMYT 1981 Mexico
IPR 128 IAPAR 2006 Brazil Cocoraque Introduction/CIMMYT 1981 Mexico
IPR 129 IAPAR 2006 Brazil Jupateca 73 Introduction/CIMMYT 1978 Mexico
IPR 130 IAPAR 2007 Brazil Kosoro Introduction/CIMMYT # Mexico
IPR 136 IAPAR 2007 Brazil Moucho Introduction/CIMMYT # Mexico
IPR 144 IAPAR 2009 Brazil Sonora 63 Introduction/CIMMYT 1972 Mexico
IPR 85 IAPAR 1999 Brazil Sonora 64 Introduction/CIMMYT 1975 Mexico
IPR Katuara IAPAR 2012 Brazil Chinese Spring Introduction # China
IAS 54 IAS/IPEAS 1970 Brazil NING 7840 Introduction # China
IAS 58 IAS/IPEAS 1972 Brazil Shangai 5 Introduction # China
IAS 64 IAS/IPEAS 1974 Brazil Suzhoe #2 Introduction # China
Londrina IAS/IPEAS 1972 Brazil Suzhoe #6 Introduction # China
Confiança IPB 1977 Brazil Suzhoe #8 Introduction # China
Abalone OR Sementes 2006 Brazil
207 in chromosome 4D to 767 in chromosome 5B (Figure 1), averaging 478.5 markers per chromosome. The number of markers observed in each wheat genome was 3,429 in genome A (34%), 3,808 in genome B (38%), and 2,762 in genome D (28%). Fifty markers have not yet been mapped in the wheat genome.
Shavrukov et al. (2014) used wheat varieties from Kazakhstan and the SNP platform Infinium 9k (Illumina) for wheat and identified 46% informative markers. In their work, 49% were associated with the A genome, 46% with the B genome, and 5% with the D genome. In addition to being larger, the
marker panel used in the present study is better distributed across the three wheat genomes.
The estimates of genetic distances among the 211 varieties ranged from 0.013 (between ‘BRS 193’ and ‘Tucano’) to 0.471 (between ‘Canindé 13’ and ‘BR 34’). Of all distances, 71.34% lay between 0.31 and 0.40 (Figure 2). Khan et al. (2015) evaluated the variability existing in a collection of 95 tetraploid and hexaploid varieties of wheat from India and Turkey. The genetic distances obtained among hexaploid varieties varied from 0.02 to 0.29 in India and from 0.05 to 0.58 in Turkey, which is a similar level of variability to that obtained in this study.
In a previous study, we investigated the genetic variability of a set of 36 Brazilian varieties of wheat using microsatellite markers, and identified genetic distances of 0.10 to 0.88 (Schuster et al. 2009). Bered et al. (2001) also evaluated the variability of Brazilian wheat varieties, using RAPD markers, and observed distances from zero to 0.32. In these two studies, a small number of varieties and a small number of markers was used, resulting in higher estimates of variability in one case and lower estimates in the other. Here, we used a broader coverage of the genome, obtained from the larger quantity of markers used, which made it possible to evaluate more accurately the real genetic variability situation of the wheat.
Figure 1. Distribution of the 10,049 SNP markers used to estimate the genetic distances in the 211 wheat chromosomes.
Figure 2. Frequency distribution of genetic distances among 211
Cluster analysis by the UPGMA method (Figure 3) had 12 groups formed containing more than one variety. The two largest groups contained 75 and 71 varieties, which represents 69% of the 211 varieties (Table 2). The third largest group comprised 26 varieties (group 10 in Table 2), with 172 (81%) of the set of 211 varieties clustered in these three groups. The other groups contained two to eight varieties. Five varieties did not cluster with any other (Ocepar 8 Macuco, Ocepar 20, Colonias, Anahuac, and Safira).
No relationships were observed between the groups and the breeding program of origin of the germplasm; i.e., the genetic variability observed in the wheat germplasm in Brazil is equally distributed across the local wheat breeding programs. The varieties developed by the institutions owning the largest number of wheat varieties in Brazil (Coodetec, Embrapa, OR Sementes, Fundacep, Iapar, and Biotrigo) are equivalently represented in the largest groups. This is a consequence of the so-called breeder’s right, provided for in the PVP Law in Brazil (Law 9456 of 1997). Article 10 (subsection III) of that law allows breeders to use commercial varieties of any origin to perform crosses and originate new varieties. In this way, there is some sort of germplasm being shared across the many breeding programs, and the genetic base of breeding programs may be similar.
Varieties developed in Paraguay and Mexico were distributed across the groups proportionally to the size of these groups. The exception was Mexican variety Anahuac, which did not cluster with any other variety. This was an expected result, since the development of wheat varieties in Brazil involved frequent use of the germplasm developed by CIMMYT (Mexico). In Paraguay, wheat varieties are developed using both the CIMMYT germplasm and Brazilian varieties. The six varieties introduced from China were clustered in the two largest groups. This means there is not a clear distinction between the wheat germplasms from Mexico, China, and Paraguay, when compared with the Brazilian wheat germplasm.
To evaluate the evolution of genetic variability in wheat over time in Brazil, we considered only the 185 varieties developed in the country. Twenty-one varieties were developed before 1980. Genetic distances among these varieties ranged from 0.05 to 0.40, averaging 0.33. The highest frequency of genetic distances among the varieties developed in Brazil before 1980 was between 0.30 and 0.40 (Figure 2); 78% of genetic distances were above 0.30 and over 93% of them were higher than 0.25.
In the group of Brazilian varieties, 35 were developed in the 1980s. Genetic distances among these varieties varied from 0.02 to 0.45, averaging 0.33. The highest frequency of genetic distances among the wheat varieties developed in the 1980s in Brazil lay in the range of 0.31 to 0.35 (Figure 2). Over 74% of genetic distances among the varieties developed in that period were higher than 0.30 and more than 92% were higher than 0.25.
In the 24 varieties developed in the 1990s, genetic distances ranged from 0.13 to 0.45, averaging 0.35. The highest frequency of genetic distances between the varieties developed in that decade was between 0.36 and
Figure 3. Clustering of 211 wheat varieties including 190 Brazilian and 31 introduced
Table 2. Clustering of 211 wheat varieties by UPGMA analysis based on the genetic distances obtained by high-density SNP marker data
Cluster Variety
1
CD 104 CD 1440 JF 90 Quartzo TBIO Mestre
CD 116 Ocepar 15 Ocepar 19 Suzhoe #6 Estrela Atria
BRS Louro Onix Pasuco CD 106 BR 1
CD 108 MGS 1 Aliança Kosoro Sonora 63 BRS Timbaúva
CD 123 Ocepar 17 Abalone Chinese Spring BRS Albatroz
BR 18 Terena CEP 29 Altar Campeiro TBIO Bandeirante
Jupateca 73 Frontana Ning 7840 CD 110 CNT 6
TBIO Iguaçu IAS 54 CD 102 BRS 210 Fundacep 52
Candeias Iapar 78 CD 112 TBIO Seleto IPR 136
BRS 276 Valente CD 114 BR 14 Iapar 17 Caeté
BRS 327 Bandeirantes TBIO Sinuelo BRS 328 Canindé 12
BR 7 Rubi CD 118 CNT 1 CD 109
Itapua 60 BRS 179 Fundacep Nova Era CD 107 BRS Umbu
CNT 9 CD 103 BRS 177 Encruzilhada IPR 130
BRS 208 BR 27 Suzhoe #2 TEC Frontale Fundacep Bravo
2
CD 1550 BR 28 BRS Parrudo CD 111 Itapua 70
Embrapa 42 IPR Catuara BRS 264 Tucano Ocepar 6 Flamingo
CD 124 Fundacep Raízes BRS Sabiá BRS 193 TBIO Alvorada
IAN 15 CD 101 IPR 128 Iapar 3 Aracatu BRS 120
CD 150 BRS 296 Mirante Itapua 40 Fundacep 37
CD 1252 CNT 10 BR 15 Ocepar 9 Perdiz TEC Triunfo
BRS 229 CNT 7 TBIO Toruk Ocepar 13 Acauã Turquesa
CNT 5 CD 5 Pavão IPR 129 Ocepar 14
Embrapa 21 BR 8 Jandaia Ocepar 10 Garça CD 122
BR 2 BRS 207 BR 37 Ocepar 11 Juriti CD 1144
Suzhoe #8 TEC Veloce CEP 14 Tapes Shangai 5 Sonora 64
BR 5 CD 121 Iapar 1 Mitacoré Vaqueano Confiança
BR 23 Supera CD 113 IAS 64 CD 120
Avante Itapua 45 Nambu BR 30 Cadiveu BRS 329
Fundacep Cristalino
3 Fundacep 40 IAC 375 Parintins Marfim
4 Fundacep HorizonteCD 154 TEC VigoreCD 1805 Fundacep 50Moucho Fundacep Campo Real Iapar 6 Tapejara
# Ocepar 8 Macuco
5 BRS 254 BRS Angico
6 Ocepar 7 Batuira BRS Camboatá
# Ocepar 20
7 CD 1104 IPR 85 TBIO Pioneiro Pampeano BRS Camboim
8
CD 105 BRS 49 BRS Guamirim Iapar 28 Igapó BRS 331
IAN 10 TBIO Tibagi BRS 220 IAC 5 Maringá Iapar 30 Pirata
Londrina Topázio Cocoraque Taurum Itapua 50
IAS 58 Canindé 11 Canindé 13 IPR 144 Alcover
Vacaria Vanguarda CD 117 BRS Pardela FPS Nitron
BR 4
9 CD 119 Fundacep 30 TBIO Itaipu
10 Esporão Canindé 3 Ocepar 12 Maitaca
11 Ocepar 16 Ocepar 18 Ametista Jadeíte 11
# Colonias
# Anahuac
12 Ocepar 22 BR 34 BR 43 CEP 72 Sulino
0.40 (Figure 2). More than 83% of the genetic distances exceeded 0.30, and over 90% of them were greater than 0.25. Genetic distances among the 64 varieties developed in the 2000s varied from 0.07 to 0.45, averaging 0.33. The highest frequency of genetic distances among the varieties developed in the 2000s was between 0.30 and 0.35; however, a high frequency of distances between 0.36 and 0.40 was also observed (Figure 2). Over 78% of the varieties developed in this period exhibited genetic distances greater than 0.3, and more than 94% were above 0.25.
For the 41 varieties developed in the 2010s until the year 2014, genetic distances ranged from 0.12 to 0.43, averaging 0.34. The highest frequency of genetic distances observed in these newly developed varieties was between 0.31 and 0.35, but there was also a high frequency of distances between 0.36 and 0.40 (Figure 2). More than 81% of the genetic distances observed in this group of varieties was above 0.30, with over 96% higher than 0.25.
In the last four decades, the average genetic distances among wheat varieties in Brazil have remained between 0.33 and 0.34, and maximum distances between 0.43 and 0.45. Before the 1980s, the maximum genetic distance was 0.40. From the 1990s onwards, there has been a trend towards an increase in minimum genetic distances among the wheat varieties developed in Brazil. This means that genetic variability among the wheat varieties produced in Brazil have had a slight upward trend in variability for more than 40 years, as observed by the increasing minimum distances among the recently developed varieties.
Analyses of genetic variability based on pedigree or morphological data usually demonstrate a reduction of genetic variability over time. The narrowing of genetic variability would typically occur in stages: initially, by the substitution of local varieties (landraces) for improved varieties, followed by modern breeding practices, especially through interspecific breeding of a small group of elite varieties.
Recent studies investigating genetic variability at DNA level have shown maintenance and, in some cases, increases in genetic variability with time. Manifesto et al. (2001) also observed that genetic variability was kept the same in Argentinean wheat varieties developed between the 1960s and the 1990s. In central and northern Europe, Huang et al. (2007) detected increased genetic variability among wheat varieties developed between 1950 and 1990. The same was noted by Balyan et al. (2008) in wheat varieties developed in India between 1910 and 2006; by Khlestkina et al. (2004) in Europe and Asia in wheat varieties developed from the 1920s to the 1980s (Austria), from the 1940s to the 1990s (Albania), from the 1930s to the 1970s (India), and from the 1930s to the 1970s (Nepal).
In CIMMYT, Reif et al. (2005) and Warburton et al. (2006) observed an increase in genetic variability in wheat since the 1990s. Huang et al. (2007) reported an increase in genetic variability of wheat since the 1950s in the United Kingdom, and Hysing et al. (2008) also described the same in United Kingdom since the 1970s. Prasad et al. (2009) reported an increase in genetic variability in the United States since the 1970s. Fu and Sommers (2009), on the other hand, observed a reduction in genetic variability over time in wheat varieties
developed in Canada between 1845 and 2004.
Genetic variability among the genotypes of different eras represented by the varieties developed in Brazil in each of the decades mentioned here ranged from 0.06 to 0.08. In spite of the small distances, a gradual evolution can be seen in these eras. The gene sets developed in the 2000s and in the 2010s are the closest, and both are closer to the gene set developed in the 1990s. The genotypes of these three eras are slightly farther from the genotypes developed in the 1980s and before (Figure 4). This demonstrates that although genetic variability was maintained, the current group of genotypes are farther from the older group of genotypes, suggesting that the germplasm is being modified (improved) by the breeding program without having its variability reduced.
In theory, plant breeding causes narrowing of genetic
Figure 4. Genetic distances and UPGMA cluster analysis among
variability, because all breeding programs select the new germplasm in the same direction; i.e., high yields, disease resistance, grain quality, narrow maturity group interval, uniform plant high, and other characteristics. Crossing few number elite lines to generate new breeding populations results in increased inbreeding, which means, in theory, a reduction of genetic variability. Genetic distances between the individuals estimated by pedigree is based on probability. The probability of similarity of each pair of sisters, for instance, is the same. This means we need to assume that all pairs of sisters have the same genetic distance, which is not true. Accessing the genetic differences between the individuals through molecular markers makes it possible to quantify the real number of differences between individuals. To accurately estimate genetic variability, molecular markers need to adequately cover the genome of the species. High-density genotyping is the best way to better cover the genome with molecular markers.
Using estimates of genetic variability based on molecular markers also allows for better exploring variability, because molecular markers can reveal variability that cannot be accessed by other ways. In this work, we demonstrate that the wheat germplasm being used in Brazil has a good level of variability, and this variability has been maintained in the last four decades. Introducing germplasm and using commercial varieties from other companies is part of the strategy used in Brazil, and this needs to be continued to avoid the narrowing of variability in Brazilian wheat.
CONCLUSION
Wheat variability in Brazil has been maintained in the last four decades. The approach used by Brazilian breeders is effective in avoiding reducing genetic variability while increasing performance. Germplasm introduction and the possibility of breeders freely using commercial varieties from other companies as a source of variability, in crosses, could be the main reasons to allow the maintenance of genetic variability.
REFERENCES
Balyan HS, Gupta PK, Mir RR and Kumar J (2008) Genetic diversity and population structure analysis among Indian bread wheat varieties. In Appels R, Eastwood R, Lagudah E, Langridge P, Mackay M, McIntyre L and Sharp P (eds) Proceedings of the 11th international wheat genetic symposium. Brisbane, p.185-187.
Bered F, Barbosa Neto JF, Rocha BM and Carvalho FIX (2002) Genetic variability in wheat (Triticum aestivum L.) germplasm revealed by RAPD markers. Crop Breeding and Applied Biotechnology 2: 499-506.
Bradbury PJ, Zhang Z, Kroon DE, Casstevens TM, Ramdoss Y and Buckler ES (2007) TASSEL: Software for association mapping of complex traits in diverse samples. Bioinformatics 23: 2633-2635.
Caixeta ET, Oliveira ACB, Brito GG and Sakiyama NS (2009) Tipos de marcadores moleculares. In Borém A and Caixeta ET (eds)
Marcadores moleculares. Second Edition. Folha de Viçosa, Viçosa,
p. 11-93.
Cruz CD, Carneiro PCS and Regazzi AJ (2014) Modelos biométricos
aplicados ao melhoramento genético. UFV, Viçosa, 668p. Fu YB and Somers DJ (2009) Genome wide reduction of genetic diversity
in wheat breeding. Crop Science 49: 161-168.
Huang XQ, Wolf M, Ganal MW, Orford S, Koebner RMD and Röder MS (2007) Did modern plant breeding lead to genetic erosion in European winter wheat varieties? Crop Science 47: 343-349.
Hysing SC, Säll T, Nybom H, Liljeroth E, Merker A, Orford S and Koebner RMD (2008) Temporal diversity changes among 198 Nordic bread wheat landraces and varieties detected by retrotransposon-based
S-SAP analysis. Plant Genetic Resources: Characterization and Utilization 6:113-125.
Khan MK, Pandey A, Thomas G, Akkaya MS, Kayis SA, Ozsensoy Y, Hamurcu M, Gezgin S, Topal A and Hakki EE (2015) Genetic diversity and population structure of wheat in India and Turkey. The Open-access
Journal of Plant Science7: 1-14.
Khlestkina EK, Huang XQ, Quenum FJB, Chebotar S, Röder MS and Börner A (2004) Genetic diversity in cultivated plants – loss or stability?
Theoretical and Applied Genetics 108: 1466-1472.
Manifesto MM, Schlatter AR, Hopp HE, Suárez EY and Dubcovsky J (2001) Quantitative evaluation of genetic diversity in wheat germplasm using molecular markers. Crop Science 41: 682-690.
Prasad B, Babar MA, Xu XY, Bai GH and Klatt AR (2009) Genetic diversity in the U.S. hard red winter wheat varieties as revealed by microsatellite markers. Crop and Pasture Science 60: 16-24.
Reif JC, Zhang P, Dreisigacker S, Warburton ML, Ginkel MVAN, Hoisington D, Bohn M and Melchinger AE (2005) Wheat genetic diversity trends during domestication and breeding. Theoretical and Applied Genetics 110: 859-864.
Riede CR, Campos LAC, Brunetta D and Alcover M (2001) Twenty six years of wheat breeding activities at IAPAR. Crop Breeding and Applied Biotechnology 1: 60-71.
SAS Institute (2015) JMP Pro 12.2.0 Available at <https://www.jmp.com/ en_us/home.html>. Accessed on October, 24, 2018.
Brasileira 39: 247-253.
Schuster I, Vieira ESN, Silva GJ, Franco FA and Marchioro VS (2009) Genetic variability in Brazilian wheat varieties assessed by microsatellite markers. Genetics and Molecular Biology 32: 557-563.
Shavrukov Y, Suchecki R, Eliby S, Abugalieva A, Kenebayev S and Langridge P (2014) Application of next-generation sequencing technology to
study genetic diversity and identify unique SNP markers in bread wheat from Kazakhstan. BMC Plant Biology 14: 1-13.
Warburton ML, Crossa J, Franco J, Kazi M, Trethowan R, Rajaram S, Pfeiffer W, Zhang P, Dreisigacker S and van Ginkel M (2006) Bringing wild relatives back into the family: recovering genetic diversity in CIMMYT improved wheat germplasm. Euphytica 149:289-301.