Autor para correspondência: Sebastião V. Canevarolo, Departamento de Engenharia de Materiais, Universidade Federal de São Carlos, Rod. Washington Luís, Km 256, CEP: 13565-905, São Carlos, SP, Brasil. E-mail: [email protected]
in the Mean Residence Time
Tomás J. A. de Mélo
Departamento de Engenharia de Materiais, UFCG
Luís A. Pinheiro
Departamento de Engenharia de Materiais, UEPG
Sebastião V. Canevarolo
Departamento de Engenharia de Materiais, UFSCar
Abstract: Residence time distribution (RTD) is a very important parameter in extrusion, either for simple polymer processing or for special processes like compounding, blending, reactive compatibilization, and controlled degradation. This work deals with the values of mean residence time (tn) as a function of the number of 45 degrees kneading elements in the screw profile, screw speed, and feeding rate. The tn values were calculated from the RTD curves, which in turn were determined by the technique of a marker added as a pulse in the steady state polymer flow. The values of tn were empirically modeled as a function of those parameters. The results showed that feeding rate is the most influent parameter, followed by number of kneading elements and screw speed. The modeling has given a quadratic function relating tn and the operational parameters tested.
Keywords: Extrusion, residence time distribution, feeding rate, screw profile, factorial design.
Introduction
Twin screw extruder (TSE) is a versatile melt mixing equipment for polymer processing mainly when special processes like reactive extrusion, compounding, and controlled degradation[1-3] are needed. Some TSE are designed to present a modular arrangement, with individual parts enabling the user to assemble a specific screw profile for each needs. The main screw elements are conveying and kneading elements. The latter are important to improve the dispersive and distributive mixing in polymer blends and composites[4,5].
During the extrusion process, the bulk melt is sheared by the screw and divided several times, inducing different velocities for different polymer chains, allowing the molecules to advance or delay. This results in a distribution of residence times (RTD) around a mean value[6-9]. The knowledge of the RTD is very important for polymer extrusion because it is related, among other things, to the level of polymer degradation[10-13] and special processes like reactive extrusion[14-17].
One of the ways to determine the RTD curve of a given processing condition is by a pulse response technique, where an amount of a material, different from the flowing polymer, called tracer or marker, is fed into the extruder and its concentration measured at a point downstream as a function of time[7]. The tracer concentration can be quantified by several ways: the extruded material is collected periodically and quantified by analytical or spectroscopic techniques. This type of analysis is known as off-line because it requires a previous collection of material to be analyzed.
However, there are some types of devices that detect the data in real time, being on- or in-line techniques[18]. In this way, the tracer must have some property or feature different from the material used in the main flow, such as chemical composition, refraction index, and magnetic remanence. Therefore, the tracer concentration can be detected as a particular property like
fluorescence intensity[19], electromagnetic radiation extinction[20], and ultrasound attenuation[21]. The real time techniques (on- and in-line) are very attractive because they capture higher amount of data quickly and do not need sample preparation, when compared with off-line techniques.
Canevarolo and Santos[23] and Mélo and Canevarolo[8,22] developed a detection system based on turbidimetry, where visible light extinction is used to infer the concentration of a tracer in a RTD experiments. The detector was coupled at the exit of an extruder and the tracers used were inorganic and organic pigments, others polymers and reactive systems. The works mentioned above detailed the methodologies used for the RTD detection.
The aim of the present work is to quantify the influence of operational parameters in the mean residence time value (tn) by the factorial design method. Literature states that this method is suitable when it is desirable to recognize the influence of particular parameters in processes and experiments[24].
Experimental
Materials
The flowing polymer used in this work was a random polypropylene copolymer (RP-347, provided by Braskem, Brazil), with 0.90 g/cm3 density and MFI = 10.3 g/ 10 minutes. The tracer used was a mixture of an organic pigment of blue phtalocyanine (CIBA Especialidades Químicas S.A.) and polypropylene in the ratio of 1:5, w/w. The pigment was dispersed in xylene at room temperature and added to a xylene/PP solution at 130 °C. The solvent evaporated under continuous stirring during this warming step. After this partial drying, the mixture was chopped into small cubes with a size of a pellet and dried under vacuum, at room temperature for a week.
A
R
T
I
G
O
T
É
C
N
I
C
O
C
I
E
N
T
Í
F
I
C
Influence of the operational parameters
The effect of operational parameters in tn was estimated applying empirical models based on the factorial design method and surface response analysis. These values were matricized and the data empirically fitted to an equation using a suitable software. For all the models tested, the significance of the model coefficients and the regression equation were statistically verified through a t and F test, respectively. For the tn evaluation three parameters were tested: throughput (Q), screw speed (S), and number of kneading elements in screw profile (N). Table 1 shows the set values of the processing parameters used.
Results and Discussion
Mean residence time as a function of screw speed, feeding rate and number of kneading elements
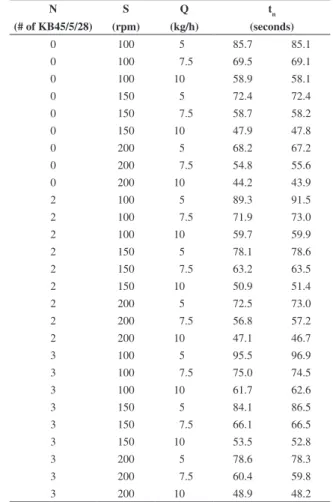
RTD curves have a trend close to a pulse function[16,17]. From them the mean residence time tn values were calculated and are shown in Table 2 done in duplicated, after 54 experiments.
From Figure 3 to 5 are shown the values of tn as a function of feeding rate, screw speed and number of kneading discs, respectively. It is clear that an increase in the feeding rate gives rise to a decrease in tn, due to the increase in the internal barrel pressure, which pumps the melted polymer faster downstream the extruder. An increase in screw speed gives rise to a decrease in the mean residence time due to the faster conveying action. On the other hand, an increase in the number of kneading elements increases the tn because these elements have a 45 degrees staggering angle which shows a poor conveying performance[16].
Mean residence time modeling
The effect of the operational parameters in the mean residence time observed so far was readily expected, according to the literature[7]. However, it is important to understand their individual
Extrusion
RTD measurements were performed in a twin-screw extruder (ZSK-30, Werner-Pfleiderer) equipped with a gravimetric K-Tron feeder, operating at steady state. The temperature profile was fixed constant at 210 °C along the all length of the extruder.
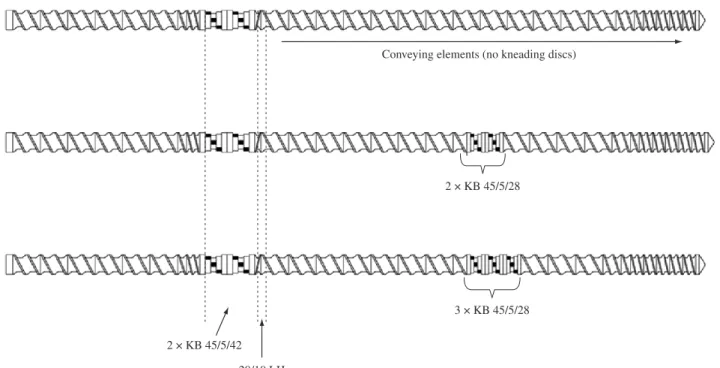
Once the extrusion process reached the steady state, the tracer was added in the feeding hopper and its concentration quantified as a function of the time by an optical detector coupled to a slit die fitted at the extruder exit. Others parameters were changed aiming to verify their influence on tn value. Throughputs used were 5, 7.5, and 10 kg/h; screw speeds were 100, 150, and 200 rpm. The screw profiles used are presented on Figure 1.
All screw profiles were designed with a melt seal region consisting of two KB45 kneading elements and one left handed conveying element, in order to assure the complete fusion of the polymer pellets at a fixed point along the screw. The differences among them can be observed in a mixture zone at the end of the second third of screw length. One profile present only conveying elements in this region; the second and the third screw profiles have two and three KB 45/5/28 kneading elements, respectively.
Residence time distribution measurements
The optical detection system was coupled to a slit-die fitted at the extruder exit, recording in-line the turbidity of the polymer flow[8,14], as shown in Figure 2.
Once the steady state have been reached during extrusion, the tracer was added in the main feeding hopper, the data collection software was triggered on, to measurer the tracer concentration as function of time. The mean residence time (tn), can be calculated according to the Equation 1:
t
t C dt
C dt
n 0
0
= ⋅ ⋅ ∫
⋅ ∫
= ∑ ⋅ ⋅
⋅ ∑
∞
∞
t C t
C t
i i i
i
i i i
∆
∆ (1)
where C is the tracer concentration at the time t.
Figure 2. Scheme of the optical detection system fitted at the extruder exit.
significance in the changes of the mean residence time. In order to check the contribution of each parameter tested, as well as to infer the tn values and calculate them according to established operational conditions we performed an empirical modeling correlating the mean residence time with those parameters. Some models were tested, including linear and second order relation between parameters. It was also estimated the interaction between them. The model that has provided the best fitting was a quadratic function with linear interaction between the parameters.
Table 1. Values of the processing parameters used in this work.
Parameter Value
Throughput (kg/h) - Q 5 7.5 10
Screw speed (rpm) - S 100 150 200
Screw profile
(number of KB 45/5/28 elements) - N 0 2 3
Table 2. The extrusion parameters and their correspondent mean residence
times tn (measured twice).
N (# of KB45/5/28)
S (rpm)
Q (kg/h)
tn (seconds)
0 100 5 85.7 85.1
0 100 7.5 69.5 69.1
0 100 10 58.9 58.1
0 150 5 72.4 72.4
0 150 7.5 58.7 58.2
0 150 10 47.9 47.8
0 200 5 68.2 67.2
0 200 7.5 54.8 55.6
0 200 10 44.2 43.9
2 100 5 89.3 91.5
2 100 7.5 71.9 73.0
2 100 10 59.7 59.9
2 150 5 78.1 78.6
2 150 7.5 63.2 63.5
2 150 10 50.9 51.4
2 200 5 72.5 73.0
2 200 7.5 56.8 57.2
2 200 10 47.1 46.7
3 100 5 95.5 96.9
3 100 7.5 75.0 74.5
3 100 10 61.7 62.6
3 150 5 84.1 86.5
3 150 7.5 66.1 66.5
3 150 10 53.5 52.8
3 200 5 78.6 78.3
3 200 7.5 60.4 59.8
3 200 10 48.9 48.2
Figure 3. Mean residence time (tn) as a function of the extrusion feeding rate.
Figure 4. Mean residence time (tn) as a function of the extrusion screw speed.
Figure 5. Mean residence time (tn) as a function of the number of the 45 degrees
kneading elements set in the screw profile.
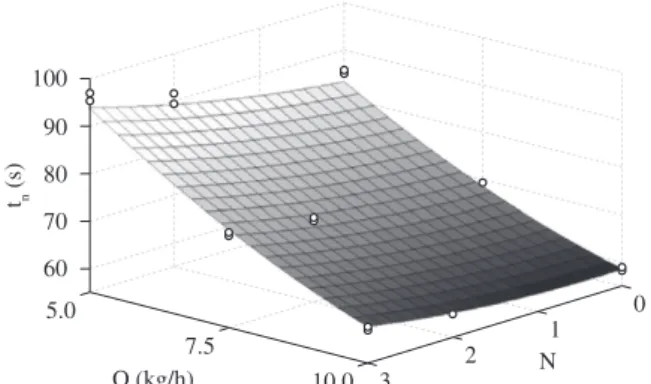
measured, independently of the trend of the curves, it is possible to observe that feeding rate has the highest contribution in the modeling proposed, which means that tn is more sensible to its variation. On the other hand, screw speed affects very little the tn values.
Conclusions
The effect of screw speed, number of 45 degrees kneading elements in the screw profile, and feeding rate upon the mean residence time during extrusion was analyzed by fitting an empirical model using the factorial design method. The best fitting presented linear and quadratic coefficients and a term due to the interaction between number of 45 degrees kneading elements and feeding rate. Feeding rate was the most important parameter in the modeling, followed by number of kneading elements and screw speed. This regression showed that mean residence time decreases with an increase in feeding rate, which corroborates the statement from literature that an increase in internal barrel pressure makes the polymer melt to be pumped faster. The mean residence time also decreases with increasing screw speed, because of the higher melt conveying performance, and with the increase in the number of kneading elements, as long as this type of element does not present a good conveying capacity. The regression equation presented a correlation coefficient (r2) of 0.9936, showing good fit with the experimental data, which is also corroborated by the plot of response surfaces and experimental data. The evaluation of the empirical model enables the calculation of the tn value in the range used in this work, showing that empirical modeling can be a useful tool to estimate the mean residence time tn values during processing.
screw speed. It is also important to notice that feeding rate and screw speed coefficients present a negative value, which means that tn increase with their decrease. This corroborates with the previous explanation that the pressure inside the barrel increases with throughput, the extruder pumping the material faster[4,7], whereas material is carried faster through the extruder if the screw speed is increased. Adding kneading elements to the screw profile increases the mean residence time because its mass transport characteristic is less efficient than conveying elements[4].
Figure 6 shows that the values of the linear coefficients (S, N, Q) are higher than the quadratic (S2, N2, Q2) and the interaction (N.Q) coefficients. However, the latter is needed to be included in the model in order to get a better fitting. From that one can say that the relevance of the quadratic coefficients for the screw profile (N2) and throughput (Q2) contributions, and the interaction between them (N.Q) are second order coefficients.
With the coefficient values in hand it is possible to draw the response surfaces of the mean residence time as a function of all parameters involved, which are shown in Figures 7 to 9. A good fit is verified in all situations and similarity between measured and calculated data corroborates the high value of the correlation coefficient (r2) that have been found. The results shown in these pictures corroborates with those presented in Figure 3, 4 and 5. The value of mean residence time increases with an increase in the number of kneading elements and with a decrease in screw speed and feeding rate. However, it is evident that there is a quadratic relation between the parameters tested and tn, mainly for the number of kneading elements and feeding rate.
The pictures also show an asymptotic trend to stabilize the tn at higher screw speeds and feeding rates. In the range of values
Figure 6. Coefficient values of the operational parameters.
Figure 7. Mean residence time (tn) as a function of screw speed and number
of 45 degrees kneading elements.
Figure 8. Mean residence time (tn) as a function of feeding rate and number
of 45 degrees kneading elements.
100
150
200 5.0
7.5
10.0 40
50 60 70 80 90
tn
(s)
S (rpm)
Q (kg/h)
Figure 9. Mean residence time (tn) as a function of screw speed and feeding
Acknowledgements
The authors thank Braskem and Ciba for the donation of polypropylene and pigment, respectively. The author also thanks CNPq and Capes for the financial support.
References
1. Utracki, L. A. - Polym. Eng. Sci, 35, p.2 (1992).
2. Rauwendaal, C. - “Polymer extrusion”, Hanser, New York (1986). 3. Lawal, A. & Kalyon, D. M. - Polym. Eng. Sci., 35, p.1325 (1995). 4. Dreiblat, A. & Eise, K. “Intermeshing corotating twin-screw extruders”,
in: Mixing in polymer processing, p.241, Rauwendaal, C. (ed.), Marcel Dekker, New York, (1991).
5. White, J. L. - “Twin screw extrusion: technology and principles”, Hanser, New York (1990).
6. Levenspiel, O. – “Engenharia das reações químicas”, Edgard Blücher, São Paulo (2000).
7. Todd, D. B. – Polym. Eng. Sci., 15, p.437 (1975).
8. Mélo, T. J. A. & Canevarolo, S. V. – Polímeros, 12, p.255 (2002). 9. Calumby, R. B. R. & Canevarolo, S.V. – Intern. Polym. Proces., 17,
p.183 (2002).
10. Babetto, A. C. & Canevarolo, S. V. Polímeros, 10, p.90 (2000). 11. Pinheiro, L. A.; Chinelatto, M. A. & Canevarolo, S. V. – Polym. Degrad.
Stab., 86, p.445 (2004).
12. Cáceres, C. A. & Canevarolo, S. V. – Polym. Degrad. Stab., 86, p.437 (2004).
13. Cáceres, C. A. & Cavevarolo, S. V. – Polímeros, 18, p.348 (2008). 14. Mélo, T. J. A. & Canevarolo, S. V. – Polym. Eng. Sci., 45, p.11
(2005).
15. Pinheiro, L. A.; Hu, G.-H.; Pessan, L. A. & Canevarolo, S. V. – Polym. Eng. Sci., 48, p.806 (2008).
16. Pinheiro, L. A.; Bitencourt, C. S.; Pessan, L. A. & Canevarolo, S. V. –
Macromol. Symp., 245, p.347 (2006).
17. Canevarolo, S. V.; Bertolino, M. K.; Pinheiro, L. A.; Palermo, V. &
Piccarolo, S. – Macromol. Symp., 279, p.191 (2009).
18. Coates, P. D.; Barnes, S. E.; Sibley, M. G.; Brown, E. C.; Edwards, H. G. M. & Scowen, I. J. – Polymer, 44, p.5937 (2003).
19. Hu, G.-H. & Kadri, I. – Polym. Eng. Sci., 39, p. 930 (1999).
20. Hornsby, P. R.; Tung, J. F. & Taverdi, K. – J. Appl. Polym. Sci., 53, p.891 (1994).
21. Gendron, R.; Daigneaut, L. E.; Tatibouet, J. & Dumoulin, M. - Adv. Polym. Tech., 15, p. 111 (1996).
22. Mélo, T. J. A. & Canevarolo, S. V. – Polym. Eng. Sci., 42, p.170 (2000).
23. Canevarolo, S. V. & Santos, D. M. – Polímeros, 9, p. 60 (1999). 24. Nachtigall, S. M. B.; Neto, R. B. & Mauler, R. S. – Polym. Eng. Sci.,
39, p.630 (1999).
Enviado: 03/03/10 Reenviado: 15/05/10 Aceito: 18/05/10