Slag Evaluation to Reduce Energy Consumption and EAF Electrical Instability
Deisi Vieiraa*, Rodolfo Arnaldo Montecinos de Almeidaa, Wagner Viana Bielefeldta, Antônio Cezar Faria Vilelaa
Received: November 25, 2015; Revised: June 24, 2016; Accepted: August 10, 2016
In steel mills that operate with electric arc furnaces (EAF), it is interesting to ensure greater stability to the electric arc to aim at less distortion in the electrical system, with consequent reduction in electric power consumption. The slag foaming increases electric arc stability by reducing the total harmonic distortion (THD) between EAF phases. In this study, information about the chemical composition of the slag and electrical parameters of an EAF were collected. With the composition data, it was possible to determine the FeO and MgO content and basicity of the foamy slag which caused a reduction in
THD and in electric power consumption. The efective viscosity of foaming slag was calculated and an increase in the efective viscosity provided a decrease in THD. A reduction of THD showed a decrease in the consumption of electric power in the EAF reining stage.
Keywords: Foamy slag; Electric arc stability; Electric power consumption of the EAF
* e-mail: [email protected]
1. Introduction
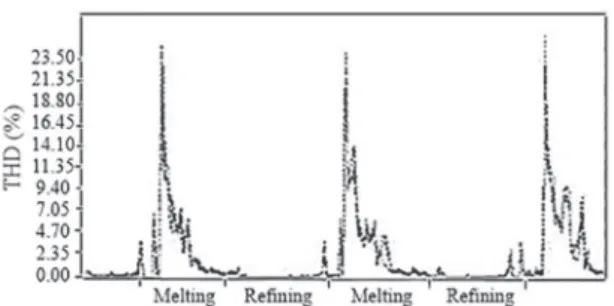
Harmonics are caused by non-linear loads that draw a non-sinusoidal current from a sinusoidal voltage source. An example of a harmonic producing load is electric arc furnaces. The sum of the harmonics contents can be represented by the total harmonic distortion (THD), as shown in Figure 1. Note that the graph peaks show that in scrap melting there is a strong intensity of voltage harmonics. On the other hand,
in the reining stage, the stability increases signiicantly,
because THD is reduced1.
The harmonics caused by the instability are higher in
the irst minutes of the melting process. The voltage and current proile at the start of scrap melting and after forming
foamy slag is shown in Figure 2. Note a great reduction of harmonics, and a waveform closer to sinusoidal in shape2.
The slag foaming quality is an important factor to be studied in steel production in EAF process. The foamy slag contributes to reduce energy costs as it ensures that the heat from the liquid bath is not lost through the EAF walls. Furthermore, if a good slag foaming is ensured,
energy eiciency of the furnace increases. Also, there is a
reduction in the vibrations, noise and electrode consumption. The turbulence generated during the melting creates large
luctuations, nonlinearity and instability of the electric arc current in the diferent phases. A good quality foaming slag
covers the charge and makes a smooth uniform path for current through three electrodes3.
Researchers seek to develop useful models to control slag foaming in steelmaking processes and understand the
inluence of the chemical composition of the slag4. The
foaming index, or average time for a gas to cross the slag is obtained by the ratio between the slag foam height and the
gas supericial velocity. Skupien and Gaskell5, developed
a mathematical model that shows the strong relationship between the foaming index and the physical properties of the slag, such as viscosity, density and surface tension5.
During EAF operation, the iron oxide (FeO) in the slag is typically formed by iron oxidation when oxygen is injected into the molten metal. FeO is an important component in
the slag and it has a signiicant efect in viscosity, foaming
capacity, slag volume, productivity and energy consumption6.
Aminorroaya7 showed in his study that there is an optimum
range of FeO to minimize energy consumption, Figure 37.
The slag binary basicity is a ratio between the oxides
%CaO and %SiO2. There are optimum points of basicity to
achieve lower energy consumption, Figure 47.
The use of slag saturated in MgO is of great importance in the EAF operation since the saturation in this oxide assists the formation of the foamy slag, contributing to higher
eiciency, lower energy cost, higher metal yield and longer
life of the refractory8. The amount of MgO in the slag causes
an increase in foaming index due to the higher amount of solid particles4.
This paper aims to relate the chemical composition and the
efective viscosity to the electrical parameters of an electric
arc furnace in order to reduce the instability of the electric arc
itself and electric power consumption in the reining stage.
2. Materials and Methods
Data from 156 steel heats of a speciic cold charge,
produced during one year, were collected. The selected cold a Steelmaking Laboratory – LaSid, Programa de Pós-Graduação em Engenharia de Minas, Metalúrgica
Figure 1: Total harmonic distortion during the melting and reining
process1.
Figure 2: Shapes of sine waves, without foamy slag (a) and with
foamy slag (b)2.
Figure 3: Relationship between the FeO content in slag and energy consumption7.
Figure 4: Relationship between basicity and energy consumption7.
charge has a controlled chemical composition because it is used to produce a critical steel quality. Thus, the dispersion of both the chemical composition and the operational process variables were minimized so that the results by the high variability of parameters that are being considered in this study are minimized.
The analyzed electrical data were received directly from the electrical system of an EAF.
An analysis to evaluate the dispersion of “power on”
(furnace time on) and “power of” (furnace time of) of the
furnace was made. Voltage and total harmonic distortion per second of each phase were made available (three electrodes) during the heats; with this, the standard deviation of these
data only in the reining interval could be calculated. Electric
power consumption of the heats in this interval was also obtained. The voltage, total harmonic distortion and electric power consumption are factors that are directly related to the stability of the electric arc.
The chemical composition of the analyzed slag was obtained by the standard slag sample furnace practice, taken
simultaneously with the steel during the reining period. In
addition, the FeO, MgO content and the basicity range were evaluated. The ranges that the chemical composition of FeO, MgO and basicity presented higher number of heats were compared to the electric power consumption. The physical properties of the slag were calculated, considering the temperature of 1600°C. This temperature was chosen by the average value found during the sampling. The viscosity was
calculated using the FactSage version 6.4 thermodynamic
simulation software9, using melts database.
The properties, models and their equations are presented below:
Slag density (Mills and Keene’s model)10 –
.
%
FeO
%
MnO
( )
2460
0 18
1
t
=
+
Q
+
V
ρ = Slag density;
%FeO = mass percent of iron oxide in the slag; %MnO = mass percent of manganese oxide in the slag.
Surface tension (Mills and Keene’s model)10 –
, . %SiO . %FeO ( ) 754 24 569 4 1002 137 13 100 2
v= - T Y-
S
X
σ= surface tension;
%SiO2 = mass percent of silica oxide in the slag;
%FeO = mass percent of iron oxide in the slag.
Efective viscosity (Roscoe-Einstein’s model)11 –
( )
1 / 3
e
5 2
h =hQ -xiV -ηe - Efective viscosity of the slag;
η - Viscosity of the molten slag;
θ - Fraction precipitated solid phases;
τ - Solid interaction parameter (in dilute suspension of spheres with diferent sizes, the parameter is equal to the unit)11.
The main solid particles found were (Mg,Fe)O (magnesium-wustite) and C2S (Ca2SiO4), according to the
thermodynamic calculations. The efective slag viscosity
values were compared to the THD, in order to evaluate the
3. Results and Discussion
The “power of” and “power on” were analyzed for all
156 heats, and were disregarded the heats that underwent a very long meltdown time due to any operation delay, to not
inluence the inal results.
From all the analyzed heats, 70% had a “power of”
time of less than 4 minutes. In the “power on” case, most of the heats are distributed in a wide range with times lasting
from 7 to 13 minutes. “Power of” time over 4 minutes and
“power on” times less than 7 minutes and greater than 13 minutes were not considered for better correlation, resulting in 72 heats considered in this study.
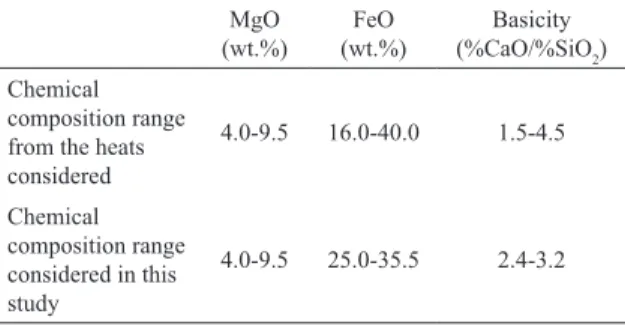
The range of chemical composition (MgO, FeO and
basicity) of the heats with “power of” time less than 4
minutes and “power on” times more than 7 minutes and less than 13 minutes are in Table 1.
MgO (wt.%)
FeO (wt.%)
Basicity
(%CaO/%SiO2)
Chemical composition range from the heats considered
4.0-9.5 16.0-40.0 1.5-4.5
Chemical composition range considered in this study
4.0-9.5 25.0-35.5 2.4-3.2
Table 1: Range of chemical composition of slag from the heats.
Table 1 shows that the FeO range considered in this study, between 25.0 – 35.0%, represents 55% of the heats
with “power of” time less than 4 minutes and “power on”
times more than 7 minutes and less than 13 minutes. The basicity values between 2.4 and 3.2 represent 64% of the heats. For the ideal foaming, the slag has to be at an optimum basicity value. If the slag shows low basicity, it will be very
luid, if it is extremely basic, there will be an excess of solid
particles hardening the slag and making it unlikely to foam12.
The energy consumed in the reining for the ranges
that the chemical composition of FeO, MgO and basicity presented higher number of heats, is shown in Tables 2 and 3.
Table 2: Extremes values obtained from electric power consumption for the main FeO ranges.
FeO Range (wt.%)
Minimum Electric Power Consumption
in Reining (kWh/t)
Maximum Electric Power Consumption
in Reining (kWh/t)
25.0-27.5 42.46 108.14
27.5-30.0 42.14 87.51
30.0-32.5 62.79 114.09
32.5-35.0 66.91 103.26
Table 3: Extremes values obtained from electric power consumption for the main basicity ranges.
Basicity Range
(%CaO/%SiO2)
Minimum Electric Power Consumption in
Reining (kWh/t)
Maximum Electric Power Consumption in
Reining (kWh/t)
2.4-2.6 71.75 108.54
2.6-2.8 69.02 97.59
2.8-3.0 67.68 114.09
3.0-3.2 67.08 94.24
It can be said that the best results occurred for the range between 27.5 to 30% of FeO, because it was found the lowest maximum and minimum points for energy consumption.
It can be observed that the basicity range that presented the best performance in terms of energy consumed during
reining is between 3 and 3.2, with the lowest maximum
energy consumption value of 94.24 kWh/t, and the point of lower energy consumption of 67.08 kWh/t. According to the study of Aminorroaya7, FeO ranges and ideal basicity
values were found to promote eicient foaming where it
reaches minimum energy consumption.
Basicity ranges that presented lower electric power
consumption were selected and the inluence of the MgO
content in the electric power consumption was analyzed, Figure 5.
Figure 5: MgO content and electric power consumption.
Figure 5 shows that the minimum electric power consumption occur when MgO content is close to 7.5%. In this content, the slag is saturated in MgO and having a
beneicial efect in the foamy slag, according to Ito4.
The behavior of the electric arc voltage and THD was evaluated during operation of the EAF, an example can be seen in Figure 6.
The reining stage is shown in Figure 6, showing
that the stability of the arc increases with the presence of
foaming slag, according to what Gandhare1 describes it in
Figure 7: Relationship between the voltage standard deviation and the THD standard deviation.
Note the linear relationship between the voltage standard deviation and the THD standard deviation of the EAF. This is due to the fact that the higher the instability of the arc, the greater the voltage deviation, and therefore the greater the voltage harmonics variation. Figure 8 shows the harmonics standard deviation relating with the FeO content, considering the FeO content between 25 and 32% and basicity between 2.4 and 3.2.
Figure 8: Relationship between the FeO content and the THD standard.
Figure 8 shows the point of minimal THD was found at 29% of FeO. At higher basicity and lower FeO contents, the slag would be over-saturated in second phase particles, making it unlikely to foam. High basicity slags need high FeO content to be saturated in second phase particles and not over-saturated.
Heats with FeO content between 27.5 and 35%, basicity between 2.6 to 3.2 were selected because they presented lower electric power consumption. Correlations between the THD standard deviation and the energy consumption can be seen in Figure 9, for the three phases of the EAF.
Figure 9: Electric power consumption in the reining and THD
standard deviation.
It can be seen that the lower the THD standard deviation, lower the distortion generated by harmonics, therefore there is less electrical instability, and less electric power consumption.
The relationship between the calculated efective viscosity
and THD standard deviation was performed, according to Figure 10. Heats with FeO content between 27.5 and 35%, basicity between 2.6 to 3.2 were used.
Figure 10: Relationship between efective viscosity calculated and
THD standard deviation.
Figure 6: Arc voltage behavior (left) and THD (right) during a heat.
Figure 10 shows the expected trend, where THD
decreases with the increase of the calculated efective viscosity. According to Skupien and Gaskell5 an increase of
the efective viscosity promotes a better foaming slag and,
consequently stabilizes the electric arc.
4. Conclusions
Considering the process conditions, the values of lower electric power consumption are found for the ranges of:
- FeO content between 27.5 and 30%; - Basicity between 3.0 and 3.2;
- MgO content between 7 and 8%, for the heats that are within the optimum range of FeO and basicity.
Analyzing electrical data:
- The relationship between the voltage standard deviation and arc THD behaved linearly;
- The THD and electric power consumption in reining
had a positive correlation;
- The relationship between the efective viscosity and the
THD behaved linearly with a negative correlation.
5. Acknowledgment
Deisi Vieira thanks Professor Wagner Bielefeldt, for the guidance and support, Professor Antônio Vilela for the
opportunity, the Steelmaking Lab team at UFRGS, the Luiz Englert Foundation and CNPq for inancial support.
6. References
1. Gandhare WZ, Lulekar DD. Analyzing Electric Power Quality in
Arc Furnaces. In: Proceedings of International Conference on Renewable Energies and Power Quality (ICREPQ’07); 2007
Mar 28-30; Sevilla, Spain. 272.
2. Sedivy C, Krump R. Tools for foaming slag operation at
EAF steelmaking. Archives of Metallurgy and Materials. 2008;53(2):405-409.
3. Dehkordi BM, Moallem M, Parsapour A. Predicting Foaming Slag Quality in Electric Arc Furnace Using Power Quality Indices
and Fuzzy Method. IEEE Transactions on Instrumentation and Measurement. 2011;60(12):3845-3852.
4. Ito K, Fruehan RJ. Study on the foaming of CaO-SiO2-FeO
slags: Part I. Foaming parameters and experimental results.
Metallurgical and Materials Transactions B. 1989;(4):515-521.
5. Skupien D, Gaskell DR. The surface tensions and foaming behavior of melts in the system CaO-FeO-SiO2. Metallurgical and Materials Transactions B. 2000;31(5):921-925.
6. Luz AP, Ávila TA, Bonadia P, Pandolfelli VC. Slag Foaming:
Fundamentals, Experimental Evaluation and Application in the
Steelmaking Industry. Refractories World Forum. 2011;3(2):91-98.
7. Aminorroaya-Yamini S, Edris H. The Efect of Foamy Slag in
the Electric Arc Furnaces on Electric Energy Consumption. In:
Proceedings of 7th European Electric Steelmaking Conference;
2002 May 26-29; Venice, Italy. p. 2447-2456.
8. Bennett J, Kwong KS. Thermodynamic Studies of MgO Saturated EAF Slag. Ironmaking & Steelmaking. 2010;37(7):529-535.
9. Paulino MAS, Klug JL, Bielefeldt WW, Vilela ACF, Heck N.
Obtenção de Escória Espumante em Forno Elétrico a Arco:
Determinação das Composições para o Sistema
CaO-SiO2-MgO-FeO. In: 45º Seminário de Aciaria - Internacional; 2014 May 25-28; Porto Alegre, Brazil.
10. Mills KC, Keene BJ. Physical Properties of BOS Slag. International Materials Reviews. 1987;32(1):1-120.
11. Roscoe R. Viscosity of Suspensions of Rigid Spheres. British Journal of Applied Physics. 1952;3(8):267-269.
12. Pretorius EB, Carlisle RC. Foamy slag fundamentals and their practical application to electric furnace steelmaking. In: 16th
Process Technology Conference Proceedings; 1998 Nov 15-18;