*e-mail: marcio.andreato@gmail.com
Selection of Compositions with High Glass Forming Ability in the Ni-Nb-B Alloy System
Marcio Andreato Batista Mendesa*, Luis César Rodríguez Aliagab, Claudio Shyinti Kiminamib,
Marcelo Falcão de Oliveirac, Walter José Bottab, Claudemiro Bolfarinib
aPrograma de Pós-graduação em Ciência e Engenharia de Materiais, Departamento de Engenharia de
Materiais, Universidade Federal de São Carlos – UFSCar, Rod. Washington Luis, Km 235, CEP 13565-905, São Carlos, SP, Brasil
bDepartamento de Engenharia de Materiais, Universidade Federal de São Carlos – UFSCar,
Rod. Washington Luis, Km 235, CEP 13565-905, São Carlos, SP, Brasil
cDepartamento de Engenharia de Materiais, Aeronáutica e Automobilística, Universidade de São Paulo – USP,
Av. Trabalhador São-carlense, 400, CEP 13560-970, São Carlos, SP, Brasil
Received: November 11, 2011; Revised: May 10, 2012
A combination of an extension of the topological instability “λ criterion” and the “average electronegativity” has been recently reported in the literature to predict compositions with high glass-forming ability (GFA). In the present work, both criteria have been applied to select the Ni61.0Nb36.0B3 alloy with a high glass-forming ability. Ingots were prepared by arc-melting and were used to produce ribbons processed by the melt-spinning technique further characterized by differential scanning calorimetry (DSC), X-ray diffraction (XRD) and scanning electron microscopy (SEM). The Ni61.0Nb36.0B3 alloy revealed a complete amorphization and supercooled liquid region ∆Tx = 68 K. In addition, wedge-shaped samples were prepared using copper mold casting in order to determine the critical thickness for amorphous formation. Scanning electron microscopy (SEM) revealed that fully amorphous samples could be obtained, reaching up to ~800 µm in thickness.
Keywords: metallic glass, rapid solidification processing, ternary alloy systems
1. Introduction
The search for new bulk metallic glasses (BMG) has traditionally been guided by models and semi-empirical approximations in order to predict composition in a given system. In that context, it is worth noting these different empirical rules: the atomic mismatch, negative heat of mixing among the alloying elements, and alloys consisting of more than two elements, better known as the multicomponent effect1. The latter condition adds high complexity degree to the alloy according to the “confusion principle”2; thus, the supercooled melt leads to easy amorphous phase formation during rapid quenching.
The selection of good glass-former compositions is a crucial factor in the development of bulk metallic glasses. For forecasting compositions in the Ni-Nb-B ternary system with high glass-forming ability, we used the combination of two criteria: topological instability “λ criterion” and the average electronegativity ∆e. The “λmin criterion”, which is based on the concept of topological instability of a stable crystalline structure, was first proposed to justify the amorphization of binary solid solution alloys3. In the original criterion, the topological destabilization of a crystalline structure was associated with a critical solute concentration necessary to exceed the mean elastic volume strain in supersaturated solid solutions. A simple extension of this criterion was more recently applied to predict the
best glass-forming compositions. This was shown to lie within fields of mutual and simultaneous topological instability of all the crystalline phases competing with glass formation in binary and ternary systems4-7. This extension can be calculated from atomic radii or molar volumes of the compounds with the expression6:
0
1
i i
Vm x
Vm
λ=∑ − (1)
where χi is the molar fraction of any component element in a given stoichiometric compound (or simple metal); Vmi is the molar volume of the solute elements and Vm0 is the molar volume of the compound. The authors point out that the above equation can lead to substantial errors when the packing factors of elements and compounds differ significantly (see Kiminami et al.5 for further details). On the other hand, it is worthy to note that, for a good prediction of the GFA, it is necessary to have a full knowledge about the crystalline phases of the system because the results are given as a ranking of the GFA among all compositions in any region of the system.
Selection of Compositions with High Glass Forming Ability in the Ni-Nb-B Alloy System
formation enthalpy (∆H) and its glass stability8,9. It is therefore reasonable to assume that the higher the average electronegativity difference among the elements, the higher the glass forming ability6. The average electronegativity can be calculated from the atomic fractions of each element6:
i j i j
e x s e e
∆ =∑ ∑ − (2)
where ∆e is the average electronegativity difference; χi is the atomic fraction of each element; ei is the Pauling’s electronegativity of a central atom; ej is the electronegativity of each neighbor and Sj is the surface concentration according to:
2/3
2/3
( )
( )
j mj j
j mj x V S
x V
=
∑ (3)
where χj is the atomic fraction of each element in the alloy and Vmj is the molar volume.
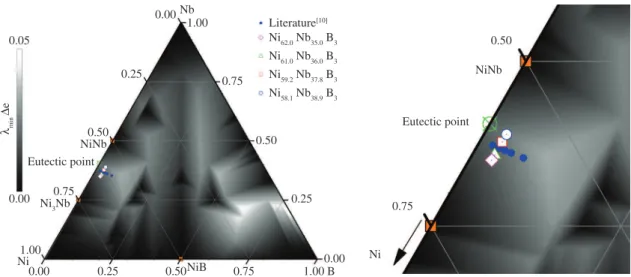
Based on this assumption, a plot is built by taking the minimum λ parameter calculated for any given composition according to Equation 1, and then this plot is combined with the average electronegativity difference (∆e) according to Equation 2. The plot is thus a simple multiplication of the minimum topological instability and electronegativity criteria. The “peaks” on this map, represented by brighter white regions, express compositions where the topological instability and electronegativity criteria reach a maximum among the surrounding stable phases. Within a given system, the highest peaks are the most probable places for good glass forming ability (see Figure 1).
In this work, making use of the λmin × ∆e GFA map of the Ni-Nb-B ternary system, compositions were evaluated and some compositions indicated as holders of the best GFA were selected. These compositions are located in the same region studied by Aliaga et al.10, who used the topological instability criterion combined with the thermodynamic approach γ* to select glass former compositions in the Ni-Nb-B ternary system.
2. Experimental
The selected compositions were prepared by arc-melting mixtures of pure Ni (99.99%), Nb (99,9%) and B (99.9%) in a Ti-gettered high-purity argon atmosphere. The ingots were remelted several times to ensure chemical homogeneity. Amorphous ribbons were obtained by melt-spinning in a Cu-wheel (200 mm diameter) rotating at a peripheral velocity of 30 m/s. Bulk wedges samples with 0.5 µm up to 5 mm in thickness and 40 mm in length were produced by the conventional copper mold casting method. The ribbons, with a width of ~3 mm and a thickness of about 35 µm, and the wedge specimens were characterized by X-ray diffraction (XRD) with Cu-Kα radiation and scanning electron microscopy (SEM). The thermal stability was evaluated using differential scanning calorimetry (Netzsch 404 DSC) at a heating rate of 0.67 K/s under a flowing Ar atmosphere.
3. Results and Discussions
As earlier described, the synergic map of topological instability and average electronegativity were computed for the Ni-Nb-B ternary system, as shown in Figure 1. This figure also shows the compositions selected by Aliaga et al.10, and it is noted that their compositions are located at regions of the λmin × ∆e map near the highest peaks in the map, which are the most probable regions for good glass-forming ability. Besides, these compositions are located close to the deep eutectic point, so the melting point of the resulting alloy is lowered. Thus, we selected compositions near the Ni60.14Nb36.86B3 composition that showed the best thermal parameters published by Aliaga et al.10. As indicated in Figure 1, we selected four compositions to study: Ni62.0Nb35.0B3, Ni61.0Nb36.0B3, Ni59.2Nb37.8B3 and Ni58.1Nb38.9B3.
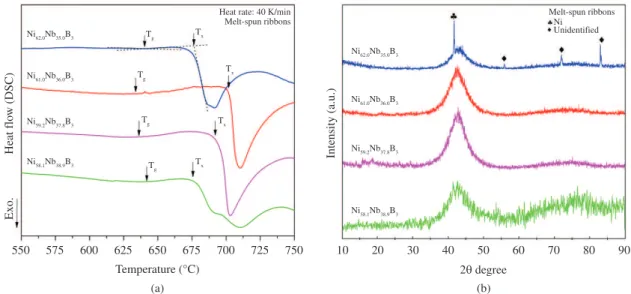
Figure 2a shows the DSC thermograms corresponding to the same alloys, obtained at a constant heating rate of 40 K/min. All the curves are typical of amorphous structure, exhibiting one endothermic peak corresponding to the
Figure 1. Minimum λ and average electronegativity (λmin × ∆e) map (in gray scale) showing the selected compositions and the compositions studied by Aliaga et al.10
event of glass transition into a supercooled liquid followed by exothermic peaks. Aliaga et al. have observed that the structural transformation into the final phases occurs in different steps with different boron concentrations. This transformation is not so clear in our work because of the reduce temperature range used during the measurements. However, in the Ni58.1Nb38.9B3 composition, which is the nearest to the eutectic point, two exothermic events caused by crystallization of the amorphous phase were present. Additionally, this composition showed shallow peak, which is characteristic of complete crystallization involving decomposition into different intermetallic compounds. The maximum supercooled liquid region of 68 °C was obtained in the Ni61.0Nb36.0B3 alloy, which is larger than that obtained by Aliaga et al. (∆Tx = 60 °C). Figure 2b shows the XRD patterns obtained from the different compositions in the form of quenched melt-spun ribbons. Alloys with high
λmin × ∆e values presented a broad diffuse halo around 2θ≈ 42.5°, which are diffraction patterns typical of an amorphous structure. The Ni62.0Nb35.0B3 composition with the lowest value of λmin × ∆e (see Table 1) also presented a diffraction halo typical of an amorphous structure, but with an indication of relatively lower GFA due to the presence of low intensity peaks associated with crystalline phases.
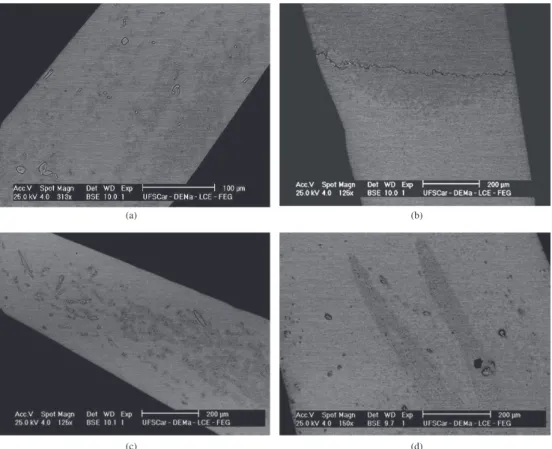
Figure 3 shows the scanning electron micrograph of the transition region of amorphous phase to crystalline phase in a wedge-section. The Ni58.1Nb38.9B3 alloy with the highest value of of λmin × ∆e (see Table 1) shows the best result with a maximum amorphous thickness of 800 µm. The regions in which crystalline phases appear clearly in Ni62.0Nb35.0B3, Ni61.0Nb36.0B3, Ni59.2Nb37.8B3, and Ni58.1Nb38.9B3 alloys are 200, 600, 325 and 800 µm thick, respectively. Figure 4a shows details of the amorphous tip and Figure 4c shows crystalline phases such as dentrites in the Ni58.1Nb38.9B3 alloy.
Table 1 summarizes the parameters of supercooled liquid region ∆Tx, the critical thickness for the wedge specimens (∆Xmax) and the value of λmin × ∆e. The onset temperature
of glass transition (Tg) and the event of crystallization (Tx) were determined using the tangent method. Our experimental results indicate that the ∆Tx was enhanced with the increasing of the Ni contents, reaching the highest value in the Ni61.0Nb36.0B3 composition, and for greater increases in Ni contents there is a decrease of ∆Tx. However, this composition did not show the maximum amorphous thickness. The maximum amorphous thickness was obtained by the Ni58.1Nb38.9B3 composition with the highest value of λmin × ∆e, which validates the use of the criteria here described. On the other hand, this composition showed the lowest value of ∆Tx, which would indicate the lowest glass forming ability11. Therefore, the use of λ
min × ∆e criteria has been shown to be suitable for predicting compositions with high glass forming ability in the Ni-Nb-B system.
Compared with the result reported in the literature for the Ni62Nb38 binary alloys that showed a ∆Tx = 40 °C and BMGs up to 2 mm in diameter12, the addition of boron revealed an increase of ∆Tx up to 68 °C, but with a decrease of maximum amorphous thickness. In addition, Aliaga et al.10 obtained a BMG with 1 mm in diameter fully amorphous and ∆Tx = 60 °C for the Ni60.14Nb36.86B3 composition. For this reason, further experiments are required to cast the composition with higher λmin × ∆e values into larger sizes to tell their relevant glass forming ability.
Table 1. Thermal parameters of melt-spun ribbons and the critical thickness for the wedge specimens.
Composition Tg (°C)
Tx (°C)
∆Tx (°C)
∆Xmax
(μm) λmin × ∆e
Ni62.0Nb35.0B3 643 678 35 200 0.017 Ni61.0Nb36.0B3 645 702 68 600 0.018 Ni59.2Nb37.8B3 639 695 56 325 0.021
Ni58.1Nb38.9B3 642 677 35 800 0.022
Selection of Compositions with High Glass Forming Ability in the Ni-Nb-B Alloy System
Figure 4. Microstructure of Ni58.1Nb38.9B3 alloy: a) amorphous region in wedge-section tip; b) transition region to crystalline phase; and c) detail of the crystalline region.
Figure 3. Scanning electron micrograph (BSE) showing the critical thickness for the wedge specimens: a) Ni62.0Nb35.0B3 (200 µm); b)
Ni61.0Nb36.0B3 (600 µm); c) Ni59.2Nb37.8B3 (325 µm); d) Ni58.1Nb38.9B3 (800 µm).
4. Conclusions
The correlation between the λmin × ∆e criteria and the GFA behaviors in the Ni-Nb-B ternary alloys has been analyzed. The Ni58.1Nb38.9B3 composition showed the better value of the criteria (λmin × ∆e = 0.022) and exhibited the best GFA, with a maximum amorphization thickness in the wedge-section copper mold of about 800 µm. However, this composition showed the lowest value of ∆Tx. The highest thermal stability (largest value of ∆Tx) was obtained with the Ni61.0Nb36.0B3 composition (68 °C), which is larger than the value obtained elsewhere10. In addition, the results showed a reduction of ∆Tx in the composition near the deep eutectic point, however, with a better value of the selection criterion.
It was concluded that the combination of the two criteria provides a practical and effective tool to identify good glass-forming compositions in the Ni-Nb-B ternary system, requiring as input only information that is readily available from phase diagrams and crystallographic handbooks for all crystalline phases.
Acknowledgements
The authors gratefully acknowledge FAPESP (Fundação de Amparo à Pesquisa do Estado de São Paulo, Brazil) for its financial support of this work.
References
1. Inoue A. Stabilization of metallic supercooled liquid and bulk amorphous alloys. Acta Materialia. 2000; 48:279-306. http:// dx.doi.org/10.1016/S1359-6454(99)00300-6
2. Jain SC, Willander M, Narayan J and Overstraeten VR. III-nitrides: Growth, characterization, and properties.
Journal of Applied Physics. 2000; 87:965-1006. http://dx.doi.
org/10.1063/1.371971
3. Egami T and Waseda Y. Atomic size effect on the formaility of metallic glasses. Journal of Non-Crystalline
Solids. 1984; 64:113-134.
http://dx.doi.org/10.1016/0022-3093(84)90210-2
4. Sá Lisboa RD, Bolfarini C, Botta WJF and Kiminami CS. Topological instability as a criterion for design and selection of aluminum-based glass-former alloys. Applied Physics
Letters. 2005; 86:211904. http://dx.doi.org/10.1063/1.1931047
5. Kiminami CS, Sá Lisboa RD, Oliveira MF, Bolfarini C and Botta WJF. Topological Instability as a Criterion for Design and Selection of Easy Glass-Former Compositions in Cu-Zr Based Systems. Materials Transactions. 2007; 48:1739-1742. http://dx.doi.org/10.2320/matertrans.MJ200745
6. Oliveira MF, Pereira FS, Bolfarini C, Kiminami CS and Botta WJF. Topological instability, average electronegativity difference and glass forming ability of amorphous alloys.
Intermetallics. 2009; 17:183-185. http://dx.doi.org/10.1016/j.
intermet.2008.09.013
7. Aliaga LCR, Kiminami CS, De Oliveira MF, Bolfarini C and Botta WJF. Selection of good glass former compositions in Ni-Ti system using a combination of topological instability and thermodynamic criteria. Journal of Non-Crystalline
Solids. 2008; 354:1932-1935. http://dx.doi.org/10.1016/j.
jnoncrysol.2007.10.018
8. Fang SS, Zhou ZQ, Zhang JL, Yao M, Feng F and Northwood DO. Two mathematical models for the hydrogen storage properties of AB2 type alloys. Journal of Alloys and
Compounds.1999; 293-295:10-13. http://dx.doi.org/10.1016/
S0925-8388(99)00380-1
9. Fang SS, Xiao XS, Xia L, Li WH and Dong Y. Relationship between the widths of supercooled liquid regions and bond parameters of Mg-based bulk metallic glasses. Journal of
Non-Crystalline Solids. 2003; 321:120-125. http://dx.doi.
org/10.1016/S0022-3093(03)00155-8
10. Aliaga LCR, De Oliveira MF, Kiminami CS, Bolfarini C and Botta WJF. Selection of glass former compositions in the Ni-Nb-B alloy system. Intermetallis. Submitted to Publication. 11. Inoue A, Zhang T and Masumoto T. Glass-forming ability of alloys.
Journal of Non-Crystalline Solids. 1993; 156-158:473-480.
http://dx.doi.org/10.1016/0022-3093(93)90003-G


