ISSN 0104-6632 Printed in Brazil
Vol. 21, No. 04, pp. 621 - 628, October - December 2004
Brazilian Journal
of Chemical
Engineering
A
GRAPH-STRUCTURAL
METHOD
FOR
PREDICTION
OF
POLYMER
PROPERTIES
R. O. Corrêa
1,2*, A.S.Telles
1, and J. E. Ourique
31
Escola de Química, Universidade Federal do Rio de Janeiro, Caixa Postal 68542, CEP 21949-900, Rio de Janeiro, RJ, Brazil.
2Instituto Nacional de Metrologia, Normalização e Qualidade Industrial,
Coordenação-Geral de Articulação Internacional,
Phone (21) 2563-2824, Fax: (21) 2502-6542, Rua Santa Alexandrina 416, 5º andar, CEP 20261-232, Rio de Janeiro - RJ, Brazil
E-mail: [email protected]
3 Departamento de Engenharia Química, Universidade Federal Rio Grande
do Norte, Phone (84) 215- 3769, r. 33, Campus Universitário, Lagoa Nova, CEP 59072-970, Natal - RN, Brazil.
E-mail: [email protected]
(Received: May 5, 2003 ; Accepted: June 28, 2004)
Abstract - Group contribution methods have been widely used for the estimation and prediction of properties of a great variety of chemical compounds and mixtures of compounds. In this paper, the glass transition temperature of polymers is evaluated by a second-order group contribution method previously developed by Ourique and Silva Telles (1997). From a total of 1018 polymers in the data base, 923 are selected as the training set to which group and interacting group contributions are assigned. The remaining 95 polymers are used as the validation set. Results are compared to the ones obtained by application method of Van Krevelen method's to the same data base.
Keywords: Glass transition temperature, graph-structural method, property estimation.
INTRODUCTION
Prediction of the physical and chemical properties of pure substances and mixtures is a modern problem that frequently arises in the chemical process industries. These properties are essential for modeling, simulating and controlling chemical plants, as well as for designing new chemical specialties. Many researchers are involved in the development of methods for predicting properties of organic, inorganic and biochemical compounds. Most of them are first-order group contribution methods (Joback and Reid, 1987; Reid et al.; 1987), although some second-order group contribution methods have also been considered (Gani et al., 1991).
In the polymer industry is also required reliable and robust methods for estimating the development of properties of polymers. The early work in this area can be credited to Van Krevelen(1990), who extended the group contribution approach to prediction of polymer properties.
SELECTION OF FUNCTIONAL GROUPS FOR DESCRIPTION OF STRUCTURE
The main task in any group contribution strategy is the choice of the representation set from which all molecular structures will be generated. The selection of these groups must take into account three basic assumptions. First, the molecular structure of any desired substance should be assembled by combining the functional groups contained in the presentation set. Second, there must be a quantitative value associated with the prediction of every property for each functional group in the representation set. Third, the representation set as well as its property values must remain constant while compounds are assembled.
According to these assumptions, the total value of a property can be accurately calculated by adding all group contributions, provided these contributions can be precisely assigned (first-order group contribution
methods). The contribution of a group to a given property, however, varies within different classes of compounds reducing the accuracy of group contribution techniques. The inclusion of more assembling units which can be considered a set of single units and their group contribution the sum of these single units can be seen as an attempt to overcome these limitations.
Table 1 shows the functional groups that are used in this work for estimating glass transition temperature (Tg) for polymers, which are very similar to the ones adopted by Joback and Reid (1987). Functional groups are labeled as primary, secondary, tertiary and quaternary according to the number of attachments they can establish with other groups. Groups with one or more double bonds are labeled as unsaturated groups used for building cyclic structures are labeled as ring groups and groups that constitute aromatic structures are labeled as aromatic groups.
Table 1: Functional groups used for estimation of the glass transition temperature for polymers.
Primary groups -CH3-, -F, -Cl, -Br, -OH, -COOH, -CN, -NO2
Secondary groups -CH2-, -O-, -eO- (esther), -CO-, -CS-, -S-, -COO-, -NH-
Tertiary groups >CH-, >N-
Quaternary groups >C<, >Si< Ring, aromatic and
unsaturated groups
-CH=,=C<,>aC=, -aC=, -cCH2-, >cCH-,>cC<
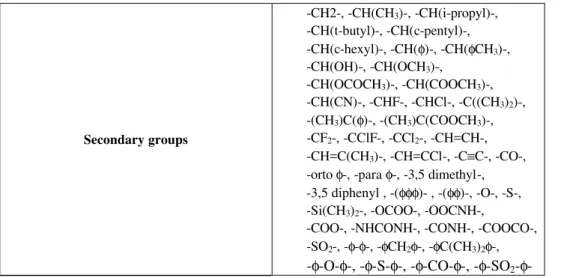
Table 2: Functional groups used for estimation of the glass transition temperature in Van Krevelen's method - all them secondary groups.
-CH2-, -CH(CH3)-, -CH(i-propyl)-,
-CH(t-butyl)-, -CH(c-pentyl)-,
-CH(c-hexyl)-, -CH(φ)-, -CH(φCH3)-,
-CH(OH)-, -CH(OCH3)-,
-CH(OCOCH3)-, -CH(COOCH3)-,
-CH(CN)-, -CHF-, -CHCl-, -C((CH3)2)-,
-(CH3)C(φ)-, -(CH3)C(COOCH3)-,
-CF2-, -CClF-, -CCl2-, -CH=CH-,
-CH=C(CH3)-, -CH=CCl-, -C≡C-, -CO-,
-orto φ-, -para φ-, -3,5 dimethyl-, -3,5 diphenyl , -(φφφ)- , -(φφ)-, -O-, -S-,
-Si(CH3)2-, -OCOO-, -OOCNH-,
-COO-, -NHCONH-, -CONH-, -COOCO-, -SO2-, -φ-φ-, -φCH2φ-, -φC(CH3)2φ-, Secondary groups
-where
c - group in cyclic chain
φ - benzene ring
- (ortho, meta, para) φ - benzene ring substituted in these positions
φφ - naphtalene ring
φφφ - antracene ring
Examples of Functional Group Assignment for Some Polymers
In order to illustrate how functional groups are assigned, we provide two examples of these assignments for some polymers.
Example 1,
Polyethylene terephtalate:
n
OOC- -COO-CH 2-CH2
§ Group assignment: 2 -CH2-; 2 -COO-; 4 -aCH=; 2 >aC= .
Example 2,
Polyethylene propionate:
CH2CH3 OC=O n CH2-CH
§ Group assignment: -CH3; 2 -CH2-; -eO-; -CO-; >CH- .
METHODOLOGY
Van Krevelen (1990) proposed that polymer properties be calculated by the purely group additive relationship,
∑
= = Nc1 i
i iF
n
F , (1)
where Fi defines the identity and contribution of a functional group i and ni corresponds to its frequency in the molecule.
Values for the groups presented in Table 2 are available in Van Krevelen (1990), and for estimation of Tg calculated as stated in equation 1.
In this work, polymer properties are estimated by a second-order group contribution method, according to the following expression:
∑
∑
= =
+ = c Sc
1 j
j j N
1 i
i
iF mG
n
F , (2)
in which F is the property to be estimated Nc denotes the total number of functional groups in the polymer structure and Sc represents the number of pairs of these groups Fi corresponds to the contribution of group i to property F and Gj is the contribution of pair j to property F and ni and mj represent the frequencies of groups and pairs of groups, respectively.
Considering that a whole set of NP properties is to be calculated for a single molecule, this expression can be put into an equivalent matrix form:
F= ⋅X A, (3)
in which F is an NS x NP matrix with estimated values for NP properties of NS substances X is an NS x (Nc+Sc) matrix containing the number of occurrences for each group and for each pair in the desired molecules and A is an (Nc+Sc) x NP matrix with group and pair contributions for a whole set of NP properties.
Application of the proposed formulation requires that matrix A be known. Also, each molecular structure of each polymer must be depicted in terms of functional groups and pairs of groups, allowing matrix X in Eq. 3 to be assigned. In order to specify matrix A, one must choose a set of polymers whose molecular structures contain all functional groups and pairs of groups used for further molecular representation. On the other hand, the number of times a group or a pair appears in this data set will determine the reliability of its contribution for every estimated property. For all these reasons, the choice of a well-balanced data set is essential for the success of the proposed method.
is then used to determine group and pair contributions to each one of these properties, as described below.
From Eq. 3, one can see that matrix A, which contains values for group and pair contributions, is the unknown. Matrix X contains frequencies for groups and pairs of groups in each polymer structure. Since matrix A is not-square, solution of Eq. 3 for A can be obtained with
*
A=X F, (4)
in which X* is the Moore-Penrose pseudo-inverse matrix, defined as the matrix that minimizes the quadratic deviation,
( ) (
2) (
)
R X = X A⋅ − ⋅F X A F⋅ − (5)
which is equivalent to
2 T T
R(X) =A AX X 2A F X F F⋅ − ⋅ + ⋅ (6)
The minimum value is obtained by
2
T T
R(X)
0 2A AX 2A F
X
∂
= = −
∂ (7)
from which X is determined as follows:
(
T)
1 TX= A ⋅A − A F, (8)
with
(
T)
1 T *A .A − A =A (9)
RESULTS
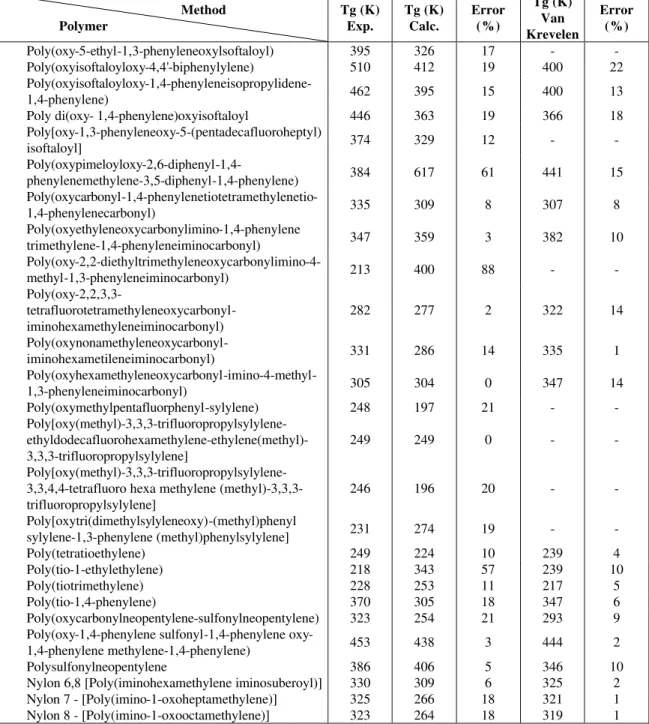
Group and pair contributions obtained by application of the procedure described in the previous section for the set of 923 polymers listed in Brandup and Immergut (1989) are employed for estimation of the glass transition temperature (Tg) of another 95 polymers. Table 3 contains the results for this verification set.
Table 3: Glass transition temperature for 95 polymers. Values estimated by the proposed method, experimental values and Van Krevelen's method.
Method Polymer
Tg (K) Exp.
Tg (K)
Calc. Error (%)
Tg (K) Van Krevelen
Error (%)
Poly-1 butyl 1 butenylene 192 209 9 202 5
Polydecyl ethylene 237 245 3 200 16
Polydodecylethylene 241 234 3 248 3
Polyheptylethylene 226 261 15 224 1
Poly(2-chlorophenyl acrylate) 326 341 5 - -
Poly(5-cyano-3-tiapentyl acrylate) 223 237 6 - -
Poly(ciclohexyl acrylate) 292 309 6 - -
Poly(hexadecyl acrylate) 308 184 40 295 4
Poly(hexyl acrylate) 216 237 10 225 4
Sindiotatic poly(isopropyl acrylate) 277.5 320 15 298 7
Isotatic poly(isopropyl acrylate) 262 286 9 298 14
Poly(4 metoxycarbonyl phenyl acrylate) 340 360 6 334 2
Poly(3-methyl butyl acrylate) 228 266 17 261 14
Poly(1,3-dimethyl butyl acrylate) 258 283 10 277 7
Poly(nonyl acrylate) 215 221 3 205 5
Poly(octyl acrylate) 208 227 9 211 1
Poly(2-octyl acrylate) 228 250 9 195 14
Poly(4-tiapentyl acrylate) 208 208 0 243 17
Poly(m-tolyl acrylate) 298 326 10 314 5
Poly(2-tert-butylamino ethyl metacrylate) 306 411 34 292 5
Isotatic poly(ethyl metacrylate) 285 281 1 338 19
Poly(1H,1H,7H-dodecafluoroheptyl metacrylate) 286 386 35 252 12
Poly(4-metoxycarbonyl phenyl metacrylate) 379 385 2 362 4
Poly(3,3-dimethyl butyl metacrylate) 318 289 9 270 15
Poly(cyclohexyl chlorocrylate) 387 369 5 - -
Continuation Table 3
Method Polymer
Tg (K) Exp.
Tg (K)
Calc. Error (%)
Tg (K) Van Krevelen
Error (%)
Poly(methyl chloroacrylate) 413 349 16 337 18
Poly(methyl fluoroacrylate) 404 430 6 324 20
Poly(methyl fluorometacrylate) 357 363 2 402 13
Poly(isopropoxyethylene) 270 298 10 262 3
Poly(benzoyloxyethylene) 344 342 1 346 1
Poly(3-bromo benzoyloxyethylene) 331 367 11 - -
Poly(4-methyl benzoyloxy)ethylene 343 349 2 342 0
Poly(4-benzoylstyrene) 371 418 13 419 13
Poly(4-butylrylstyrene) 347 322 7 332 4
Poly(4-carboxystyrene) 386 444 15 400 4
Poly(4-chloro-3-fluorostyrene) 395 338 14 385 3
Poly(3-ethylstyrene) 303 340 12 282 7
Poly(4-ethylstyrene) 325.5 338 4 342 5
Poly(2,5-difluorostyrene) 374 334 11 - -
Poly[4-(1-hydroxy-1-methylbutyl)styrene] 403 406 1 - -
Poly(2-isopropoxy carbonyl styrene) 419 386 8 - -
Poly(2-dimethyl aminocarbonyl styrene) 463 394 15 - -
Poly[4-(2-dimethyl aminoetoxycarbonyl) styrene] 373 352 6 - -
Poly(2,5-dimethyl styrene) 416 348 16 - -
Poly(3,5-dimethyl styrene) 377 376 0 - -
Poly(4-octyl styrene) 228 306 34 221 3
Poly(2-phenylamino carbonyl styrene) 464 459 1 - -
Poly(l-naphtyl ethylene) 432 264 39 - -
Poly(2-chloro-1,4-phenyleneethylene) 343 329 4 407 19
Poly(2-cyano-1,4-phenyleneethylene) 363 367 1 - -
Poly(1,4-phenylene-1-phenylethylene) 428 398 7 409 4
Poly(oxy-tert-butylethylene) 308 306 1 - -
Poly(oxy-2-hydroxy trimethyleneoxy-1,4-phenylene) 333 313 6 336 1
Poly(oxy-2-hydroxytrimethyleneoxy-1,4-phenylene-l-ethyl-1,4-cyclohexylene-1.4-phenylene) 413 399 3 - -
Poly(oxytetramethylene) 189 198 5 205 8
Poly(oxy- 1,1-dimethylethylene) 264 218 17 261 1
Poly(oxy-1,4-phenylene-2,2-dicyanotrimethylene-l,4-phenylene) 420 530 26 - -
Poly(oxy-1,4-phenylene hexafluoro-2,2-propylidene-1,4-phenylene oxy-hexafluoro-2,2-propylidene-1,4-phenylene carbonyl-l,4-phenylene]
448 535 19 - -
Poly(oxycarbonyloxy-2-chloro-1,4-phenylene
cyclohexylidene-3-chloro-1,4-phenylene) 447.5 471 5 400 11
Poly(oxycarbonyloxy-1,4-phenyleneethylidene-1,4-phenylene) 403 409 1 408 1
Poly(oxycarbonyloxy-1,4-phenylene-4,4-heptylidene-1.4-phenylene) 421 411 2 380 10
Poly(oxycarbonyloxy-1,4-phenylenemethylene-1,4-phenylene) 435 341 22 376 14
Poly(oxycarbonyloxy-1,4-phenylenecarbonyloxycarbonyl-1,4-phenylene) 318 388 22 352 11
Poly(oxyadipoyloxydecamethylene) 217 205 6 221 2
Poly(oxyadipoyloxy-2.6-dimethyl-1,4-phenylene
isopropylidene-3.5-dimethyl 1,4-phenylene) 366 401 9 386 5
Poly(oxyadipoyloxy-1,4-phenyleneisopropylidene-1,4-phenylene) 341 325 5 363 6
Poly[di(oxyethylene)oxy oxalyl] 265 212 20 249 6
Continuation Table 3
Method Polymer
Tg (K) Exp.
Tg (K) Calc.
Error (%)
Tg (K) Van Krevelen
Error (%)
Poly(oxy-5-ethyl-1,3-phenyleneoxylsoftaloyl) 395 326 17 - -
Poly(oxyisoftaloyloxy-4,4'-biphenylylene) 510 412 19 400 22
Poly(oxyisoftaloyloxy-1,4-phenyleneisopropylidene-1,4-phenylene) 462 395 15 400 13
Poly di(oxy- 1,4-phenylene)oxyisoftaloyl 446 363 19 366 18
Poly[oxy-1,3-phenyleneoxy-5-(pentadecafluoroheptyl)
isoftaloyl] 374 329 12 - -
Poly(oxypimeloyloxy-2,6-diphenyl-1,4-phenylenemethylene-3,5-diphenyl-1,4-phenylene) 384 617 61 441 15
Poly(oxycarbonyl-1,4-phenylenetiotetramethylenetio-1,4-phenylenecarbonyl) 335 309 8 307 8
Poly(oxyethyleneoxycarbonylimino-1,4-phenylene
trimethylene-1,4-phenyleneiminocarbonyl) 347 359 3 382 10
Poly(oxy-2,2-diethyltrimethyleneoxycarbonylimino-4-methyl-1,3-phenyleneiminocarbonyl) 213 400 88 - -
Poly(oxy-2,2,3,3- tetrafluorotetramethyleneoxycarbonyl-iminohexamethyleneiminocarbonyl)
282 277 2 322 14
Poly(oxynonamethyleneoxycarbonyl-iminohexametileneiminocarbonyl) 331 286 14 335 1
Poly(oxyhexamethyleneoxycarbonyl-imino-4-methyl-1,3-phenyleneiminocarbonyl) 305 304 0 347 14
Poly(oxymethylpentafluorphenyl-sylylene) 248 197 21 - -
Poly[oxy(methyl)-3,3,3-trifluoropropylsylylene- ethyldodecafluorohexamethylene-ethylene(methyl)-3,3,3-trifluoropropylsylylene]
249 249 0 - -
Poly[oxytrifluoropropylsylylene-3,3,4,4-tetrafluoro hexa methylene (methyl)-3,3,3-trifluoropropylsylylene]
246 196 20 - -
Poly[oxytri(dimethylsylyleneoxy)-(methyl)phenyl
sylylene-1,3-phenylene (methyl)phenylsylylene] 231 274 19 - -
Poly(tetratioethylene) 249 224 10 239 4
Poly(tio-1-ethylethylene) 218 343 57 239 10
Poly(tiotrimethylene) 228 253 11 217 5
Poly(tio-1,4-phenylene) 370 305 18 347 6
Poly(oxycarbonylneopentylene-sulfonylneopentylene) 323 254 21 293 9
Poly(1,4-phenylene sulfonyl-1,4-phenylene
oxy-1,4-phenylene methylene-oxy-1,4-phenylene) 453 438 3 444 2
Polysulfonylneopentylene 386 406 5 346 10
Nylon 6,8 [Poly(iminohexamethylene iminosuberoyl)] 330 309 6 325 2
Nylon 7 - [Poly(imino-1-oxoheptamethylene)] 325 266 18 321 1
Nylon 8 - [Poly(imino-1-oxooctamethylene)] 323 264 18 319 1
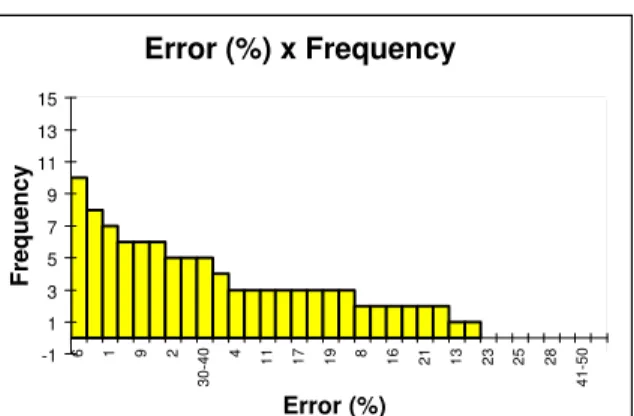
Figure 1 shows the distribution of percentage of error between experimental values and calculated values. Figure 2 shows the distribution of percentage of error between Van Krevelen estimations for Tg and the experimental values.
Figures 3 and 4 show percentage of errors by range of values for the proposed method and for of Van Krevelen's method.
The best results are obtained for the set of polyvinyl esthers (mean error of 5%). The worst
Error (%) x Frequency
-1 1 3 5 7 9 11 13 15
6 1 9 2
30-40
4
11 17 19 8 16 21 13 23 25 28
41-50
Error (%)
Frequency
Figure 1: Distribution of percentage of error between experimental values and calculated values
Error (%) x Frequency Van Krevelen's method
-1 1 3 5 7 9 11 13 15
6 5 1 3 9 10 2 15
30-40
0 4 7 11 12 17 18 19
>50
8
14 16 20 21 22 13 26 23 24 25 27 28 29
41-50
NA
Error (%)
Frequency
Figure 2: Distribution of percentage of error between Van Krevelen estimations for Tg and the experimental values
Range of Calculated Errors (%)
0-5 43% 11-15
15%
6-10 22%
21-25 8% 16-20
12%
Figure 3: Percentage of errors by range of values for the proposed method
Range of Calculated Error (%) Van Krevelen's Method
0-5 42%
11-15 10%
6-10 16% Not
Calculated 28%
16-20 5%
CONCLUSIONS
The proposed method (second order method) for estimation of the glass transition temperature of polymers is shown to be generic, simple and numerically reliable. Results are quite satisfactory, specially when compared to the ones obtained by Van Krevelen's method. Despite the fact that for some polymers calculated values of Tg are very poor, it should be observed that the number of groups and pairs used for molecular description is relatively small compared to that of Van Krevelen. Also, the equation for estimation of Tg is linear in the parameters (groups and pair contributions) and has no correction terms. This is a desirable feature for application in reverse problems.
Better results could be obtained if functional groups of greater complexity were adopted for molecular description. However, the number of groups and pairs would also have to be larger.
Finally, we state that the proposed method compares very favorably to Van Krevelen's method, since it provides better results, uses fewer functional groups and has a simple calculation procedure with no correction terms.
REFERENCES
Brandup, J. and Immergut, E. H., Polymer Handbook. 3rd ed. Wiley (1989).
Gani, R., Nielsen, B. and Fredenslund, Aa., A Group Contribution Approach to Computer-Aided Molecular Design, AIChE J., vol. 37, pp. 1318-1332 (1991).
Joback, K.G. and Reid, R.C., Estimation of Pure-Component Properties from group Contributions, Chemical Eng. Comm., vol. 57, pp. 233-243 (1987).
Ourique, J.E. and Silva Telles, A., Computer Aided Molecular Design with simulated annealing and molecular graphs, Computers and Chemical Engineering, vol.22, Suppl. pp. S615-S618 (1998).
Reid, R.C., Prausnitz, J.M. and Poling, B.E., The Properties of Gases and Liquids, 4th. ed., McGraw-Hill, New York (1987).