Abs tract
Nonlinear vibration response of nanomechanical cantilever (NMC) active probes in atomic force microscope (AFM) appli-cation has been studied in the amplitude mode. Piezoelectric layer is placed piecewise and as an actuator on NMC. Contin-uous beam model has been chosen for analysis with regard to the geometric discontinuities of piezoelectric layer attachment and NMC’s cross section. The force between the tip and the sample surface is modeled using Leonard-Jones potential. As-suming that cantilever is inclined to the sample surface, the effect of nonlinear force on NMC is considered as a shearing force and the concentrated bending moment is regarded at the end. Nonlinear frequency response of NMC is obtained close to the sample surface using the dynamic modeling. It is then become clear that the distance and angle of NMC, the probe length, and the geometric dimensions of piezoelectric layer can affect frequency response bending of the curve.
Key words
Nonlinear vibration; Nanomechanical cantilever; Multiple time scale; Nonlinear frequency response
.
Nonlinear mathematical modeling of vibrating motion
of nanomechanical cantilever active probe
1 INTRODUCTION
Nowadays, Atomic Force Microscope (AFM) has become a useful tool for direct measurements of intermolecular forces with atomic precision. This microscope can be used in various fields such as semiconductors, manufacturing, polymeric materials, bio-analysis, biomaterials, and in the studying of metal surfaces (Jalili and Laxminarayana, 2004). AFM robot is a powerful tool for nano-level evaluation, biomaterials diagnosis, nano description of materials and equipment, and assembly at nano-scale (Schaefer et al., 1995; Junno et al., 1995; Sitti and Hashimoto, 2000).
Atomic Force Microscope has a cantilever with a probe of a very fine tip, by which the infor-mation from the sample and tip interaction can be obtained. Recently, a new generation of NMCs has been developed for AFM imaging (Lee et al., 1999; Rogers et al., 2004). These types of NMCs are equipped with a piezoelectric layer that can be used for actuation, sensing, and simultaneous actuation and sensing. The piezoactuator NMCs advantage compared with bulky piezotube
actua-Re za G ha de ri* an d A z in N ej at
Department of Mechanical Engineering, Faculty of Technical and Engineering, Shahrekord Branch, Islamic Azad University, Shahrekord, Iran
Received in 12 Feb 2013 In revised form 13 Jul 2013
Latin American Journal of Solids and Structures 11 (2014) 369 - 385
tors has made them as an appropriate choice for high-speed imaging of AFM (Rogers et al., 2004). Other advantages of this type of NMCs are compacting of AFM when the NMCs are used as a sen-sor, and the possibility of using multiple probes in parallel functions (Adams et al., 2003)
The accuracy of power estimation based on AFM measured information depends on the selected dynamic model for the cantilever. With its effect on the controlling system, dynamic system model directly affects the images resolution. Most of the mathematical models which have been used until the date are lumped-mass spring models (Sarid et al., 1997; Pishkenari et al., 2008), while it has been proved (Nayfeh et al., 1992) that nonlinear lumped mass models which approximate continu-ous dynamic systems with the nonlinear boundary conditions may encounter substantial errors. NMC vibrating analysis has been studied at the specific attachment of piezoelectric (throughout layer) with simple rectangular cantilever and considering the continuous beam model in non-contact mode(Wolf and Gottlieb, 2002; Fung and Huang, 2001).
This paper focuses on the nonlinear mathematical modeling of vibrating motion of NMC. Here, unlike earlier works in which NMC has been studied in contrast with sample surface (Wolf and Gottlieb, 2002; Fung and Huang, 2001)and with throughout piezoelectric layer and horizontal to the sample surface, piezoelectric layer has been piecewise, and it is supposed to be angled to the sample surface, and the effects of piezoelectric confining electrodes in modeling would not be ignored. To do so, NMC is modeled with the help of continuous beam theory of Euler Bernoulli and considering the existing discontinuities in the length to increase the accuracy. Inclined NMC has a piezoelectric layer confined between two electrodes. It is vibrated through actuating voltage and Lennard-Jones potential model is selected to describe the interaction between tip and sample. The governing equa-tion of moequa-tion is changed into the nonlinear and ordinary differential equaequa-tion using Galerkin ap-proximation and it is solved to extract frequency response using perturbation method. Finally, a discussion will be made on the results in different conditions.
2 DYNAMIC MODELING
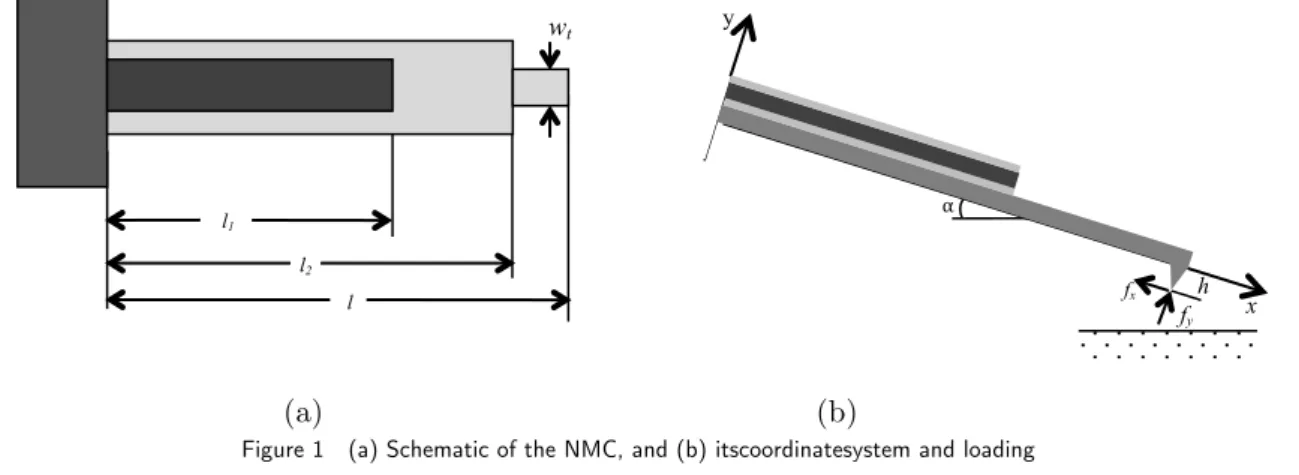
In order to modeling the NMC, a discontinuous beam, shown in Figure 1a, with a piezoelectric layer on its top surface is considered. There are two layers on top and beneath the piezoelectric layer act as electrode. The beam is inclined toward sample surface as shown in Figure 1b. It is clamped at one end; the other end is free and subjected to interaction force between tip and surface.
(a) (b)
Figure 1 (a) Schematic of the NMC, and (b) itscoordinatesystem and loading
l l2
l1
wt
fy fx h
x
y
Latin American Journal of Solids and Structures 11 (2014) 369 - 385
In addition, it is assumed that the motion of NMC is governed by Euler-Bernouli theory, there-fore shear deformation and rotary inertia terms are negligible. The Hamilton’s approach is adopted and used here in order to drive the equation of motion. The kinetic energy of NMC can be written as:
(
)
(
)
{
m s u v J s v v u vuv v v}
dsT=
∫
L + + ′ + ′ ′− ′ ′ ′− ′ ′0 2 2 2 2 2 2 2 2 2 ) ( ) ( 2 1 (1)
where u and v are longitudinal and bending deflections of NMC and also:
(
A A A A)
(
H HL)
A(
HL HL)
tAt(
HL HL)
sm = + + + − + − + −
2 2 1 1 1 1 0 4 4 3 3 2 2 1 1 )
( ρ ρ ρ ρ ρ ρ (2)
and H!! is Heaviside function.
)
( i
L H x L H
i = − (3)
The potential energy of NMC can be obtained by stress-strain relations. The linear constitutive equations of piezoelectric for the particular geometry are as follows (Salehi-Khojin et. al., 2008):
) ( 3 21 3 ) 3 ( 11 3 ) 3 (
11 Pt
h d E E − = ε σ (4)
in which, (3)
1 1
σ and (3)
11
ε are the longitudinal stress and strain along the long direction, d21is the
coeffi-cient of the converse piezoelectric layer and P(t) is the voltage for controlling the amplitude of
vi-bration. Note that numbering of layers is done from the lowest to the highest. The total potential energy of NMC can now be formulated as follows:
(
)
∫
∫ ∫∫
∫ ∫∫
∫ ∫∫
′ + ′ ′ + ′ + + + + + + = L L L A t t L L A L A ds v v u u s EA dAds dAds dAds U 0 4 4 1 2 2 2 ) ( 11 ) ( 11 2 1 ) 1 ( 11 ) 1 ( 11 1 0 ) 4 ( 11 ) 4 ( 11 ) 3 ( 11 ) 3 ( 11 ) 2 ( 11 ) 2 ( 11 ) 1 ( 11 ) 1 ( 11 ) )( ( 2 1 2 1 2 1 21 σ ε σ ε σ ε σ ε σ ε σ ε
(5)
in which, superscript (t) indicatestip. The force imposed by the surface of the sample to the tip can be expressed according to Lennard-Jones model (Wolf and Gottlieb, 2002) as follows:
[
]
[
]
82 2 1 ) ( )
( D v L
H L v D H F ts + − + = (6)
where H1 and H2 are Hamaker constants. D indicates the distance between the tip of probe and the
Latin American Journal of Solids and Structures 11 (2014) 369 - 385 ) ( ) ( )
( 3 3
2 2 1
0 fv x L fv x L fv x L f
Fts= + δ − + δ − + δ − (7)
in which: 8 2 2 1 0 D H D H
f = − (8-a)
9 2 3 1 1 8 2 D H D H
f =− + (8-b)
10 2 4 1 2 72 6 D H D H
f = − (8-c)
11 2 5 1 3 720 24 D H D H
f =− + (8-d)
and δ is dirac function. Using Eqs. 1-7, the Lagrangian of the NMC and virtual work can be written
as:
∫
+ = L ds U T L0( ) (9)
(10)
Since NMC neutral axis remains inextensible during vibration, the longitudinal and bending vi-brations are related to each other by non-elongation constraint
1 2 1 2 2 = ′ + ′ v u (11)
Using Hamilton’s principle, governing equation of motion can be obtained as:
(
)
[
]
{
[
]
}
[
]
[
( ) ( ) ( )]
0) ( ) ( ) ( ) ( 2 1 ) ( 4 1 ) ( 2 1 ) ( ) ( ) ) ( ( ) ( ) ( 3 3 2 2 1 3 3 2 2 1 0 2 0 2 = ′ − + − − − − − − − + − − + ″ ⎥ ⎦ ⎤ ⎢ ⎣ ⎡ − ″ ⎥ ⎦ ⎤ ⎢ ⎣ ⎡ ′ + ′ ⎥ ⎦ ⎤ ⎢ ⎣ ⎡ ′ ′ ′ − ′ ′ + ′ ′ ′ + ′ ′ ′′ ′ ′ + ″ ′′ +
∫
∫
L x v f L x v f L x v f h L x v f L x v f L x v f f t P c t P v c t P v c v ds dx v v v s m v v v s K v v s K v sm e e e
s L s δ δ δ δ δ δ (12) where: ) ( 12 ) ( 12 ) ( ) ( 12 ) ( 3 3 1 1 2 3 3 1 1 1 1 2 0 1 3 1 1
1 L L
t L
L L
L
L H H
h W E H H h W E H H EI H H h W E x
K = − + − + − + − (13)
) )( ( 1 2 3 2 1 2 1 1 31
3 n L L
e Ed W h h h y H H
C = + + − − (14)
δW= F
tsδv(L)−Ftshδ ′v(L)
(
)
dsLatin American Journal of Solids and Structures 11 (2014) 369 - 385
∑
∑
= = ⎪⎭ ⎪ ⎬ ⎫ ⎪⎩ ⎪ ⎨ ⎧ ⎥ ⎥ ⎦ ⎤ ⎢ ⎢ ⎣ ⎡ ⎟⎟ ⎠ ⎞ ⎜⎜ ⎝ ⎛ − − + = 4 1 2 1 2 2 12 k k j k j n k k k k h h y h h W E EI (15)∑
∑
∑
= = = − = 4 1 4 1 1 ) 2 ( i i i i i k j i j i i i n W h E h h W h E y (16)Regarding the lay-up of piezoelectric layer on NMC, the main body is usually made wider and its tip section is made narrower to improve the deformation measurement. On the other hand, pie-zoelectric layer is not necessarily extended to the end. Such discontinuities can affect the frequency response through the shape functions. Therefore, in order to achieve more accurate dynamic model for actuator piezoelectric NMC, section surface discontinuities should be considered in modeling. The length of NMC is divided into four uniform beams consisting of a multilayer beam with a pie-zoelectric layer and three plain beams with different cross sectional area in tip. In order to solve partial differential Eq. (1) and obtain the frequency response, the Galerkin’s approximation is used to discretize the solution into following separable form:
∑
∞ = = = 1 4 , 3 , 2 , 1 ) ( ) ( ) , ( n nn x q t n
t x
v ϕ (17)
where qn are the generalized time-dependent coordinates and φn(x) are nth mode shapes. Since total
length of NMC is divided into four uniform beams, mode shapes can be written as:
⎪ ⎩ ⎪ ⎨ ⎧ < < + + + = < < + + + = < < + + + = = L x L x Cosh D x Sinh C x Cos B x Sin A x L x L x Cosh D x Sinh C x Cos B x Sin A x L x x Cosh D x Sinh C x Cos B x Sin A x x n n n n n n n n n n n n n n n n n n n n n n n n n n n n 1 ) 3 ( ) 3 ( ) 3 ( ) 3 ( ) 3 ( ) 3 ( ) 3 ( ) 3 ( ) 3 ( 2 1 ) 2 ( ) 2 ( ) 2 ( ) 2 ( ) 2 ( ) 2 ( ) 2 ( ) 2 ( ) 2 ( 1 ) 1 ( ) 1 ( ) 1 ( ) 1 ( ) 1 ( ) 1 ( ) 1 ( ) 1 ( ) 1 ( ) ( ) ( 0 ) ( ) ( β β β β ϕ β β β β ϕ β β β β ϕ ϕ (18)
where ()4 2 () ()
/ r
r n r
n ω m EI
β = , and (r)
n
A , (r) n
B , (r) n
C and (r)
n D
are constants which can be obtained by the boundary conditions of NMC, the continuity conditions as well as normalization condition respect to mass as follow:
∫
Lm s n x dx=0 2 1 ) ( )
( ϕ (19)
The continuity conditions include deflection, slope of the deflection, bending moment and shear stress of NMC at the stepped points. Substituting Eqs.17 and 18 into Eq. 12, taking the inner
prod-uct of the resulting equation with mode shapes φn(x), integrating over the length of NMC and
con-sidering the orthogonality of mode shapes, the time dependent part of the equation of motion can be expressed as:
(
)
2 () 5 () 6 04 2 2 3 3 2 2
1 + + + + + + =
+ +
+ n n n n n n n n n n n n n n n n n
n q q q q q q q q q Pt P t
q µ ω γ γ γ γ γ γ
Latin American Journal of Solids and Structures 11 (2014) 369 - 385
where:
n
n ξω
µ =2 (21-a)
(
)
[
]
{
K x f Cos H s L fSin Cos H s L}
dsL n n n n n
∫
′ − − − − ″ ′′ =0ϕ ( )ϕ 1ϕ α ( ) 1 αϕ α ( )
ω (21-b)
[
Cos H s L]
ds Sin f L s H Cos f L n n nn
∫
⎭⎬⎫ ⎩ ⎨ ⎧ − ′ + − = 0 2 2 2 2
1 ϕ ϕ α ( ) αϕ α ( )
γ (21-c)
(
K s)
f Cos H s L fSin[
Cos H s L]
dsL n n n n n n n
∫
⎪⎭ ⎪ ⎬ ⎫ ⎪⎩ ⎪ ⎨ ⎧ ′ − + − + ′ ⎟ ⎠ ⎞ ⎜ ⎝ ⎛ ′ ′ ′′′ = 0 3 3 3 32 ϕ ϕ ( )ϕϕ ϕ α ( ) αϕ α ( )
γ (21-d)
( )
[
ms dsds]
dsL s L s n n n
n =
∫
′∫ ∫
′ ′0 0
2
3 ϕ ( )ϕ 2ϕ
γ (21-e)
(
C)
ds L n(
n(
Cp n)
)
dsL n p n n ″ ′ ′ − ″ ′′ =
∫
∫
0 0 2 4 2 1 4 1 ϕ ϕ ϕ ϕ ϕ γ (21-f) ds C L p n n5 =−∫
0ϕ ′′γ (21-g)
ds f
L n n6 =
∫
0ϕ 0γ (21-h)
3 FREQUENCY RESPONSE ANALYSIS
The frequency response analysis of NMC to primary resonance excitations is performed here to show the softening phenomenon in frequency response. For this reason, we choose the method of multiple scales (Jalili, 2010) which seeks a uniform second-order nonlinear approximate solution of
Eq. 20 near ωn in the form:
) ( ) , , ( ) , , ( ) , , ( ) ( 4 2 1 0 3 3 2 1 0 2 2 2 1 0
1 ε ε ε
εq T T T q T T T q T T T o t
qn = n + n + n + (22)
where Tn =εnt and ε is introduced as a small book keeping parameter to show infinitesimal quantity
in the equation. The time derivative becomes:
)
( 4
2 2 1
0 εD ε D oε
D dt d + + + = (23)
where Dn=∂/∂Tn . To obtain the frequency response, the cubic nonlinearities and linear damping
terms are scaled to become at the same order of perturbation problem as direct and nonlinear pa-rameter excitations. Therefore we let:
, 2
n n ε µ
µ = γ4n=εγ4n, 3 5 ,
5n ε γ n
Latin American Journal of Solids and Structures 11 (2014) 369 - 385
Substituting Eqs. 22-24 into Eq. 20 and separating similar powers of ε, yields:
0 )
( 2 1
1 2
0qn + nqn =
D
Oε ω (25-a)
0 2 ) ( 2 1 1 1 1 0 2 2 2 2 0 2 = + +
+ n n n n n
n q DDq q
q D
Oε ω γ (25-b)
(
)
[
]
( ) 0) ( 2 2 2 ) ( 0 5 2 1 0 1 2 1 2 0 1 3 3 1 2 0 2 1 4 2 1 1 1 2 1 2 1 0 1 2 0 1 0 3 2 3 2 0 3 = + + + + + + + + + + + T P q D q q D q q T P q q q q D q D D q D D q D q q D O n n n n n n n n n n n n n n n n n n n n n γ γ γ γ γ µ ω ε (25-c)
The solution of Eq. 25-a can be assumed as:
cc e T T A
qn n i T
n
+
= ( , ) 0
2 1 1
ω
(26)
where An is a complex amplitude and cc represents the complex conjugate of the preceding terms.
Substituting Eq. 26 into 25-a yields:
(
)
02 2 2 *
1 1 2 2 2 2 0 0 0 = + + − +
+ q i DAe Ae AA cc
q
D n n
T i n n T i n n n n n n n ω ω γ ω ω (27)
To get steady-state solutions, the secular terms of Eq. 27 which have coefficients ofeiωnt, must
be eliminated as a consequence D1An=0. An will be a function of T2 only. Considering this result,
the solution of Eq. 27 can be obtained as:
cc A A e A q n n n T i n n n n
n + +
− = 2 * 2 2 2 1 2 2 3 0 ω ω γ ω (28)
The harmonic excitation voltage is taken to be PT Pei T cc
+ =1/2 Ω0 )
( 0 , in which Ω denotes the
ex-citation frequency. It is assumed that exex-citation frequency remains near the natural frequency of vibration by the following relation:
n n ε σω
ω 2
+ =
Ω (29)
where σ is detuning parameter which indicates the farness of the excitation frequency to any of
natural frequencies. By substituting assumed excitation into Eq. 27 and eliminating the secular terms, the solution of Eq. 13 is given by:
(
)
02 2
8
2 2 2 2
4 5 * 4 * 2
2 + + − + =
+ −i T
n n n n n n T i n n f n n n n n n n A A P A e e P A A A D i A
i σω σω
γ γ γ γ ω ω µ (30) in which: 8 2 ) 3 / 10 ( 3 3 2 2 1
2 n n n
n f γ ω γ γ
Latin American Journal of Solids and Structures 11 (2014) 369 - 385
γf is a coefficient that indicates nonlinearity in system. When this coefficient is positive, softening
phenomenon appears in frequency response and when γf is negative, large amplitude motions would
occur at excitation frequencies greater than natural frequency. Since γf in Eq. 31 is positive, it can
be concluded that nonlinear interaction force between tip and sample always causes the softening
phenomenon in frequency response. It is better that An express in the polar form:
n n i n n i n
n T ae A T ae
A = β = −β
2 1 ) ( 2 1 )
( 2 2 (32)
Substituting Eq. 32 into Eq. 30 yields the following modulation equation of amplitude and fre-quency:
(
)
⎩ ⎨ ⎧ = + + = − + + − 0 sin 2 0 cos 2 1 2 1 5 2 4 5 3 2 n n n n n n n n n n n n f n n n n n P a a a a a a τ γ ω µ ω τ γ γ γ σω τ ω (33)in which τn=σT2-βn. In order to investigate the steady-state amplitude response, the coefficientsan
and
τ
nmust be set zero. By eliminating τn, the following nonlinear frequency-response equation canbe obtained:
(
)
(
)
25 2 2 4 5 2 3 5 2 2 1 2 2 1 P a a a a n n n n n n n f n n n n γ γ γ σ ω γ γ ω
µ ⎟⎟ =
⎠ ⎞ ⎜ ⎜ ⎝ ⎛ − − + (34)
4 NUMERICAL SIMULATION AND RESULTS
In order to study the obtained differential equation numerically, it is supposed that NMC is made of silicon and a piezoelectric layer, which is made of different materials, is regarded to be on it for the following analyses. Piezoelectric layer has been confined between the two electrodes made of
Ti/Au with the thickness of 0.25 μm. The required geometric information and mechanical properties
are provided in Table 1. The coefficients of Lennard-Jones are selected as σ=0.34(nm) and
H=10-18(J) (Wolf and Gottlieb, 2002).
Table 1 Specifications of simulated NMC
Material E
(Gpa)
ρ
(Kg/m3) h (μm)
W (μm)
L (μm)
22 β (Mm/F)
h12 (MV/m)
Base Layer Si 105 2330 4 250 375 - -
Lower Electrode Ti/Au 78 19300 0.25 130 330 - -
Piezoelectric Layer
Zno 104 6390 4 130 330 45.5 500
PZT-5H 60.6 7500 4 130 330 39.15 730
PZT-5A 61 7750 4 130 330 78.7 730
PZT-4 81.3 7500 4 130 330 102.4 920
Upper Electrode Ti/Au 78 19300 0.25 130 330 - -
Latin American Journal of Solids and Structures 11 (2014) 369 - 385
Natural frequency of discontinuous NMC can be calculated through boundary conditions equations, continuity of deformation, slope, bending moment, shearing force, and taking the coefficients deter-minant equal to zero. To make sure that the calculations made for obtaining the natural frequency are correct, we have used a Veeco DMASP cantilever. Practical results show that the first natural frequency of this NMC is equal to 50 (kHz). The theoretical calculations which were made with regard to the discontinuous beam method for NMC show that the first natural frequency is equal to 50.6(kHz) with only 1.2% error in proportion to the practical results.
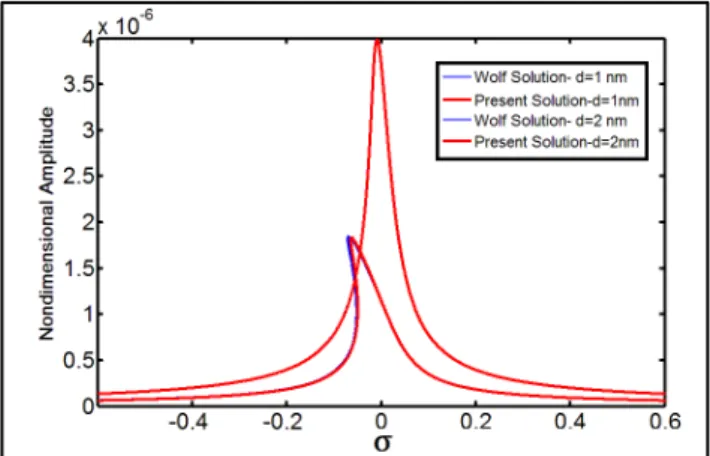
Wolf and Gottlieb (2002) examined actuator piezoelectric cantilever with throughout piezo layer and uniform cantilever near the sample surface. Taking into account the piezoelectric actuator mo-ment and the force between the tip and the sample at the boundary conditions of motion differen-tial equation, they offered another formulation for frequency response. To compare the solution made in this paper with that of Wolf and Gottlieb, we assume that the piezoelectric layer on NMC is made of PZT-5H, it has covered its entire surface and NMC is uniform. Figure 2 shows NMC
frequency response at the two equilibrium distances of (d) 1 and 2 nm. In these two conditions, the
input voltages to the piezoelectric layer are 0.018 and 0.04 mV respectively. Comparison of the re-sults shows a very good agreement between the two solving methods.
Figure 2 Comparing the frequency response of solved NMC vibrating amplitude and Wolf and Gottlieb solution
The force between the sample surface and the probe tip based on the Lennard-Jones model de-pends on the distance between them at the static equilibrium condition. By decreasing the distance, the nonlinear behavior will be increased. This nonlinear force, on one hand, leads to lowering the
resonant frequency of cantilever and on the other hand, by affectingγf nonlinear dimensionless
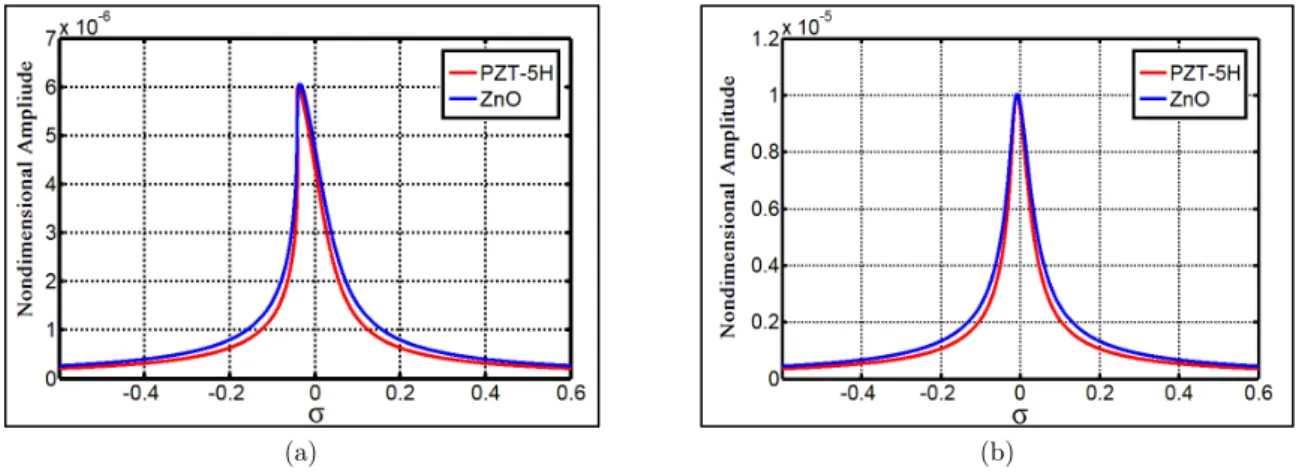
coef-ficient, it will lead to the bending of frequency response curve or the softening phenomenon. This represents the cantilever nonlinear vibrating behavior at the time it encounters this force. There-fore, with the decrease of equilibrium distance between the sample surface and the probe tip, soften-ing phenomenon will be increased. Increassoften-ing the amount of frequency response softensoften-ing at the time of decreasing equilibrium distance can be seen in Figure 2 and in both of the computational methods. With the presence of ZnO or PZT-5H piezoelectric layer, the effect of equilibrium distance
change and nonlinear force on discontinuous NMC can be seen in Figure 3. Since theγf coefficient is
Latin American Journal of Solids and Structures 11 (2014) 369 - 385
cantilever response with PZT-5H layer in small values of d is more than cantilever response with ZnO layer. This indicates that cantilever with PZT-5H layer is more sensitive to nonlinearity of the system.
(a) (b)
Figure 3 Frequency response of NMC vibrating amplitude, (a)d=3 nm (p=0.018(mV) for PZT-5H and 0.35(mV) for ZnO), (b)d=5 nm (p=0.03(mV) for PZT-5H and 0.58(mV) for ZnO)
Not only does the equilibrium distance affect the amount of created moment by contraction force, but also the probe height affects this moment. In fact, the larger this angle is, the more the moment will be. Therefore, to study the effect of probe height on the motion, the greatest possible angle should be selected for simulation. To do so, 60-degree angle is chosen. The distance between
the tip and the sample surface is 2 nm, and actuating voltage in ZnO option is chosen as 25 μV and
in PZT-5H as 11 μV. Figure 4 shows the probe height effect on the frequency response. As it is
Latin American Journal of Solids and Structures 11 (2014) 369 - 385
(a) (b)
Figure 4 Effect of probe length on frequency response, (a)ZnO,(b)PZT-5H
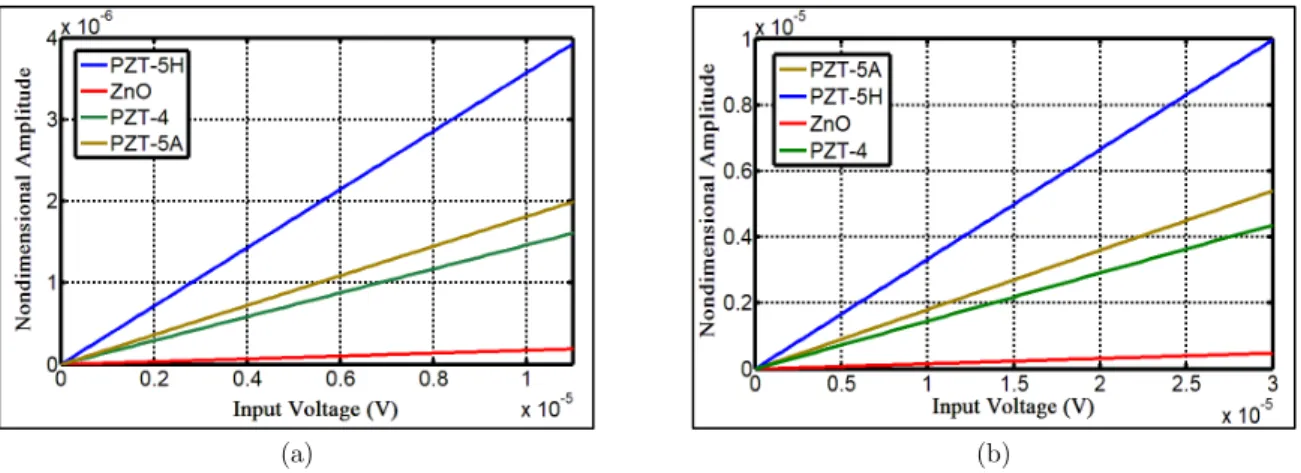
One of the effective factors on the vibrating motion is the actuating voltage. In fact, the more the piezoelectric layer is increased, the more the amplitude of vibration will be. This phenomenon will happen at any equilibrium distance of NMC and for any type of piezoelectric layer. The only difference that can exist in these situations will be the manner of the increase. Figure 5 shows the effect of voltage increase on the maximum amplitude in frequency response. The graphs of this Fig-ure have been drawn in the two equilibrium distance of two and five nanometers. As the graph related to PZT-5H is more slanting, it indicates that this substance is more capable to actuate the cantilever.
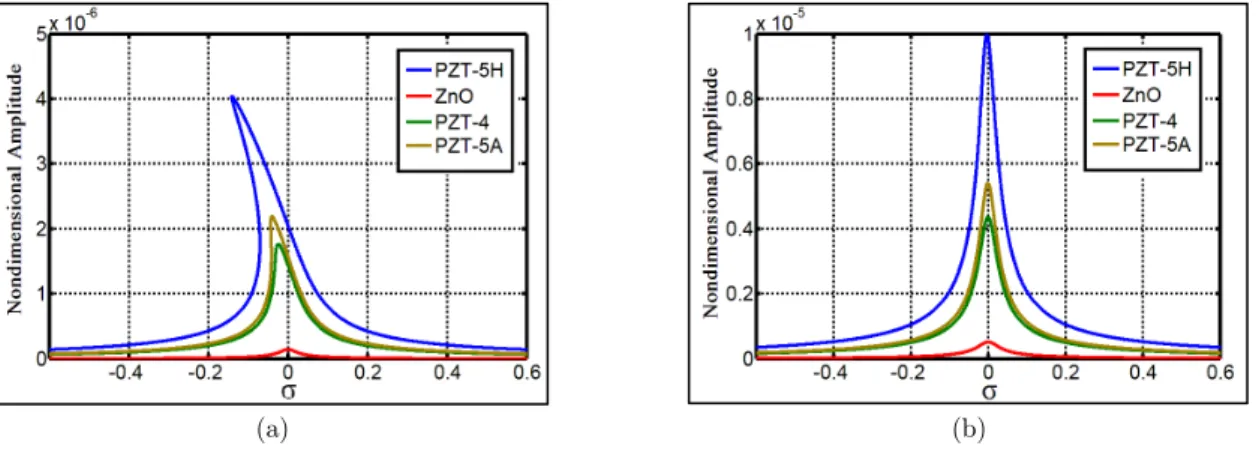
Considering the slope of lines, it can be concluded that after PZT-5H, PZT-5A, PZT-4 and ZnO are of high actuating capability. However, the effect of different piezoelectric materials on the ap-pearance of frequency response curve can be seen in Figure 6. Piezoelectric materials which are of high actuating capability, further demonstrate the curvature of the curve by increasing the ampli-tude.
(a) (b)
Latin American Journal of Solids and Structures 11 (2014) 369 - 385
(a) (b)
Figure 6 Frequency response of cantilever’s first resonance amplitude to different piezoelectric materials (a)d=2(nm),(b)d=5(nm)
Figure 7 shows that by increasing the voltage while the equilibrium distance is chosen low (2 nm), by increasing the amplitude, the frequency response curve curvature will be more obvious. This is when at longer distance (5 nm), the increase of voltage will show the increase of amplitude further. Therefore, in order to make the curvature of curve more clearly at shorter distances, it is necessary to use the maximum possible actuating voltage.
(a) (b)
(c) (d)
Latin American Journal of Solids and Structures 11 (2014) 369 - 385 4.1 Reviewing the effects of geometric dimensions of piezoelectric layer on frequency
re-sponse
The piezoelectric layer on NMC is the vibrating actuation agent. Changing geometric dimensions of this layer will on one hand change the spring constant and mass per unit length of NMC and on the other hand will change the amount of imposed moment from piezoelectric layer in equation of
mo-tion throughC(x)
e′′ coefficient. Simulation of the effects of these parameters will be discussed here to
make clear the effects of geometric dimension of piezoelectric layer on vibrating motion.
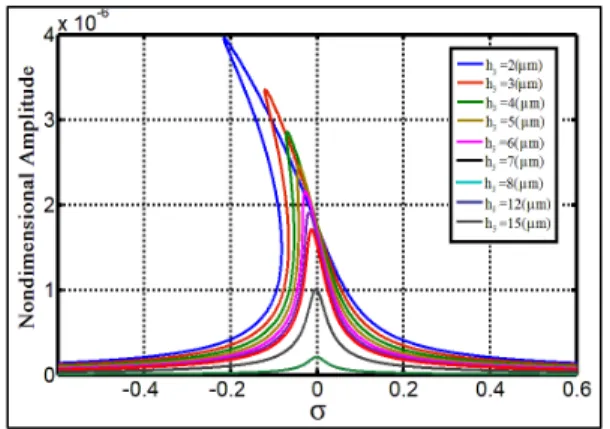
The increase of piezoelectric thickness with regard to Eq. 10 will lead to intensification of the imposed moment on the NMC. However, raising this parameter can lead to greater spring constant and mass per unit length of the beam and the consequent increase of resistance against actuation. Thus, by solving the equation of motion for different values of this parameter, one can specify its effect on the beam vibration. To simulate, two materials including ZnO and PZT-5H are selected from among the piezoelectric materials. They were selected because they are frequently used in making NMCs, and actuating characteristic of PZT-5H is significant. In this section, d=2(nm) and actuating voltages of ZnO and PZT-5H are 0.16 and 0.009 mV respectively.
In Figure 8, the way the NMC frequency response changes occur in terms of thickness has been given. It can be concluded that increasing amplitude of vibration and softening of frequency re-sponse are due to the decrease of thickness. Despite the fact that decreasing piezoelectric layer thickness causes reduction of actuation, results show that decreasing spring constant (or frequency) and mass per unit length play a more effective role in determining the amount of amplitude. De-creasing thickness along with the reduction of NMC frequency and inDe-creasing the amount of
dimen-sionless amounts of f1 and f2 in Eq. 18 will increase the γf nonlinearity coefficient, and will
conse-quently increase the softening of NMC frequency response.
Figure 8 Effect of piezoelectriclayerthicknessonfrequency response
Latin American Journal of Solids and Structures 11 (2014) 369 - 385
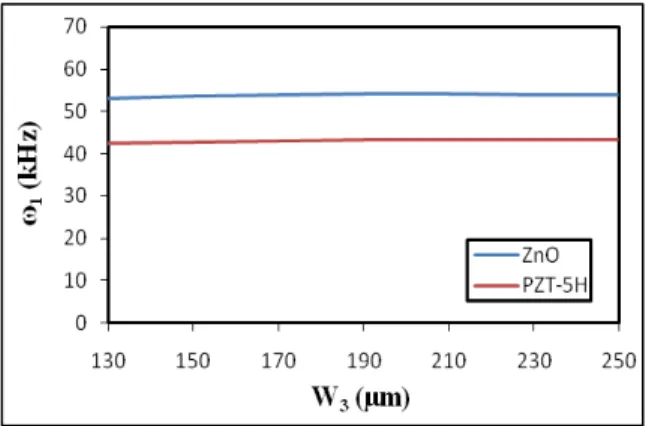
width of piezoelectric layer. As seen, width changes in both ZnO and PZT-5H do not have a signifi-cant effect on the natural frequency. Therefore, it can be concluded that the change of piezoelectric layer width may have little effect on the nonlinear vibrating motion quantities, i.e. the amplitude, natural frequency, and frequency response curve curvature.
(a) (b)
Figure 9 Effect of piezoelectriclayerwidthonfrequency response, (a)ZnO- P=0.21(mV),(b)PZT-5H-P=0.01(mV)
Figure 10 Changes of first natural frequency of cantileverbasedonthewidth of piezoelectriclayer
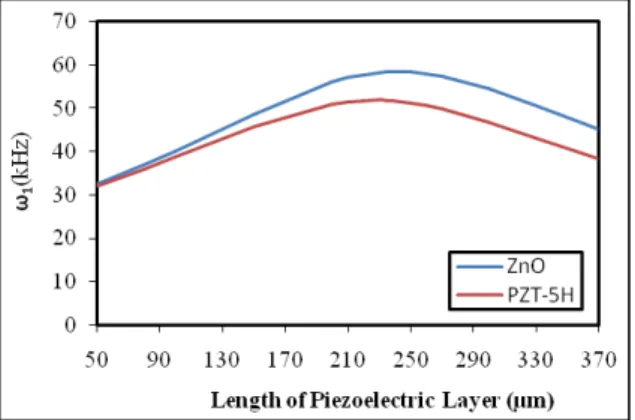
Yet another geometric parameter of piezoelectric layer, which can have an effect on motion frequen-cy response, is the length of the layer. Changing the length not only changes the place of imposing the moment on the cantilever, but also will increase the amount of the imposed moment on NMC by increasing the length of piezoelectric. However, the increase of piezoelectric layer leads to the increase of mass per length, spring constant and therefore its resistance against vibrations will be greater.
Latin American Journal of Solids and Structures 11 (2014) 369 - 385 Figure11 Changingthefirst natural frequency of cantilever in terms of thelength of piezoelectriclayer
Figure 12 shows that change of vibrating amplitude in the length changes of piezoelectric layer has a process similar to that of frequency; that is, for small amounts of length of piezoelectric layer and with the increase of this parameter, the amplitude will be greater. With the increase of the length near the maximum amounts of natural frequency, amplitude keeps decreasing. Meanwhile, the curve curvature decreases as well. As the Figure 12 shows, this process occurs at the amounts before the decrease of amplitude.
(a) (b)
Figure12 Effect of piezoelectriclayerlengthonfrequency response, (a)ZnO, (b)PZT-5H
5 CONCLUSION
Latin American Journal of Solids and Structures 11 (2014) 369 - 385
1) Vibrating motion near the sample surface will cause the softening phenomenon in the frequency response, and the more this motion happens around the closer equilibrium distances to the sample surface, nonlinearity of the system increases, and frequency response will suffer more curvature. 2) The increase of NMC steep in proportion to the sample surface decreases the amount of frequen-cy response curvature, and the reduction amount is more intense at the distances closer to the sam-ple surface. This issue is seen in the presence of both types of PZH-5H and ZnO actuators.
3) As the probe length is increased and the amount of force moment is intensified, softening phe-nomenon is reduced and this reduction is little with regard to smallness of probe length.
4) Comparing the actuation ability of selected piezoelectric materials show that PZT-5H is the best, and PZT-4A is the weakest actuator. The behavior of ZnO and PZT-5A are similar to each other. 5) The results of geometric dimension effect of piezoelectric layer on the selected NMC showed that the width of layer does not have a considerable effect on the frequency response. By increasing thickness, the bending of frequency response curve is diminished.
References
Adams, J.D., Parrott, G., Bauer, C., Sant, T., Manning, L., Jones, M., Rogers, B., McCorkle, D., Ferrel, T.L., (2003).Nanowatt chemical vapor detection with a self-sensing, piezoelectric microcantilever array, Applied Phys-ics Letter, 83: 3428-3430.
Fung, R.F., Huang, S.C., (2001). Dynamic modeling and vibration analysis of the atomic force microscope, ASME Journal of Vibration and Acoustics, 123: 502-509.
Jalili, N. ( 2010). Piezoelectric-based vibration control from macro to micro/nano scale systems, Springer, New York.
Jalili, N.,Laxminarayana, K., (2004). A review of atomic force microscopy imaging systems: application to molec-ular metrology and biological sciences, International Journal of Mechatronics, 14 (8): 907-945.
Junno, T., Deppert, K., Montelius, L., Samuelson, L., (1995). Controlled manipulation of nanoparticles with an atomic force microscope, Applied Physics Letter, 66: 3627-3629.
Lee, C., Itoh, T., Suga, T., (1999). Self-excited piezoelectric PZT microcantilevers for dynamic SFM-with inher-ent sensing and actuating capabilities, Sensors and Actuators A: Physical, 72: 179-188.
Nayfeh, A., Nayfeh, J.F., Mook, D.T., (1992). On methods for continuous systems with quadratic and cubic non-linearities, Nonlinear Dynamics, 3:145-162.
Nayfeh, A.H., Mook, D.T., (1979). Nonlinear oscillations, Wiley–Interscience, New York.
Pishkenari, H.N., Behzad, M., Meghdari, A., (2008).Nonlinear dynamic analysis of atomic force microscopy under deterministic and random excitation, Chaos, Solitons& Fractals, 37: 748-762.
Rogers, B., Manning, L., Sulchek, T., Adams, J.D., Improving tapping mode atomic force microscopy with piezo-electric cantilevers, Ultramicroscopy, 100: 267-276.
Salehi-Khojin A., Bashash S. Jalili N., (2008). Modeling and experimental vibration analysis of nanomechanical cantilever active probes, Journal of Micromechanic and Microengineering, 18: 085008 (11pp)
Latin American Journal of Solids and Structures 11 (2014) 369 - 385
Schaefer, D.M., Reifenberger, R.,Patil, A., Andres, R.P., (1995). Fabrication of two dimensional arrays of na-nometer-size clusters with the atomic force microscope, Applied Physics Letter, 66 (8):1012-1014.
Sitti, M., Hashimoto, H., (2000). Force controlled pushing of nanoparticles: modeling and experiments, IEEE/ASME Transcation on Mechatronics, 5: 199-211.