Insights on the Fractal-Fracture Behaviour Relationship
José de Anchieta Rodrigues, Victor Carlos Pandolfelli
Departamento de Engenharia de Materiais,
Universidade Federal de São Carlos,
Via Washington Luiz, km 235, 13.565-905 São Carlos - SP, Brazil;
e-mail: [email protected]
Received: March 5, 1998; Revised: August 15, 1998
The fractals theory has been increasingly applied in the field of materials science and engineer-ing. Models of fractal lines and surfaces have been generated to describe the microstructural features of materials. Special interest is placed upon a description of the fracture surface based on a fractal geometry in order to understand the crack path in materials. Several papers have demonstrated the relationship between the fractal dimension of a fracture surface and the values of roughness and fracture toughness. In this work an extension of the theory of fractals for ceramic materials is proposed, to which the crack deflection toughening mechanism is thought to be related. In order to accomplish this objective, a review describing the concept of fractals and its relationship with the fracture toughness is presented. In the following part, a correlation between fractal dimension, total energy of fracture and the average resistance to crack propagation is proposed; all these parameters being dependent on the history and on the complexity of crack propagation path.
Keywords:fractals, ceramics, fracture surface, total energy of fracture, R-curve
1. Introduction
The importance of overcoming problems related to the brittleness of ceramic materials has been constantly empha-sized in the technical literature. In the last two decades several toughening mechanisms have been designed, mak-ing the ceramics much more appropriate to certain practical applications, namely those which require thermal shock resistance. The most common toughening mechanisms in-clude microcracking branching, crack deflection and stress induced phase transformation.
Advances in understanding the fracture process has been possible through fractographic techniques. Equally important is to find out new characterization techniques to evaluate brittleness, which could provide information on its origin. As pointed out by Lin and Lai1, in 1977 Mandelbrot proposed a new characterization technique for fracture surfaces applying fractal theory concepts.
This new concept was extended by Hornbogen2, who published a review on the use of fractal structure to describe microstructural features of metals relating a large number of parameters, such as the distribution of phases, martensi-tic and dendrimartensi-tic configuration, dislocation arrays, slip bands, grain boundaries, and fracture surface roughness.
There are several works in the literature which investi-gate the relationship between fractal dimension of a frac-ture surface and experimental values of the corresponding fracture toughness, KIc, following suggestions of Mandel-brot, Passoja and Paullay3. The most frequent properties and features reported in these works are impact energy3, fracture toughness1,4-6, type of fracture along the crack propagation7 and roughness8.
Basic relationships found in the literature are shown in this paper. An extension of the fractal theory for ceramic materials which predominantly display geometric toughen-ing mechanisms (crack deflection) is proposed, based on relationships between fractal dimension and total energy of fracture, as well as on the average value of the crack propagation resistance.
2. Concepts of Fractals
fea-tures of an object are independent of the magnification or observation scale.
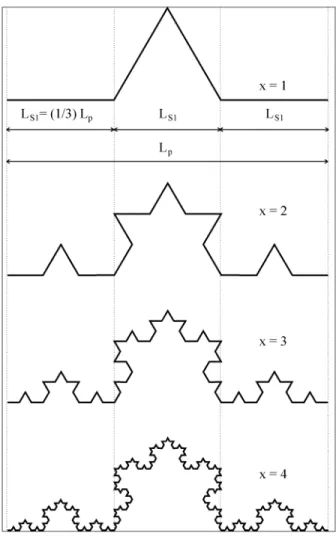
An artificial manner to generate a fractal line comprises application of a known criterion, such that of the Koch’s line2,9. It is useful to simulate a progressive tortuosity in a straight line as a mean to model a crack propagation path in a brittle material6.
The structure of Koch’s line is based on a figure consti-tuted of four straight segments of same length (Ls1 = (1/3) Lp). This figure defines an object whose pro-jected length equals Lp, as shown at the top of Fig. 1. The first object that is formed is not flat. Instead, it exhibits a low degree of tortuosity described by its hilly profile. In a recurrent manner it is possible to increase the tortuosity on the original line by adding new smaller straight segments, repeating the same picture, but progressively in a smaller scale.
Let us establish a reduction index n = 1/3 and designate x as the number of applied reductions (iterations). The
bottom part of Fig. 1 shows the aspect of Koch’s line after four iterations (x = 4).
An important consequence of the geometry of a fractal line is that its true length depends on the size of the measuring ruler. It is possible to demonstrate that, after each iteration, the total true length of the line increases in accordance with the following relation
L x+1 = L x N n (1)
where x is the number of iterations, N is the number of elements in the basic picture (x = 1) and n is the applied reduction. Thus, the true length of a fractal line after x iterations is given by:
L x = L p ε(d−D)
x (2)
where εx = nx represents the fractional measuring unit, which, for practical purposes, will be associated either to the magnification and resolution used in the microscope2 or to the relative length of a typical constructional segment of that line5,6. The parameter d represents the Euclidean dimension of the object (d is equal to 1 for a line or equal to 2 for a surface) and D is denominated fractal dimension.
Lines totally contained in a plane display D-values between 1 and 2. The higher the D-value the greater will be the tortuosity of the line.
The parameter εx has two important meanings. Firstly, it can represent the size of the measuring ruler. However it is known that for real objects; a fracture surface, for in-stance; its fractal features are limited between minimum and maximum bounds. For brittle materials, it is assumed that the minimum εx-value is associated to the atomic spacing and the grain size to the maximum one6. Secondly, εx can be represented by a segment or an area, which are typical features of a fracture surface. This later assumption leads to equations relating properties and fractal dimension, as shown in the following sections.
The following equation, which expresses the general definition of fractal dimension, can be used to work out the dimension of an artificial fractal object,
D =log log (N)
(1⁄n) (3)
Applying this equation to Koch’s line, assuming N = 4 and n = 1/3, the D-value will be equal to 1.2618.
The same approach can be used to treat a surface. Starting at an Euclidean dimension equal to 2, fractal dimensions greater than this value will represent rough surfaces, similar to the fracture surface of polycrystalline ceramics. As a reference, either the cleavage of a single crystal or the fracture of a glass can generate a plain fracture surface with D = 2.0, when observed in a microscopic scale. In fact, cleavage steps will be found in a nanoscale.
3. Determination of Fractal Dimension of
Fracture Surfaces
One of the most commonly employed techniques for determination of fractal dimension of a fracture surface was introduced by Mandelbrot et al.3. In this method, named the
‘‘slit island method’’, the fractured specimens are firstly mounted in resin. The following step consists of careful polishing of the surface parallel to the fracture surface in order to highlight the ceramic ‘‘islands’’. The island struc-ture has a correlation with the relief of the fracstruc-ture surface topography. A schematic view of this procedure is shown in Fig. 2. For each polishing depth the enclosed areas of the islands are measured and plotted against the corresponding perimeter of the contour of the islands.
It is shown in the literature that the log-log plot of the measured area versus its corresponding perimeter, genera-tes a straight line whose slope is related to the fractal dimension of the fracture surface. Therefore, it is possible to find out the correlation between the independently meas-ured KIc parameter and the fractal dimension obtained by the slit island method.
Furthermore, it is possible to obtain D from Eq. 2 through measurements of sectional profiles of the crack surface, as illustrated in Fig. 3, after cutting the sample perpendicularly to the fracture surface or using an image analysis technique which is able to digitally track the profile. However one must be aware that slit island method and perpendicular profile analysis might generate different values for D.
As an example10, a simulated profile represented by a Koch’s line with Lp = 0.30 m and x = 4 was used. The true length of the line, L, was measured using rulers of different sizes, equal to Lp and to fractional values of this. The result is shown in a plot of relative length, L/Lp, vs. the measuring
unit, εx, in Fig. 4. In a log-log plot, a linear relation is obtained and the value of D is equal to 1.24 presenting a good agreement with the theoretical value for Koch’s line.
Also in Fig. 4, the line reveals some peaks that are related to the length of characteristic segments of Koch’s line. This suggests that the method is able to indicate the charac-teristic lengths of a fracture surface which, in turn, can be related with microstructural features6.
4. Fracture Aspects
4.1. General concepts
Important basic relationships that describe the role of fractal theory for fracture can be found in works reported by Lin and Lai1, Mu and Lung5, Tanaka6, Xin et al.8, Nagahama11 and Lung12.
For a fracture surface such as those observed in single crystals or in glass (which could be microscopically flat but not in a nanoscale), the driving force for crack extension can be represented by the intrinsic elastic energy release rate, GIco, and can be written as
G Ico = 2 γo = K
2 Ico
E’ (4)
where γo is the surface energy per unit area, expressing only the thermodynamic surface energy (in practice, the energy necessary to break chemical bonds). KIco is the plaine strain intrinsic fracture toughness for mode I of stressing and E’ is defined as E/(1 - ν2), where E is the Young’s modulus and ν is the Poisson’s ratio of the material.
Nevertheless, at room temperature, even a ceramic ma-terial exhibits some microplasticity in the crack tip, which causes stress release. This contribution for the fracture energy is symbolized by γp. In this paper, it is assumed that
Figure 2. Schematic view of the procedure employed to reveal the ‘‘slit island structure’’. t1, t2 and t3 represent the evolution of the slit islands for increasing polishing times.
Figure 4. Relative true length versus the measurement unit for a Koch’s line with x = 4 and Lp = 0,30 m (ad. = non-dimensional)10.
γp is independent on the direction of crack propagation and can be defined per unit of fracture area. Therefore, effec-tively the crack propagation initiates when
G Ic = 2 γeff. = K
2 Ic
E’ (5)
where GIc is the effective elastic energy release rate, KIc is the fracture toughness (effective critical stress intensity factor) and γeff. = γo + γp. Usually, KIc and, in turn, γeff. are experimentally measured through fracture testes under catastrophic crack propagation condition.
Back to Fig. 3 the resulting tortuous line (profile) on the fracture surface corresponds to crack path along the cut plane. Therefore, the more tortuous is the line (i.e. rougher
fracture surface) the longer will be its true length, regarding to its constant projection Lp.
Recent papers do not present details on how to incorpo-rate the effect of true area increase on γeff., since they do not consider the concept of fractal structure. Davidge and Evans13 mentioned in their publication that the surface energy criteria for crack propagation must consider a num-ber of effects, namely, plastic flow, the work needed to generate cleavage steps, the energy consumed in creating subsidiary cracks, and, obviously, the γo itself. The referred researchers pointed out that γo should be multiplied by a geometrical factor to account for the roughness of the fracture face, but no further efforts were done to express it in a quantitative way.
The description of the true path of a crack profile is obtained when d = 1 is applied to Eq. 2. The same increas-ing factor in the true length of the crack path is also verified in the true area of the fracture surface. Let γo be constant and equal to the average of different crystallographic planes in a certain crystal (as reference, it could also be thought in the fracture of a glass). For a larger true fracture area more energy for fracture will be consumed. Neverthe-less, the area that is included in the practical calculation of the surface energy is the projected one. The consequence is that the resulting surface energy will be higher than γeff. defined in conditions of Eq. 5. The surface energy calcu-lated in this manner continues to be named ‘‘effective surface energy’’, but it includes a term related to the area increment due to tortuosity (or roughness).
Considering a situation where a ceramic material has only the contributions of γo, γp, and those due to the fractal nature as an additional microstructural mechanism, as shown bellow:
G Ic = 2 γeff. ≈ 2 (γo +γp) ε(1x −D) ≈ K2
Ic
E’ (6)
the greater the fractal dimension of the crack path profile (or of the fracture surface) the larger will be the KIc-value.
Equation 6 is a comprehensive representation of some ideas reported in the literature. Some authors use the equal-ity sign to relate terms in the equation whereas some others use the proportionality sign (≈). In the opinion of the authors, the proportionality sign is more adequate, since the same increment factor of fracture area does not necessarily correspond to an increase of K2Ic and, consequently, of γeff.. The total increment of fracture area is associated with the total process of fracture, but KIc is a property related only with the beginning of crack propagation under catastrophic condition. Another important point is that, rigorously speaking, Eq. 5 is somewhat imprecise when applied to rough fracture14.
In the simplest situation, roughness of fracture surface can have its origin during intergranular fracture. The latter consists of an intrinsic crack deflection mechanism that imposes a greater stress intensity factor for crack propaga-tion initiapropaga-tion.
Still, in Eq. 6 it must be observed that the relationship between the two last terms is frequently verified in experi-ments with several different materials. Usually the plot of log(KIc) vs. D can be represented by a straight line5,6,8,11,15,
confirming Eq. 6.
Based on Griffith-Orowan-Irwin relation (GIc = (K2Ic / E’) = 2 γeff.), which is valid for flat fracture surfaces, Nagahama11 showed that the dependence of K
Ic on D can be predicted from the degree of brittleness of the tested material. Therefore, it has been found11 that K
Ic decreases with the increase of D for ductile materials, whereas for brittle materials KIc scales with D. Equation 6 establishes a new insight11 in which fracture occurs when the elastic energy release rate is greater than the effective energy of fracture corrected by the fractal effect.
4.2. The roughness of the fracture surface
Taking into account a flat fracture surface, such as a single crystal cleavage, it is correct to assume γeff. = γo + γp, where γp is related to the contribution of possible micro-plasticity that can occur in the frontal zone of a crack in a ceramic material. Considering a brittle polycrystalline ce-ramic, for which γp = 0, the term γeff. in Eq. 6, besides γo, should be also associated to the fact that real fracture surface is rough and therefore, it also affects crack propa-gation initiation. It must also be emphasized that γp mark-edly depends on the temperature.
Roughness is a fracture surface parameter that has a clear physical meaning. Based on Xin et al. work8,
Q = A r (εx) A p = ε(
2−D)
x (7)
which establishes a relationship between roughness and fractal dimension. Compared with Eq. 2, the number 2 in the above equation replaces the number 1, since the Euclidean dimension of a smooth surface is equal 2. Consequently, the value of D is equal, or greater than 2 in Eq. 7.
As previously noted, Eq. 5 is valid for fracture along a flat surface. Consider now a fracture that generates a rough surface (polycrystalline ceramics, for instance), in which the surface energy per unit area of projected surface is γeff.. Then, combining Eqs. 5, 6 and 7 it is possible to write:
G Ic, rough G Ic,flat =
KIc, rough 2
K2 Ic, flat =
γ eff., rough
γeff., flat ≈
(γo +γp) ε
(2−D)
x
(γo +γp) =
Q = Ar Ap = ε(
2−D)
x (8)
Equation 8 summarizes the main relationships found in the literature.
4.3. The new proposal
The fractal dimension expresses the fracture surface roughness and also represents the complexity of the crack’s path. Since the total energy of fracture, γwof., represents the average difficulty for crack propagation (in J/m2), it must also be associated with the fractal dimension. This propo-sition is more adequate for ceramic materials that display purely geometrical toughening mechanisms, since γwof. brings into consideration the history of stable crack propa-gation, whereas γeff. is related to the beginning of cata-strophic crack propagation.
Pezzotti et al.16 carried out an interesting work which
established an experimental correlation between KIc, γwof and a fractal parameter for hot isostatically pressed Si3N4/SiC composites. Using a profilometric analysis of the fracture surface, the authors generated log-log plots relat-ing linear roughness of surface profiles to the measurrelat-ing unit. The resulting curves are sigmoidal-like and the corre-sponding fractal parameter can be extracted from the slope. The observed changes in KIc, γwof and in the fractal parame-ter were due to differences in the microstructures, which changed the average size of SiC platelets in a Si3N4-matrix. Another paper by Pezzotti et al.15, reports the work
carried out with heat treated Si3N4/SiC composites. It de-scribes extensive efforts to obtain the R-curve of these composites. However, in this article, the authors do not quantitatively correlate any R-curve parameter to the frac-tal parameter.
Several other works have described important experi-mental correlations between Kic or γwof and a fractal
pa-rameter, although without establishing direct relations be-tween any of the fractal parameters and the R-curve17. The present work also correlates R (average R-value of an R-curve) and the fractal dimension.
It is known that the R-curve expresses the history of instantaneous difficulties for crack propagation. Pan-dolfelli et al.18 proposed that R, calculated over all points of an R-curve, should represent an average difficulty for crack propagation, therefore, R equals to 2γwof. could be assumed.
The value of R is evaluated with basis on the mathe-matical definition of average, i.e.
R ____
= ( 1 a−ao
)
∫
R((a)) aoa
da (9)
where (a - ao) defines the integration interval for crack length, a. Equation 9 is applied on experimentally determined R-curves.
For ceramic materials where only geometrical toughen-ing mechanisms are verified, it should be expected that the increase in total energy of fracture is simply due to the increase in true area of fracture surface. Hence, there would exist a correlation between R, γwof, Q, and D.
Assuming the additive concept of Davidge and Evans13, the following relation is proposed:
γwof = γo+γp+∆
__ γ _
= γeff. + ∆___γ (10)
which can be further expressed in the following form
γwof = (γo+γp)+(γo+γp)(ε(2x −D) − 1) (11)
In Eq. 10 a common notation ∆γ was used to express a geometrical microstructural mechanism that contributes for toughness increment. Equation 11 refers to a straight crack path energetically represented by the term γeff. = (γo + γp). In this equation, the fractal contribution of true surface area appears in ∆γ, which is written as (γo + γp)
(ε(2−D)
x − 1). It can be verified that for D = 2 (flat fracture
surface) γwof = γeff., since there is no microstructural contri-bution. This situation resembles a transgranular fracture or the fracture of a glass.
The terms γeff. appearing in Eqs. 6 and 10 differ numeri-cally from each other, since the experimental procedure used to determine them are also distinct. Although, the reference states (smooth fracture surface) are the same for both Eqs. 6 and 10, the γeff.-value in Eq. 6 is determined through KIc-tests, which require a catastrophic fracture condition. On the other hand, Eqs. 10 and 11 are associated to propagation under quasi-static crack extension.
Q = A r A p =
γwof γeff. =
R ____
R o = 1 + ∆ __ γ _
γ eff. = ε(2x −D) (12)
In Eq. 12, the reference is the average γeff. either for all crystallographic cleavage planes of a single crystal or for fracture of the corresponding vitreous state. It is also im-plicit in Eq. 12 the acceptable assumption that Ro ≅ 2γeff..
Experimental work is being carried out in order to verify the validity of this proposal and experimental results will be submitted shortly. Comparison of different micro-structures in materials of identical chemical composition (amorphous and totally crystallized) might be used to vali-date Eq. 12, if interlocking and friction between grains could be minimized.
5. Conclusions
• It is pointed out the importance of concept of fractal structure in physical characterization of materials.
• The fractal dimension is closely related to roughness of the fracture surface and to mechanical properties such as fracture toughness.
• The fractal analysis can reveal characteristic lengths of a fracture surface and contribute to a better under-standing of the influence of microstructure on fracture processes.
• It is proposed that the fractal dimension is related to γwof and to R when a purely geometrical toughening mecha-nism takes place.
Acknowledgment
The authors are grateful to CNPq and FAPESP for the support given to this work and to Dr. P. Sepulveda’s comments.
References
1. Lin, G.M.; Lai, J.K.L. Fractal characterization of frac-ture surfaces in resin-based composite. J. Mat. Sci. Let., v. 12, p. 470-472, 1993.
2. Hornbogen, E. Fractals in microstructure of metals.
Int. Mat. Rev., v. 34, n. 6, p. 277-296, 1989.
3. Mandelbrot, B.B.; Passoja, D.E.; Paullay, A.J. Fractal character of fracture surfaces of metals. Nature, v.
308, n. 19, April, p. 721-722, 1984.
4. Mecholsky, J.J.; Passoja, D.E.; Feinberg-Ringel, K.S. Quantitative analysis of brittle fracture surfaces using fractal geometry. J. Am. Ceram. Soc., v. 72, n. 1, p.
60-65, 1989.
5. Mu, Z.Q.; Lung, C.W. Studies on the fractal dimen-sion and fracture toughness of steel. J. Phys. D: Appl. Phys., v. 21, p. 848-850, 1988.
6. Tanaka, M. Fracture toughness and crack morphology in indentation fracture of brittle materials. J. Mat. Sci.,
v. 31, p. 749-755, 1996.
7. Tsai, Y.L.; Mecholsky Jr, J.J. Fractal fracture of single crystal silicon. J. Mater. Res., v. 6, n. 6, p. 1248-1263,
1991.
8. Xin, Y.-B.; Hsia, K.J.; Lange, D.A. Quantitative char-acterization of the fracture surface of Si single crystals by confocal microscopy. J. Am. Ceram. Soc., v. 78, n.
12, p. 3201-3208, 1995.
9. Mandelbrot, B.B. The Fractal Geometry of Nature,
Freeman, New York, p. 468, 1983.
10. Rodrigues, J.A.; Peret, C.M.; Pandolfelli, V.C. Re-lação entre energia total de fratura e dimensão fractal.
Proceedings of 12º CBECIMAT, Águas de Lindóia
-SP - Brazil, dezembro, 1996, v. 1, p. 373-376. 11. Nagahama, H. A fractal criterion for ductile and brittle
fracture. J. Appl. Phys., v. 75, n. 6, p. 3220-3222, 1994.
12. Lung, C.W. Fractals and the fracture of cracked met-als. Fractals in Physics, Pietronero, L.; Tosatti, E.,
eds., Elsevier Science Publ., p. 189-192, 1986. 13. Davidge, R.W.; Evans, A.G. The strength of ceramics:
Review Paper, Mater. Sci. Eng., v. 6, p. 281-298,
1970.
14. Lei, W.; Chen, B. Fractal characterization of some fracture phenomena. Eng. Fract. Mech., v. 50, n. 2,
149-155, 1995.
15. Pezzotti, G.; Noda, K.; Okamoto, Y.; Nishida, T. Thermomechanically induced embrittlement in hot isostatically pressed Si3N4/SiC composites. J. Mat. Sci., v. 28, p. 3080-3088, 1993.
16. Pezzotti, G.; Sakai, M.; Okamoto, Y.; Nishida, T. Fractal character of fracture surfaces and boundary values of toughness in a simple ceramic-ceramic sys-tem. Mat. Sci. Eng., v. A197, p. 109-112, 1995.
17. Russ, J.C. Examples of Fractal Surfaces, Ch.8 in Frac-tal Surfaces, Plenum Press, New York, p. 309, 1994.
18. Pandolfelli, V.C.; Nedochetko, A.P.; Silva, S.N.; Ro-drigues, J.A.; Longo, E. Curva-R em refratários de MgO-C. Proceedings of 39° Congr. Bras. de Cerâmica, Águas de Lindóia - SP, 10-13 Junho, v. 1,