H
igh pressure die casting (HPDC) is one of the most economical casting processes for manufacturing precision shaped parts in mass production. Because of the die castings’ excellent properties, more and more die casting products are used today in the automotive, aerospace, electronic and other industries [1, 2, 3]. There has been great progress in computer-assisted design (CAD) and computer-computer-assisted engineering (CAE) techniques in recent years, so the application of these techniques for modeling and simulation of the filling and solidification processes in HPDC has become more important [4, 5]. However, computer-based techniques are only of benefit when the material properties, as well as the boundary and initial conditions, used as inputs are correct. One of these parameters, the interfacial heat transfer coefficient (IHTC), characterizing the thermal resistance between the metal and the mold, is believed to be the most important parameter for computer simulations[6]. Much research work has been done in order to determine the IHTC under various casting conditions [7, 8]. However, most of the attention so far has been placed onsand or permanent mold casting processes, and there is very
Study on interfacial heat transfer
coefficient at metal/die interface
during high pressure die casting
process of AZ91D alloy
*GUO Zhi-peng1, XIONG Shou-mei1, M. Murakami2, Y. Matsumoto2, S. Ikeda2
(1. Key Laboratory for Advanced Manufacturing by Materials Processing Technology, Department of Mechanical Engineering, Tsinghua University, Beijing 100084, China; 2. TOYO Machinery & Metal Co. Ltd, 674-0091 Japan)
Abstract: The high pressure die casting (HPDC) process is one of the fastest growing and most efficient methods for the production of complex shape castings of magnesium and aluminum alloys in today’s manufacturing industry. In this study, a high pressure die casting experiment using AZ91D magnesium alloy was conducted, and the temperature profiles inside the die were measured. By using a computer program based on solving the inverse heat problem, the metal/die interfacial heat transfer coefficient (IHTC) was calculated and studied. The results show that the IHTC between the metal and die increases right after the liquid metal is brought into the cavity by the plunger, and decreases as the solidification process of the liquid metal proceeds until the liquid metal is completely solidified, when the IHTC tends to be stable. The interfacial heat transfer coefficient shows different characteristics under different casting wall thicknesses and varies with the change of solidification behavior.
Keywords: high pressure die casting (HPDC); magnesium alloy; interfacial heat transfer coefficient(IHTC) CLC number: TG249.2/TG146.2+1 Document Code: A Article ID: 1672-6421(2007)01-005-05
Male, born in 1981. Research interests: interfacial heat transfer and pressure transfer behavior during high pressure die casting process.
E-mail: [email protected]
Received date: 2006-09-07; Accepted date: 2006-11-15
*GUO Zhi-peng
limited knowledge about the interfacial heat transfer during the solidification process of HPDC.
In this work, a die casting experiment was conducted using ‘Step Shape’ casting, and the metal/die interfacial heat transfer coefficient was determined according to the temperature readings obtained at different locations inside the die by solving one of the inverse heat problems. Additionally, the influence of the casting thickness on the IHTC was also studied by comparing the IHTC profiles between different steps and the die.
1 Experiment
1.1 Experimental casting and sensor
installation
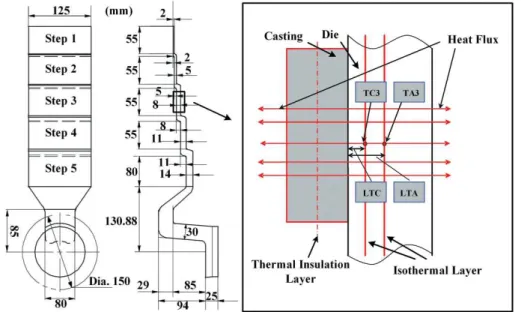
Figure 1 shows the configuration of the ‘Step Shape’ casting used during the experiment. The casting included five steps, each with different thicknesses from 2 mm (Step 1) to 14 mm (Step 5). The thickness increased progressively with intervals of 3 mm from the thinnest one (Step 1) to the thickest one (Step 5). The temperatures were measured by placing two thermocouples (TA and TC) in specific positions inside the die. TA or TC plus number are used to indicate the temperature measuring point in each step. The distances LTA and LTC from the temperature measuring point to the cavity surface are shown in Table 1.
1.2 Casting conditions
the experiment. The thermocouples were grounded sheathed K-type thermocouples with an external diameter of 1 mm at the tip and shelled into a metal pipe with a diameter of 3 mm. They were inserted in 3.2 mm holes inside the fixed die with a thermal paste. The data acquisition system used in this study was manufactured by integrated measurement and control (IMC), and it had a data collection frequency of 50 Hz. The casting material was AZ91D and the die material was H13.
2 Mathematical model
2.1. Nonlinear estimation method
In this paper a method called the nonlinear estimation method [9,10], first used by J. V. Beck, was used to determine the IHTC. This method has advantages over other procedures in that J. V. Beck studied the problem from the standpoint of effective treatment of experimental data, taking into account inaccuracies concerning the locations of thermocouples, statistical errors in temperature measurement and uncertainty in material properties[5]. The nonlinear estimation method involves the minimization of the function Fk(h), which is defined as:
where Yj,k+i and Tj,k+i are the measured temperature and the estimated temperature of the j temperature-measuring point in the k+i time step, respectively. According to the mathematical deduction, the IHTC can be determined from
Location TA1 TA2 TA3 TA4 TA5
LTA, mm 6.0 7.0 7.0 6.8 7.6
Location TC1 TC2 TC3 TC4 TC5
LTC, mm 4.0 4.0 3.8 3.4 3.0
Fig. 1 ‘Step shape’ casting and adjustment of the temperature sensors
Table 1 Distance from the temperature measuring point to the cavity surface
(1)
where φ is defined as the sensitivity coefficient, as reported in literature[10]. The IHTC of the next time step h
k+1 could be obtained by correcting hk with the addition of ∆hk+1
This calculation procedure is continued until the value of ∆hk+1 / hk+1 meets the requirement of
2.2. Determination of the temperature field
Due to the geometric factors of the casting and the die in this work, it is believed that the heat transfer process can be reasonably assumed to be one-dimensional at the step-die interface, which is governed by the following equation:
where ρ,c,k are the density, specific heat and thermal conductivity respectively. T is the temperature and is the heat source term. Because of the nonlinear material thermal properties in this study, Kirchoff’s transformation:
and the enthalpy transformation
are introduced. Substitution of Eqs (6) and (7) into Eq. (6) educes (3)
(4)
(5)
(6)
(7)
Table 2 Die casting process parameters during the experiment
Process parameters Low speed, m/s High speed, m/s Casting pressure, MPa
Cooling time, s Melt temperature,ņ Die temperature, ņ Circulation time, s
Value 0.4
2 24 13 680 150 60
3 Results and discussion
A total of 15 shots were performed during the experiment. Ten preliminary shots were sequentially performed to preheat the dies to the equilibrium condition before the formal shots were carried out. The last five shots, namely Circle 1 through Circle 5, were the formal experimental shots. The process parameters during the experiment are shown in Table 2.
The metal surface temperature (MST), metal center temperature (MCT) and related temperature difference (TD) during Circle 1 of Step 2
Fig. 5 Measured temperatures at locations TA2 and TC2
Fig. 2
Fig. 3 Calculated IHTC from Circle 1 to Circle 5
Comparison between the die surface temperature (DST) and the measured temperature of Circle 1 of Step 2
Fig. 4
The temperature profiles of the fifteen cycles measured at locations TA2 and TC2 are shown in Fig.2. The die temperature rose quickly immediately after the die casting shot was performed until reaching its maximum value. It then fell as the solidification process proceeded. Explicit cyclic changes could be found from the temperature profiles, which indicated the performance of the cyclic die casting processes. Figure 3 shows the IHTC from Circles 1 to 5. The trends of the changes in the five IHTC profiles were quite similar and the maximum IHTC values were around 2 750 to 3 000 W/m2ĄK. After reaching the maximum value, the IHTC fell to 200 W/m2ĄK before the dies were opened. Because these circles were carried out under the same conditions, the results indicated that the experiment was quite reproducible. In addition, an obvious change in the IHTC value occurred in the later part of each cycle, indicating a great change in the value of the heat flow density when the spraying process was applied.
Figure 4 shows the calculated die surface temperature (DST) and the measured temperatures at TA2 and TC2 during Circle 1. The DST rose from 180 ņ to 272 ņ as long as the die casting shot was performed. When the spraying process was performed, the DST had a great drop and the value of drop is greater than that of inside.
Calculated IHTC and the metal solid fraction (MSF) between Step 2 and the die during Circle 1 Fig. 6
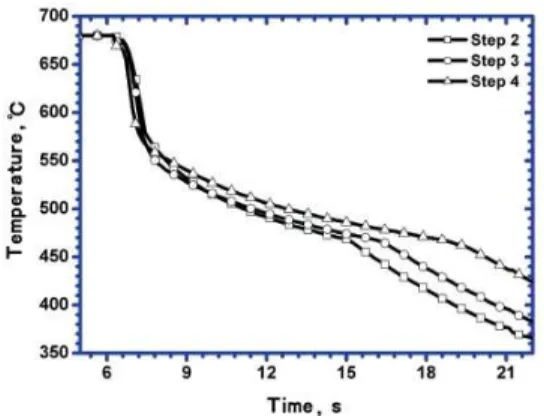
Comparison of MST between Steps 2, 3, and 4 during Circle 1
Fig. 8
Comparison of IHTC between Steps 2, 3, and 4 in Circle 1
Fig. 9
Calculated IHTC vs MSF in Circles 1-5 of Step 2 Fig. 10
Comparison of DST between Steps 2, 3 and 4 during Circle 1
Fig. 7
Figures 7 and 8 show the DST and the MST during Circle 1 at Steps 2, 3 and 4. The casting thickness had a great influence on the IHTC, and the thicker the casting part was, the higher the DST would be. It is notable that the DST at Step 4 was quite different from those of the other two steps, where the temperature increased a little after climbing sharply from the original lower value instead of decreasing gradually after approaching the maximum value as the solidification proceeded. In addition, the DST at Step 4 was much higher than those of the other steps. This agreed well with the actual situation, in which more heat was extracted from the thicker casting parts to the die. The MST of Step 4 was also higher than those of the other steps, especially at the later part of the solidification process, as shown in Fig. 8.
Figure 9 shows the calculated IHTCs between Steps 2, 3, and 4 and the die. Similar trends can be found in the IHTC profiles of Steps 2 and 3. The IHTC rose sharply after the molten metal contacted the die until reaching its peak value and fell as the solidification proceeded until reaching its steady value (500 W/m2ĄK in Step 2 and 1 000 W/m2ĄK in Step 3) after the metal was completely solidified. The peak value, 6 200 W/ m2ĄK, was higher between Step 3 and the die than that between Step 2 and the die. The trend of the IHTC profile change between Step 4 and the die was quite different from those between the other two steps and the die, in that the IHTC stayed at a value of about 4 700 W/m2ĄK for about 1 second instead of continuously decreasing in value after it dropped from the maximum value of 7 000 W/m2ĄK. The IHTC value after the molten metal was completely solidified (1 600 W/m2ĄK) was also much higher than those of the other steps.
Calculated IHTC vs MSF in Circles 1-5 of Step 3 Fig. 11
Calculated IHTC vs MSF in Circles 1-5 of Step 4 Fig. 12
reached the critical value, while a nonlinear pattern was found between Step 3 and the die. The trend of IHTC change between Step 4 and the die was different from those of the other two steps in that: (1) The IHTC reached its highest value when the MSF was only a little higher than 0; (2) A steady value of about 4 700 W/m2ĄK was approached when the MSF reached 0.15-0.4, after which the IHTC continued to decrease.
4 Conclusions
(1) The IHTC in HPDC increases quickly right after the die
Hines J A. Determination of interfacial heat-transfer boundary conditions in an aluminum low-pressure permanent mold test casting. Metall. Trans., 2004, 35B(2): 299.
Griffiths W D. A model of the interfacial heat-transfer coefficient during unidirectional solidification of an aluminum alloy. Metall. Trans., 2000, 31B(2): 285.
Michel F, Louchez P R, Samuel F H. Heat transfer coefficient during solidification of Al-Si alloys: effects of mold temperature, coating type and thickness. AFS Trans., 1995, 103: 275-283.
Santos C A, Quaresma J M V, Garcia A. Determination of transient interfacial heat transfer coefficients in chill mold castings. J. Alloy. Compd., 2001, 319: 174-186.
Prabhu K N, Kumar S A, Venkataraman N. Effect of coating/ mold wall/casting thickness on heat transfer and solidification of Al-Cu-Si alloy (LM-21) in cast iron molds. AFS Trans., 1994, 109: 94-109.
Lin S-M, Chen C-K, Yang Y-T. A modified sequential approach for solving inverse heat conduction problems. Int. J. Heat Mass Transfer., 2004, 47: 2669-2680.
Huang C-H, Chin S-C. A two-dimensional inverse problem in imaging the thermal conductivity of a non-homogeneous medium.
Int. J. Heat Mass Transfer., 2000, 43: 4061-4071.
Lau F, Lee W-B, Xiong S-M, Liu B-C. A study of the interfacial heat transfer between an iron casting and a metallic mould. J. Mater. Process. Technol., 1998, 79: 25-29.
Beck J V. Nonlinear estimation applied to nonlinear inverse heat conduction problem. Int. J. Heat Mass Transfer., 1970, 13: 703.
Beck J V, Blackwell B, St. Clair C R. Inverse Heat Conduction: Ill-posed Problems. Wiley Intersc., New York, 1985.
[1]
[2]
[3]
[4]
[5]
[6]
[7]
[8]
[9]
[10]
References
casting shot is performed until reaching its maximum value and then tends to be stable before the opening of the die.