Received: March 28, 2018. In Revised Form: July 12, 2018. Accepted: August 16, 2018. Available online: August 20, 2018
Offshore Energy Harvesting of a Marine Floating Pendulum Platform
Model
Frederic C. Janzena
Angelo M. Tusseta*
Jose M. Balthazara,b
Rodrigo T. Rochaa
Jeferson J. de Limab
Airton Nabarretec
a UTFPR – Universidade Tecnológica Federal do Paraná. Ponta Grossa – PR, Brazil. E-mail: [email protected], [email protected], [email protected], [email protected]
b UNESP – Universidade Estadual Paulista. Bauru – SP, Brazil. E-mail: [email protected]
c ITA - Instituto Tecnológico de Aeronáutica. São José dos Campos-SP, Brazil. E-mail: [email protected]
* Corresponding author
http://dx.doi.org/10.1590/1679-78255006
Abstract
This work presents an analysis of an ocean wave energy harvesting system. This system is composed of a direct current (DC) power generator attached at the middle-top of a floating platform. A pendulum is connected to the generator’s shaft. It is considered that the ocean waves motion swings the platform in the vertical direction, which transfers energy to the pendulum, making possible to convert mechanical energy, induced by the ocean wave, into a rotational motion due the pendulum and after in electric energy due the generator. With the objective to optimize the harvested power, several analyses of the pendulum parameters, ocean wave amplitude and frequency were carried out. This work was based on the Brazilian’s coast characteristics. Numerical and experimental results were performed which shows the efficiency of the conversion of mechanical energy provided by the pendulum into electric power.
Keywords
Nonlinear Dynamics of Structures, Ocean Space Utilization, Ocean Energy Technology, Mathematical Modeling
1 INTRODUCTION
Due the need of the modern world for renewable energy, many researches have focused the exploring new energy sources. Between these energy sources are they provided in thermal way, by kinetics way or by magnetic way. One of these energy sources is the ocean wave energy harvesting. Because of its high-energy density and persistence, this kind of energy has inspired numerous inventors and researchers to convert the wave oscillation into usable energy (Kong et al.,2014, Stephen, 2006, Priya and Inman, 2009, Chen et al., 2013, Drew et al., 2009, De Paula et al., 2012, Pavlovskaia
There are many technologies described in the literature to convert the ocean wave energy, like as systems based on oscillating water column, which moves an air turbine with the air displaced through an oscillating water column as presented in Bønke and Ambli (1986). Another way to convert this energy is through oscillating bodies coupled to a linear electrical generator as presented by Waters et al. (2007). Other technology are the overtopping systems like as floating structures as the Wave Dragon presented by Kofoed et al. (2006).
Considering the floating structures, there are many ways to convert its oscillations into energy. One of this is presented by Kecik et al. (2017), which shows a magnetic levitation harvester. Other way is due a pendulous system, where the pendulum is excited through the wave oscillation (Wiercigroch, 2010). The parametric pendulum is recurrently applied in energy harvesting applications as presented in Wiercigroch et al., (2011), Iliuk et al. (2013), Marques et al. (2017a), Dos Santos et al. (2015), Rocha et al. (2016) and Nandakumar et al. (2012).
In the last years, many works in the literature have showed experimental systems involving the pendulum swing to energy conversion, as shown in Ogai et al. (2010), and Lenci and Rega (2011), where they demonstrate a comparison between the experimental to theoretical results.
For simplify the choose of the element parameters of the energy harvesting system, many researchers are using the bio-inspired optimization methods, which consist of implementing GA (Genetic Algorithm) and PSO (Particle Swarm Optimization) to optimize in an effective way, the uniqueness and peculiarities of an energy harvesting device for marine applications (Pirisi et al., 2013).
This work is an extension of the paper presented by Marques et al. (2017b) and presents an energy harvesting system based on the movement of a parametrical pendulum coupled to a floating platform and excited by the ocean waves. The pendulum is coupled to a DC power generator, which converts the rotational movement of the pendulum, due the vertical oscillations of the floating platform, in DC electric energy. The main objective of this work is to maximize the energy harvesting of the system through parametrical analysis of the pendulum’s mass and length, and the ocean
wave amplitude and frequenys, based on the Brazilian coast characteristics, who’s described in Feitosa (1989) and Carvalho (2010). In this work, new results are presented by applying a PSO algorithm in order to optimize the system parameters, and experimental test was performed by using a wave simulation system based on an ABB IRB 2600 robot.
2 FLOATING PLATFORM MATHEMATICAL MODELLING
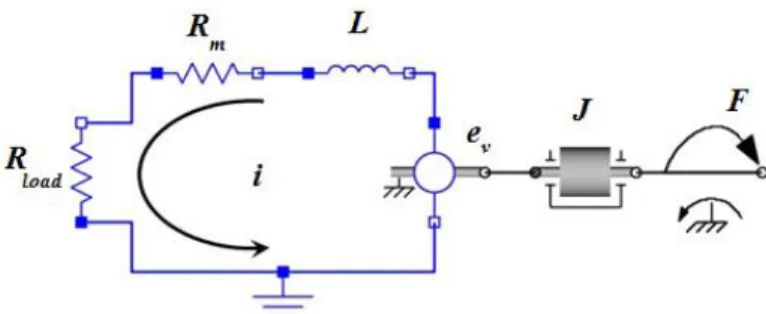
The Figure 1 illustrates the proposed harvesting system, which consists of a DC power generator with a pendulum connected to its shaft. This system is fixed in a floating platform, which is floating on the ocean.
The pendulum has a mass m and length l, and rotational angle θ. The DC generator mass is M2 and the platform mass M1.
Considering the platform is floating on the ocean, it is known that thrust force push up the platform. The thrust force in this case is represented through a spring with stiffness k, which is directly linked to the platform, so it can be considered as a non-fixed base. In addition, a linear term c representing the viscous damping of the water is included.
Figure 1: Floating energy harvesting system excited by a harmonic
The generalized coordinate are represented by Y and θ, by considering the mass of the platform by Y and the angular displacement of the pendulum by θ. A harmonic displacement represented by F = Asin(wt),is applied to the base, where
The pendulum movement is considered as written in Equation (1).
(
)
1
1 sin
1 cos
x l
y Y l
== + − (1)
The kinetic energy of the floating system is given by the mass of the pendulum, platform and DC generator, and is shown in Equation (2).
(
)
2(
2 2 2)
1 2
1 1
2 sin
2 2
T = M +M Y + m l
+Y + l Y
(2)The potential energy of the system is given by the sum of the restoration force due the thrust force between the water and the floating platform, and the pendulum gravitational potential energy, denoted by Equation. (3).
(
)
2(
(
)
)
1
1 cos 2
V = k Y−F +mg Y+l −
(3)The Rayleigh-Ritz dissipation function is defined by the linear viscous damping of the water, presented in Equation (4).
(
)
21 2
D= c Y−F (4)
The equations of motion for the system shown in Figure 1 are obtained applying the Lagrange’s energy method to Equations (1) to (4). The equations of motion are presented in Equation (5). The first equation represents the platform motion and the second one the pendulum rotation.
(
)
(
)
(
)
(
)
2
2
sin( ) cos( ) ...
sin( ) cos( ) 0
sin cos cos 0
MY k Y A wt c Y Aw wt
ml mg
ml ml Y Y gml
+ − + − +
+ + =
+ + − =
(5)
where M = M1 + M2 + m.
2.1 Mathematical modelling of the DC electric power generator
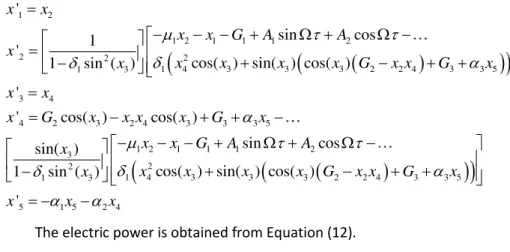
In Figure 2, the DC generator model is illustrated. This model considers the generator as an RL electric circuit, which consists of a load resistance Rload, wich can be any kind of resistive load, an output voltage ev, an internal resistance of the electric generator Rm, an inductance L, and the electric current i.
Figure 2: DC generator electric circuit representation
v b
e =k (6)
where kb is the electromotive force constant and
is the angular speed. The equation of motion of the electric circuit is given by Equation (7).b
k = −Li−Ri (7)
where: R = Rm + Rload, i is the electric current, and i d i( ) dt
= .
The torque produced by the current which flows in opposite direction to the torque applied to the motor shaft, can be written as in Equation (8).
m t
F =k i (8)
where kt is the torque constant and Fm the generated torque.
By analyzing Equations 7 and 8, it is possible to see that the load resistance value Rload has a high impact over the generated torque, so the lower the value of Rload, higher is the current and, consequently, the generated torque may brake the pendulum system hampering the pendulum swing motion.
The equations of motion for the complete harvesting system are given by including Equation (7) in Equations (5), as presented in Equation (9).
(
)
(
)
(
)
(
)
2
2
sin(
)
cos(
)
sin( )
cos( )
0
sin
cos
cos
tb
MY
k Y
A
wt
c Y
Aw
wt
ml
mg
ml
ml Y
Y
gml
b
k i
Li
Ri
k
+
−
+
−
+
+
+
=
+
+
−
= − +
= − −
(9)In order to simplify the simulations, a dimensionless process is carried out, which results in dimensionless system equations, given by Equation (10).
(
)
1 1 1 1 2
2 3 3
1 2
cos
sin
cos
sin
0
sin
cos
cos
0
0
y
y
y
G
A
A
y
y
G
G
z
z
z
+
+ +
+
+
−
−
=
+
+
−
+
−
=
+
+
=
(10) where: 1 01 2 1 1 2 2 2
0
3 2 2 3 2 2 1 2
0 0
t b
k w Y i m
t y z
M l i M
mg c A Acw g
G A A G
M l M l M l l
k i k
b R
G
ml ml L i L i
= = = = = = = = = = = = = = =Consideringx1=y, x2 = y, x3= , x4 =' and x5=z, the dimensionless equations of motion are represented,
(
)
(
)
(
)
1 2
1 2 1 1 1 2
2 2 2
1 4 3 3 3 2 2 4 3 3 5
1 3
3 4
4 2 3 2 4 3 3 3 5
1 2 1 1 1 2
3 2 1 3 ' sin cos 1 '
cos( ) sin( ) cos( ) 1 sin ( )
'
' cos( ) cos( )
sin cos
sin( ) 1 sin ( )
x x
x x G A A
x
x x x x G x x G x
x
x x
x G x x x x G x
x x G A A
x x = − − − + + − = + − + + − = = − + + − − − − + + −
(
2(
(
)
)
)
1 4 3 3 3 2 2 4 3 3 5
5 1 5 2 4
cos( ) sin( ) cos( )
'
x x x x G x x G x
x x x
− + − + + = − − (11)
The electric power is obtained from Equation (12).
2
e load
P =R i (12)
where, Pe is the estimated electrical power, and i is the electric current of the DC motor circuit.
The average electric power will be considered in the RMS form in order to analyze the efficiency of the energy generation, according to Equation (13).
n 2
e_rms e_rms j
j 1
1
P P
n =
=
(13)In the next sections, the numerical simulations of the proposed harvesting system will be shown, as well the analysis of the generated power and its improvement.
3 NUMERICAL SIMULATIONS AND DISCUSSIONS OF THE PROPOSED PENDULUM-GENERATOR-PLATFORM SYSTEM
Numerical simulations using the 4th order Runge-Kutta integrator with step 0.01, was performed in order to generate data for the dynamical analysis of the system. The simulation parameters are shown in Table 1.
Table 1: Parameter`s value of the system
Parameter Value Means
M1 [kg] 200 Platform mass
M2 [kg] 5 DC Motor mass
m [kg] Vary Pendulum mass
c[Ns/m] 80 Water-Fluid damping
l[m] Vary Pendulum length
g[m/s2] 9.81 Gravity Acceleration
k[Nm] 1800 Stiffness of the spring proportional to buoyancy force
Rm[Ohm] 4.57 Internal Resistance of the motor
Rload[Ohm] 1.0 Resistance of load
L[H] 0.0032 Inductance of the electric circuit
kt[Nm/A] 0.23309 Constant torque of the motor
kb[Vs/rad] 0.23309 Electromotive force constant
A[m] Vary Amplitude of ocean waves
w[rad/s] Vary Frequency of ocean waves
i0 1.0 Free dimensionless parameter
b[Nms/rad] 0.001405 Viscous friction between the axis and bearing of the DC motor
The parameters of the harvesting system were retrieved from Dos Santos et al. (2015), except to the wave amplitude
and frequency are maximum, the second one is considered an average value to the amplitude and frequency. Both cases are considered the weather of waves obtained in the period of 1997 and 2009 by Carvalho (2010). The parameters that are in red will be varied along the paper.
3.1 Dynamical and energy harvesting analysis considering maximum frequency and amplitude
In this topic, the values of the mass and length of the pendulum are analyzed by considering the maximum values of the amplitude and frequency of the ocean waves, seeking the best values that generate the higher RMS power. The ocean wave amplitude and frequency are, respectively A = 4.5m and w = 1.2712rad/s (Dos Santos et al., 2015).
Figures 3 shows the variation of the average RMS harvested power considering the interval of pendulum mass as 0.5 ≤ m ≤ 1.0 [kg] and the length as 0.3 ≤ l ≤ 0.6 [m]. It is possible to see that the harvested power is maximum when the pendulum has a mass m = 0.8kg and length l = 0.3m.
Figure 3: (a) Surface of the average RMS harvested electric power versus pendulum mass 0.5 ≤ m ≤ 1.0 [kg] and length 0.3 ≤ l ≤ 0.6
[m], considering A = 4.5m and w = 1.2712rad/s. (b) colored contour of the average RMS.
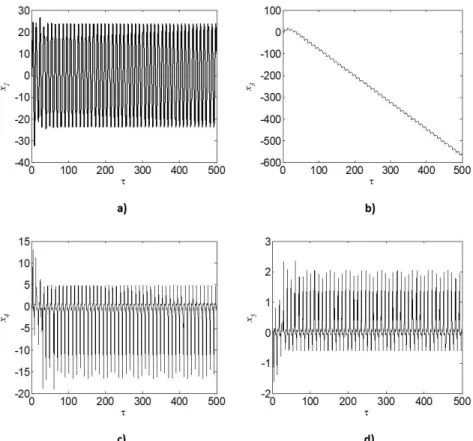
Figure 4 shows the time histories for the for mentioned parameters, being that, Figure 4a shows the displacement of the floating platform, Figure 4b the angular displacement of the pendulum, Figure 4c the angular velocity of the pendulum and Figure 4d the electric current generated by the DC power generator.
Figure 4: (a) Time histories of (a) floating platform Displacement; A = 4.5m, w = 1.2712rad/s, m = 0.8kg and l = 0.3m. (b) Angular displacement of the pendulum. (c) Angular velocity of the pendulum. (d) Electric current of the generated.
In order to determine the influence of the ocean waves frequency and amplitude in the harvested power, a variation of these parameters is carried out considering the pendulum values as m = 0.8kg and l = 0.3m because these values represent the maximum harvested power in Figure 3.
In Figures 5 it is possible to see the surfaces of the variation of the average RMS harvested power versus the ocean
wave amplitude 0.6 ≤ A≤ 4.5 [m] and frequency 0.5 ≤ w ≤ 1.8 [rad/s] respectively. It is showed that the maximum harvested power is obtained when A = 4.5m and w = 1.8rad/s.
Figure 5: (a) Surface of the average RMS harvested electric power versus ocean wave amplitude 0.6 ≤ A ≤ 4.5 [m] and frequency 0.5
≤ w ≤ 1.8 [rad/s], considering m = 0.8kg and l = 0.3m. (b) Colored contour of the average RMS harvested electric power versus ocean wave amplitude
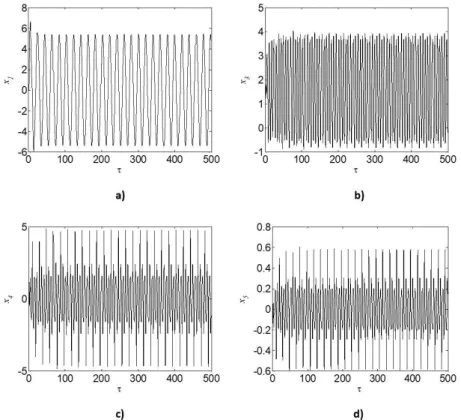
shows the displacement of the floating platform, Figure 6b the angular displacement of the pendulum, Figure 6c the angular velocity of the pendulum and Figure 6d the electric current generated by the DC power generator.
For these parameters, the platform behavior showed to be also periodic with slight motion with high amplitudes. However, the pendulum have presented rotational motions with a considerably velocity, increasing the harvested power, from 0.3763W in the first analysis to 0.5873W of amount of RMS power, approximately.
Figure 6: (a) Time histories of (a) floating platform Displacement; A = 4.5m, w = 1.8 rad/s, m = 0.8kg and l = 0.3m. (b) Angular displacement of the pendulum. (c) Angular velocity of the pendulum. (d) Electric current of the generated.
However, as these maximum values of ocean wave amplitude and frequency are obtained in rare situations, the following subsection considers the variation of an average value of amplitude and frequency of the ocean waves.
3.2 Dynamical and Energy Harvesting analysis considering the Average Frequency and Amplitude
In this part of the work, the parameters of the pendulum, mass and length, and the amplitude and frequency of the ocean waves will be obtained analyzing an average of these parameters using the numerical method of Particle Swarm Optimization, near the values of maximum estimated power.
The Particle Swarm Optimization (PSO) algorithm was proposed by Kennedy and Eberhart in 1995 (Kennedy, 2011). This algorithm works as a strategy to search the best solution of optimization problems. PSO is a population-based stochastic algorithm and it was inspired by social intelligence system of social interaction of bird flock or fish schooling. There are three principles that the individual or particle follow: Evaluate, Compare and Imitate.
The mathematical model decision of the behavior is given by Equation (14).
(
)
(
)
1
1 1 2 2
n n n n
i p i i i i i
v
+=
v
+
c
p
−
x
+
c
g
−
x
(14)where n i
v is the ith particle velocity in interaction n, ωp is the Inertia weight,
1,2
c the individual and sociality weights,
1,2
Random factors,
i
p and gi are the best individual position and neighborhood position, respectively, and n i
x particle position in interaction n.
1 1
n n n
i i i
x + =x +v + (15)
Therefore, the interval of the parameters to be analyzed are, to the pendulum mass 0.5 ≤ m≤ 1.5 [kg], length 0.3 ≤ l≤ 0.8 [m], wave amplitude 0.15 ≤ A ≤ 3.25 [m] and frequency 0.3 ≤ w ≤ 0.95 [rad/s]. The intervals defined in this
subsection were chosen because of some limitations of the experimental part, which will be presented in the next section. The optimization convergence curve of PSO algorithm is shown in Figure 7. The curve showed the convergence of the maximum average power, showing the optimized parameters that are m = 0.5797kg, l = 0.5016m, A = 2.4325m
and w = 0.9419rad/s. The average power in RMS using these parameters is Pe_rms = 0.0684.
Figure 7: Convergence curve of Particle Swarm Optimization algorithm
Figure 8 shows the time histories of the displacements using m = 0.5797kg, l = 0.5016m, A = 2.4325m and w = 0.9419rad/s, where Figure 8a shows the displacement of the floating platform, Figure 8b the angular displacement of the pendulum, Figure 8c the angular velocity of the pendulum and Figure 8d the electric current generated by the DC power generator.
Therefore, using the PSO, it is possible to obtain a maximum average power of Pe_rms = 0.0684, less than using the maximum values of amplitude and frequency. However, these values are optimum and more easily to obtain by ocean waves.
In the next section, experimental results of energy harvesting will be carried out.
4 EXPERIMENTAL RESULTS OF THE ENERGY HARVESTING
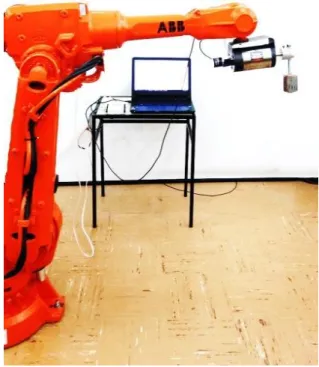
This section will show the results of an experimental system built to validate the numerical simulations. The experimental system assembly, as illustrated in Figure 9, is composed of a Robotic Arm IRB 2600, which is used to emulate the ocean waves, a DC power generator, a pendulum connected to the DC generator shaft with 0.8kg mass and length of 0.3m. The angular position of the pendulum is measured by an encoder with 12 bits resolution. To measure the electric current, a 1 Ohm load resistor is coupled to the DC generator emulating the electric load, and a current sensor is connected to the system. These sensors are connected to a Data Acquisition system DAQ 6212 from National Instruments and the data are collected by a virtual instrument developed in LabView programing language. The assembled experimental system is presented in Figure 10.
Figure 9: Schematic image of the experiment’s setup
Figure 10: Experimental apparatus of the pendulum coupled to the DC generator.
The experiment considers ocean wave amplitude of 0.5m because of the limitations of the Robotic Arm displacement. The frequency was set to 3rad/s.
to compare the behaviour and oscillations of the system. In the same way, the pendulum oscillates with a high angular position, consequently, the angular velocity shown itself with good values to the energy harvesting, since the angular velocity is proportional to the generated current by the DC generator. Even the pendulum does not rotate, it keeps oscillating all the time, what is very important.
Figure 11: (a) Angular position of the pendulum measured from the experimental system for A = 0.5m and w = 3 rad/s. (b) angular velocity of the pendulum measured from the experimental system
Knowing the intensity of the angular velocity, Figure 12 shows the electric current signal measured from the experiment using LabView. As the pendulum oscillates, to the set conditions of ocean waves, the average electric current in RMS is 0.3296 A.
Applying the power relations of Equation (13) to a load resistance of 1 Ohm, the harvested power from the pendulum motion generated through the DC power generator is 0.3296 W.
Figure 12: Electric current signal measured from the experimental system for A = 0.5m and w = 3rad/s
This experimental attempt showed that is possible to harvest energy from a pendulum oscillation with good values of power. Therefore, in the next section, will be exposed the conclusions of this work.
CONCLUSIONS
harvest energy. General analysis of some essentials parameters was carried out using three different ways: standard parametrical variations, using a PSO algorithm technique and experimental tests.
The numerical simulations was carried out by applying 4th Runge-Kutta the integration method. The results showed a parameter variation of the four most important parameters of the harvesting system, that are the pendulum length and mass, and the ocean wave amplitude and frequency. The mass and the length of the pendulum have showed to be the most sensible with their variation, as shown in Figures. 3. It was shown that the amplitude and frequency of ocean wave are not less important than the pendulum mass and length has a foremost importance in the harvested power, however, as shown in Figures 5, the highest amount of harvested power keeps in a smaller region of parameters than in Figures 3.
The Power Swarm Optimization (PSO) algorithm showed to be a very good tool to set up the four parameters. As describe in the Subsection. 3.2, the interval of the pendulum and ocean waves parameters were chosen due to the limitation of the Robotic Arm IRB 2600, finding an optimum configuration to these parameters considering the equations of motion of the system.
Moreover, the experimental part of this work was carried out in order to simulate the behavior of the theoretical system. It is difficult to compare the values of power, however the behaviors of the system and oscillation of pendulum and the generated electric current were very similar to the experimental ones. In addition, the harvested power showed a very good value for harvesting although more tests changing the configurations is necessary.
In general, Table 2 shows a summary of the three techniques related to the harvested power and the final configuration of each it, where case 1 is the numerical simulations with Runge-Kutta case, case 2 is the use of PSO and case 3 is the experimental analysis.
Table 2: Parameter`s value of the system
Case Amplitude A [m]
Frequency w [rad/s]
Mass m [kg]
Length l [m]
Harvested power
1 4.5 1.8 0.8 0.3 0.5873
2 2.4325 0.9419 0.5797 0.5016 0.0684
3 0.5 3.0 0.8 0.3 0.3296W
ACKNOWLEDGMENT
The authors acknowledge support by CNPq (grant:447539/2014-0) and CAPES, all Brazilian research funding agencies
REFERENCES
Bønke, K. and Ambli, N. (1986). Prototype wave power stations in Norway. In Utilization of Ocean Waves-Wave to Energy Conversion. ASCE. 34-45.
Carvalho, J.T., (2010). Simulation of energy distribution of ocean waves from the Brazilian`s coast. Master’s Thesis, (INPE) Instituto Nacional de Pesquisas, São José dos Campos, Brasil (in portuguese).
Chen, Z., Yu, H., Hu, M., Meng, G. and Wen, C. (2013). A review of offshore wave energy extraction system. Advances in Mechanical Engineering. 623020(1-9)
De Paula, A. S., Savi, M. A., Wiercigroch, M. and Pavlovskaia, E. (2012). Bifurcation control of a parametric pendulum. International Journal of Bifurcation and Chaos, 22(05), 1250111(1-14).
Drew, B., Plummer, A. R. and Sahinkaya, M. N. (2009). A review of wave energy converter technology. Proceedings of the Institution of Mechanical Engineers, Part A: Journal of Power and Energy, 223(8), 887-902.
Dorf, R. C. and Bishop, R. H. (1998). Modern control systems. 7a Edition, Pearson Prentice Hall, LONDON.
Dos Santos, G. P., Tusset, A. M., Piccirillo, V., Marques, C. E., Janzen, F. C., Brasil, R. M. L. R. F. and Balthazar, J.M. (2015). A note on use of a boarded pendulum for generation of electricity. In: 23rd ABCM International Congress of Mechanical Engineering, Rio de Janeiro, Brazil, 1-8.
Feitosa, A. C. (1989). Morfogenetic Evolution of the north coast of Maranhão`s Island, Rio Claro, UNESP: 210 p (Phd Thesis, in portuguese).
Iliuk, I., Balthazar, J. M., Tusset, A. M., Piqueira, J. R. C., de Pontes, B. R., Felix, J. L. P. and Bueno, A. M. (2013). A non-ideal portal frame energy harvester controlled using a pendulum. The European Physical Journal Special Topics, 222(7), 1575-1586.
Kecik, K., Mitura, A., Lenci, S. and Warminski, J. (2017). Energy harvesting from a magnetic levitation system. International Journal of Non-linear Mechanics, 94, 200-206.
Kennedy, J. (2011). Particle swarm optimization. In Encyclopedia of machine learning (pp. 760-766). Springer US, 760-766.
Kofoed, J. P., Frigaard, P., Friis-Madsen, E. and Sørensen, H. C. (2006). Prototype testing of the wave energy converter wave dragon. Renewable energy, 31(2), 181-189
Kong, L. B., Li, T., Hng, H. H., Boey, F., Zhang, T. and Li, S. (2014). Waste Energy Harvesting. Springer, New York, vol 24, 592 p.
Lenci, S. and Rega, G. (2011). Experimental versus theoretical robustness of rotating solutions in a parametrically excited pendulum: a dynamical integrity perspective. Physica D: Nonlinear Phenomena, 240(9), 814-824.
Marques, C. E., Balthazar, J. M., Rocha, R. T., Tusset, A. M. and Janzen, F. C. (2017a). A parametric analysis of an ocean wave energy harvesting system. Revista Interdisciplinar de Pesquisa em Engenharia - RIPE, 2(19), 68-83.
Marques, C. E., Balthazar, J. M., Tusset, A. M., Rocha, R. T., Janzen, F. C., De Lima, J. J. and Nabarrete, A. (2017b). Ocean wave energy harvesting of a floating pendulum platform coupled system. In: Awrejcewicz J, Kaźmierczak M, Mrozowski J and Olejnik P (eds) Engineering Dynamics and Life Sciences. ARSA Druk, Łódź, Poland, pp. 329-340.
Nandakumar, K., Wiercigroch, M. and Chatterjee, A. (2012). Optimum energy extraction from rotational motion in a parametrically excited pendulum. Mechanics Research Communications, 43, 7-14.
Ogai, S., Umeda, S. and Ishida, H. (2010). An experimental study of compressed air generation using a pendulum wave energy converter. Journal of Hydrodynamics, Ser. B, 22(5), 290-295.
Pavlovskaia, E., Horton, B., Wiercigroch, M., Lenci, S. and Rega, G. (2012). Approximate rotational solutions of pendulum under combined vertical and horizontal excitation. International Journal of Bifurcation and Chaos, 22(05), 1250100(1-13).
Pirisi, A., Grimaccia, F., Mussetta, M., Zich, R. E., Johnstone, R., Palaniswami, M., and Rajasegarar, S. (2013, June). Optimization of an energy harvesting buoy for coral reef monitoring. In Evolutionary Computation (CEC), 2013 IEEE Congress on IEEE, Cancun, Mexico, 629-634.
Priya, S. and Inman, D. J. (Eds.). (2009). Energy harvesting technologies, Vol. 21. New York: Springer, 524 pgs.
lRocha, R. T., Balthazar, J. M., Tusset, A. M., Piccirillo, V. and Felix, J. L. P. (2016). Using Saturation Phenomenon to Improve Energy Harvesting in a Portal Frame Platform with Passive Control by a Pendulum. In Dynamical Systems: Theoretical and Experimental Analysis, Springer International Publishing, 319-329.
Stephen, N. G. (2006). On energy harvesting from ambient vibration. Journal of sound and vibration, 293(1), 409-425.
Waters, R., Stålberg, M., Danielsson, O., Svensson, O., Gustafsson, S., Strömstedt, E. and Leijon, M. (2007). Experimental results from sea trials of an offshore wave energy system. Applied Physics Letters, 90(3), 034105 (1-4).
Wiercigroch, M. (2010). A new concept of energy extraction from waves via parametric pendulor. UK Patent pending.

![Figure 3 : (a) Surface of the average RMS harvested electric power versus pendulum mass 0.5 ≤ m ≤ 1.0 [kg] and length 0.3 ≤ l ≤ 0.6 [m], considering A = 4.5m and w = 1.2712rad/s](https://thumb-eu.123doks.com/thumbv2/123dok_br/16524825.735957/6.893.193.707.352.559/figure-surface-average-harvested-electric-versus-pendulum-considering.webp)


![Table 2: Parameter`s value of the system Case Amplitude A [m] Frequency w [rad/s] Mass m [kg] Length l [m] Harvested power 1 4.5 1.8 0.8 0.3 0.5873 2 2.4325 0.9419 0.5797 0.5016 0.0684 3 0.5 3.0 0.8 0.3 0.3296W ACKNOWLEDGMENT](https://thumb-eu.123doks.com/thumbv2/123dok_br/16524825.735957/12.893.127.766.533.633/table-parameter-value-amplitude-frequency-length-harvested-acknowledgment.webp)
