ABSTRACT: The electromechanical impedance method has been seen as a promising tool for structural health monitoring regarding different types of structures and purposes. Most importantly, this method can be used in real-time applications. Frequently, massive, high-cost, single-channel impedance analyzers are used to process the time domain data, aiming at obtaining the complex, frequency-dependent electromechanical impedance functions and therefore infer about the presence, position and extent of an existing damage. However, for large structures, it is desirable to deploy an array of piezoelectric transducers over the area to be monitored and interrogate these transducers successively, in order to increase the probability of successful detection of damage at an early phase. The literature describes many miniaturized systems that can monitor large structures, however, presenting serious restrictions on data acquisition capabilities. This paper presents a hardware that is not limited to any data acquisition restriction, exhibiting an innovative way to measure the electromechanical impedance of multiplexed bonded transducers. Each logical block of the proposed architecture is presented in detail. The proposed system not only avoids costly fast Fourier transform analyzers/ algorithms, but also evades high-speed data acquisition hardware. A prototype using inexpensive integrated circuits and a digital signal processor was built and tested for two different types of structures: an aluminum beam and an aircraft aluminum panel. Simulated damages were introduced to each structure, and the detection performance of the prototype was tested. The actual prototype uses a universal serial bus connection to communicate with a personal computer.
KEYWORDS: Structural integrity, Maintenance, Structural health monitoring, Avionics.
Electromechanical Impedance - Based
Structural Health Monitoring Instrumentation
System Applied to Aircraft Structures and
Employing a Multiplexed Sensor Array
Isabela Iuriko Campos Maruo1, Guilherme de Faria Giachero1, Valder Steffen Júnior1, Roberto Mendes Finzi Neto1INTRODUCTION
Structural health monitoring (SHM) can be understood as a detection strategy, which aims at identifying and locating damage in several types of structures (civil, naval, mechanical, aerospace etc.). he study of diferent SHM techniques has attracted the interest of many research centers and industries willing to monitor the integrity of structures and prevent failures due to cracks, corrosion, delamination (composite materials) and several other types of damage. In many cases, the purpose is not only to increase structural reliability since the reduction of maintenance costs is also an important issue.
Considering SHM in the context of aircrat engineering, the monitoring systems have to be reliable, cost-efective and, most importantly, invasive. To reach these requirements, non-destructive evaluation methods (NDE) have been considered as promising tools in SHM systems, according to Sun et al. (1995); Giurgiutiu and Rogers (1997); Park et al. (1999, 2000); Lopes
et al. (2000). In a NDE study, Park and Inman (2001) described diferent techniques, such as eddy current, magnetic particle, and ultrasonic inspections. Although the mentioned NDE methods are very eicient, all of them require local inspections by expert personnel. Consequently, longer periods of non-light and higher maintenance costs are expected.
The method described in this paper is based on the electromechanical impedance (EMI), which is an ultrasonic technique that has been considered as one of the most attractive
1.Universidade Federal de Uberlândia – Faculdade de Engenharia Mecânica – Uberlândia/MG – Brazil.
Author for correspondence: Roberto Mendes Finzi Neto | Universidade Federal de Uberlândia – Faculdade de Engenharia Mecânica | Av. João Naves de Ávila, 2.121
Bloco 1M – Campus Santa Mônica | CEP: 38.408-100 – Uberlândia/MG – Brazil | Email: [email protected]
methods for monitoring systems. It is able to identify structural modii cations (damage) by measuring the EMI of a PZT (lead-zirconate-titanate) transducer, which is bonded to (or embedded into) the monitored structure.
PZT transducers are examples of piezoelectric materials, exhibiting electromechanical coupling characteristics. h ese so-called smart materials have the ability to communicate between two dif erent domains. For example, if a PZT patch is attached to a mechanical structure, the mechanical impedance can be directly related to the electrical impedance. h erefore, any change or l aw in the analyzed mechanical structure can be interpreted by the PZT transducers, resulting likewise in changes of their electromechanical impedance. Due to high mechanical stif ness, low mass and fast sensing response, piezoelectric materials are used in a wide range of applications. For instance, piezoelectric crystals are found in medical instruments, telecommunications and, more specii cally, in transducer elements for accelerometers, various types of sensors, load cells, and so forth.
In the EMI technique, the PZT transducer is usually excited by a sinusoidal waveform with a low amplitude of approxima-tely 1VRMS (ef ective voltage), at frequencies ranging from 30 to 250 kHz (Raju 1997) or even up to 1,000 kHz, depending on the structure and type of application (Giurgiutiu et al. 1999). Lower frequency ranges cover a larger sensing area, whereas higher frequency ranges may determine the position of the damage (Sun et al. 1995). One of the advantages of the high-frequency response is that, at these frequencies, the wavelength of the signal applied to the structure is short enough to detect even small and incipient cracks,which can potentially grow and cause catastrophic failures in aircrat structures (Park and Inman 2005).
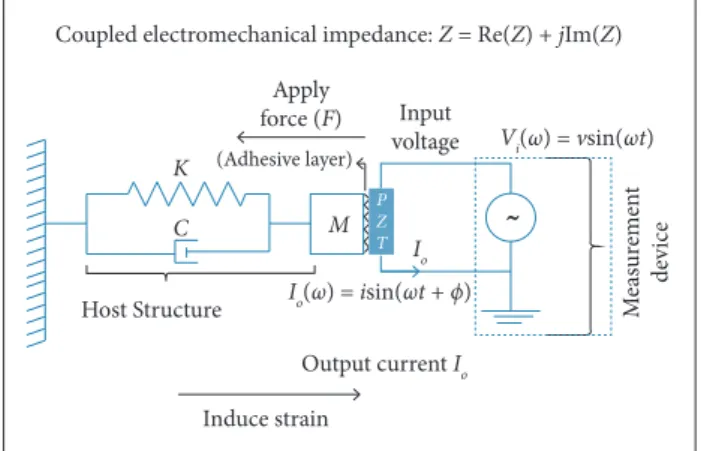
h e essence of the EMI method is illustrated in Fig. 1. h e mechanical characteristic of the piezoelectric patch is indicated by its short-circuit mechanical impedance, Za. h e host structure is characterized by its driving point mechanical impedance Zs, which includes the ef ect of its mass (M), damping (C) and stif ness(K). h e piezoelectric patch is excited by a sinusoidal voltage, VPZT, which generates a circulating current,
IPZT. h e entire electromechanical system is af ected by the dynamics of the piezoelectric patch and the host structure (Liang et al. 1994).
The solution of the wave equation for the PZT patch bonded to or embedded into the host structure leads to a frequency-dependent electrical admittance as given by Eq. 1 (Liang et al.1994):
where:
Y(ω) represents the electrical admittance (inverse of electrical impedance); ω is the excitation frequency; is the complex Young’s modulus of the PZT at zero electric i eld; d3x is the piezoelectric strain constant in the arbitrary x direction at zero stress; is the dielectric constant at zero stress; and a is a geometric constant of the PZT.
According to Park and Inman (2005), considering Eq. 1, since all other PZT properties remain constant, only the external structure’s impedance Zs(ω) may influence the global admittance. Hence, any change in the measured impedance signature (IS) can be interpreted as a structural modification.
In the PZT transducer’s configuration, the relevant electromechanical couplings are in the 3-1 and 3-2 planes, since the mechanical stresses and strains are applied along the 1- and 2-directions, while the electric i eld is applied along the 3-direction (Fig. 2).
Host Structure
(Adhesive layer) Apply
force (F) Input voltage
M
ea
sur
em
en
t
de
vice
Output current Io Io(ω) = isin(ωt + ϕ)
Vi(ω) = vsin(ωt)
Induce strain
Coupled electromechanical impedance: Z = Re(Z) + jIm(Z)
˜
C K
M Io
P Z T
Figure 1. One-dimensional model of electromechanical interaction between a piezoelectric patch and a structure.
(1)
Figure 2. PZT transducer axis.
3
2
In accordance with Eq. 2, the strain induced in the patches generates an electric ield that is captured as voltage at their terminals.
where:
Sijkl is the mechanical compliance of the material measured at zero electric ield; εjk is the dielectric permittivity measured at zero mechanical stress; djkl is the piezoelectric coupling between the electrical and mechanical variables; E is the electric ield; and T is the mechanical stress.
The real part of the EMI is mostly used to monitor the structure’s health state inside the area covered by each PZT patch bonded to the structure. he integrity of the sensor may be veriied by the imaginary part of the impedance (Giurgiutiu et al. 2002). As mentioned before, to collect the EMI signature of the monitored structure, a PZT patch can be bonded to or embedded into the structure and be used as a sensor-actuator device. By applying an AC excitation signal, the surface-bonded PZT patch can be considered to be a thin bar in axial vibration, therefore small deformations are produced in the patch and, consequently, in the structure as well. One end of the bar is held ixed, whereas the other end is connected to the external structure. his assumption (considering the interaction at two discrete points) is consistent with the mechanism of force transfer from the bonded PZT transducer to the structure (Park and Inman 2005). From each PZT patch, a corresponding IS can be obtained. In order to better locate and identify damage in the host structure, the IS is obtained in the frequency domain. To verify whether structural damage has occurred or is imminent to occur, it is initially necessary to measure the EMI of the structure in pristine condition, oten called baseline. hen, the baseline is compared with future impedance signatures (FIS). here is a number of statistical algorithms used to quantify the diference between the baseline and FIS. his paper has chosen to use the correlation coeicient deviation (CCD), Eq. 3, to analyze the experimental results that are presented in later sections of this contribution (Palomino and Stefen 2009).
n is the number of frequency points; Re(Zbase,i) is the real part of the baseline signature of the PZT impedance; Re(Zbase) is the mean value of the real part of the baseline’s PZT impedance; Re(ZFIS,i) is the real part of the signature’s PZT impedance representing the damaged state; Re(ZFIS) is the mean value of the real part of the signature’s PZT impedance representing the damaged state; Sbaseis the standard deviation of the real part of the baseline signature of the PZT impedance; SFISis the standard deviation of the real part of the signature’s PZT impedance representing the damaged state.
THE EMI MEASUREMENT PROBLEM
The simplest way to determine the electromechanical impedance of a smart structure (structure containing piezoceramic transducers) is to employ an impedance analyzer such as the HP4194A. However, this equipment costs about US$ 40,000 and weighs approximately 30 kg. here are other options that cost less than US$ 2,000 with limited functionality that could also be used; however, all of them are still bulky and heavy (weighting more than a few kilograms). Consequently, researchers have been looking for alternative ways to perform this task.
Since Sun et al. (1995), diferent architectures have been proposed to measure the EMI, attempting to avoid cumbersome and expensive equipment. Some solutions are inancially less costly and others focus on fast computational processing time.
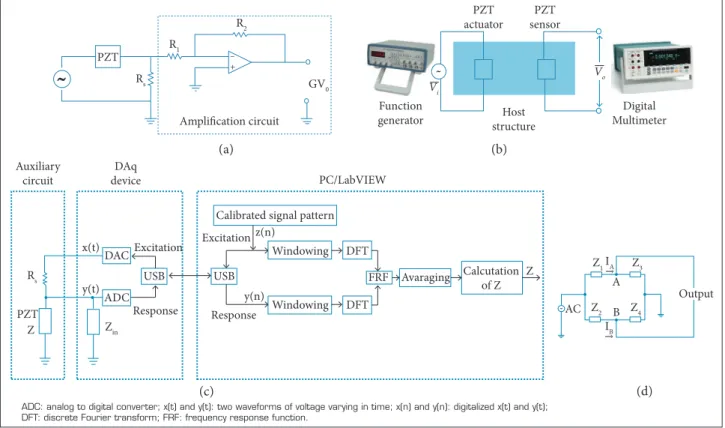
Peairs et al. (2004), for example, studied hardware diiculties related to the EMI technique and proposed a low-cost approach that uses an operational-ampliier-based device (Fig. 3a). his method improves the accessibility of impedance-based structural health monitoring (SHM) and does not utilize cumbersome equipment. Although the method has a great accessibility and is inexpensive (as compared to conventional impedance analyzers), it is still necessary to use digital signal analyzers equipped with fast Fourier transform (FFT) function, which limits the sampling frequencies. Moreover, the increase of the frequency (above 16 kHz) generates negative impedance signals, which represent massive errors in the phase measurement. he main reason for that is the very low data acquisition rate available for their data acquisition board (DAq), which is around 30,000 samples per second. he FFT algorithm can only generate precise results if the data points are acquired at a rate as large as two times the higher frequency presented in the acquired signal (Nyquist heorem). When this is not the case, the phase displacement
(3) (2)
E
T
calculated is higher than 90 degrees, and the real part of the PZT impedance becomes wrongly negative.
Lastly, only a narrow range of excitation frequencies is studied, due to limitations in the time processing and data acquisition rate of the FFT signal analyzer.
In order to enhance time processing issues, Giurgiutiu and Xu (2005) carried out studies regarding two dif erent excitation signals (frequency swept and chirp signal) with the purpose of accurately and ei ciently measure the EMI for SHM applications. h e frequency swept signal has a spectrum smoother than the chirp signal; hence, it has better accuracy for impedance measurements. On the other hand, chirp signal generates undesirable ripples in the voltage and current spectra analyzed. Despite this limitation, Baptista and Filho (2009) chose to use the chirp signal excitation. These authors used an arrangement composed by a spectrum analyzer, a DAq device, a PC with LabView and an auxiliary circuit to measure EMI and compared the results obtained with those from a conventional impedance analyzer, the HP 4219A (Fig. 3c). Very precise results are observed. Besides, the corresponding hardware can be easily assembled and can generate dif erent excitation signals. Also, dif erent metrics to evaluate structural damage
can be implemented; i nally, it can be easily applied to real-time applications. h e main drawback of this approach is that it was carried out with a restricted sampling rate in the DAq device, which limited the excitation frequency range applied to transducers bonded to the structure.
Since FFT algorithms implemented in signal analyzers are expensive and digital signal processors (DSPs) with FFT capabilities lead to signii cant computational costs and limitations, a number of authors have studied new solutions for these issues. For instance, Wang and You (2007) proposed a very simple method to measure EMI, which consists of a Wheatstone bridge circuit with dif erential amplii ers (Fig. 3d), an external clock generator, a window comparator and a control circuit. h e method does not utilize FFT analyzers, which reduces the price and the size of the equipment. Furthermore, a wide range of frequencies can be used. However, the authors worked with the impedance modulus, which is highly susceptible to temperature variations and may result in signii cant errors if compared to a conventional impedance analyzer.
Furthermore, Koo et al. (2009) presented low-cost adaptations (transfer impedance and self-impedance approaches) to measure the absolute admittance by using a digital multimeter, a frequency
ADC: analog to digital converter; x(t) and y(t): two waveforms of voltage varying in time; x(n) and y(n): digitalized x(t) and y(t); DFT: discrete Fourier transform; FRF: frequency response function.
Figure 3. Different methods to measure EMI: (a) Voltage divider circuit with amplii cation; (b) Method using a digital multimeter; (c) Method using a spectrum analyzer; (d) Wheatstone bridge circuit.
Output Z2 Z4
Z1IA
IB Z3 A
AC B
˜
Auxiliary circuit
DAq
device PC/LabVIEW
Calibrated signal pattern
Excitation Excitation
z(n) x(t)
Zin
Rs
Z PZT
y(t)
Windowing
Windowing DFT
DFT
FRF Avaraging Calcutation of Z
Z USB
USB DAC
ADC y(n)
Response Response
PZT
Rs R1
R2
GV0
Amplification circuit
– +
˜
Function generator
Vi
Vo
Host structure PZT actuator
˜
PZT sensor
Digital Multimeter
(a)
(c) (d)
generator and a circuit similar to the one presented by Peairs
et al. (2004) (Fig. 3b). his method used step-by-step excitation and was able to avoid FFT analyzers, thus reducing further costs. he study had similar results as compared with those that use conventional impedance analyzers. However, bulky and cumbersome equipment was still used, thus reducing the portability of the monitoring device.
Another method that shows interesting results is the one proposed by Pitropakis et al. (2012), in which an unusual hardware was proposed. hese authors utilize eddy current sensors for damage detection on medium to large critical areas on the aircrat, as based on the variation of the impedance of a coil sensor. he damage causes interruptions in the induced current of the coil sensor. his method is less complex to detect damage and has a simple data interpretation scheme, since it can investigate signals stemming from locations that are not directly connected to sensors. Besides, the hardware can be used in a wide range of frequencies from 1 kHz up to 1 MHz. However, it is only applicable to measure conductive materials, such as aluminum panels. Small depths and minor discontinuities parallel to the coil ield are diicult to be analyzed. Furthermore, this method uses traditional Cypher spectroscopy equipment, also resulting in cumbersome and expensive equipment.
A few other researchers followed the same approach of using complex algorithms and even more complex instrumentation hardware. For example, Rosiek et al. (2010) presented the results of impedance measurements using multiphysics harmonics analysis coupled with the inite element technique. However, the complexity persisted. Wang and Tang (2009) presented an alternative solution to the inite element technique and used the spectral element method to locate and measure the damage, leading to better results in terms of computational accuracy and numerical efficiency, determining quite precisely the size and position of damage in mechanical structures.
Not only is the computational eiciency of SHM a major issue, but also the size and volume required by the equipment and wires represent an important design challenge. For this purpose, the use of wireless systems, as proposed by Mascarenas et al.
(2007), represents a good alternative. hey used a miniature chip capable of measuring the impedance (AD5933), from Analog Devices Inc., with a 1 MS/s sampling rate. hese authors focused on studying diferent aspects of wireless systems. Park et al.
(2008) incorporated into their system a self-sensor micro iber composite (MFC) patch to excite the structure in a frequency range of 60–70 kHz. hen, the authors proposed a data analysis
procedure that incorporates the principal components analysis (PCA) algorithm and the k-means clustering algorithm. Since the original data set contains a large amount of information and correlated variables, the PCA algorithm is a statistical technique that takes a substantially smaller set of information eliminating external inluences, such as temperature and humidity. Due to the use of this algorithm, the RMSD-based damage detection results are more reliable than the RMSD results obtained without the PCA data processing.
Mascarenas et al. (2007), on the other hand, presented a system whose powering source can be wirelessly delivered through radio communication. Although the proposed system is reliable and ield-portable, only a narrow range of frequencies can be applied. he system is limited to 100 kHz, which hinders many SHM applications, according to Giurgiutiu et al. (2002). It is also noteworthy that SHM in real conditions should deal with external influences, especially because these external factors change the physical characteristics of the PZT transducers. An important factor is the temperature, whose variation afects PZT patch characteristics like permittivity, piezoelectric charge constant, electromechanical coupling factor, capacitance and resonant frequency of the longitudinal oscillation (Annamdas and Soh 2010). Consequently, the EMI technique is afected by a combination of uniform horizontal and vertical translations in the impedance plots (Sun et al. 1995). he disbond of the PZT transducer and temperature efects may cause similar variations in the susceptance signal and therefore the temperature changes have to be monitored and treated in the analysis (Overly et al. 2009).
To overcome the problems in the transducer’s dielectric as caused by temperature variation, the method proposed in the present contribution discards the imaginary part and works with the real part of the EMI, which is less sensitive to ambient conditions. However, the diiculties caused by temperature variation in the boundary conditions of the analyzed structure are still a matter of concern (Baptista et al. 2012).
PROPOSED EMI MEASUREMENT
METHODOLOGY
he proposed measurement methodology is based on the following key points:
I. No high computational cost algorithms are necessary in order to calculate each IS. Algorithms like the fast Fourier transform (FFT) are not required.
II. No high sampling rate of digital acquisition hardware (DAH) is necessary. he process of digitalizing the parameters describing the measured impedance at each frequency point of the IS is not dependent on any aspect of the DAH frequency range.
III. No specialized instrumentation hardware is required. he proposed system (hardware and sotware) performs the proposed task without requiring third party hardware and/or sotware packages.
IV. An array of PZT transducers is used to monitor and better localize possible damage in large structures. Key points # I and II represent the weak-spot of all impedance measurement methods based on time and/or frequency domain processing. he proposed measurement methodology overcomes these problems by allowing the proposed hardware to deal directly with the process of calculating the EMI parameters, without requiring complex instrumentation architectures (key point # III).
Key point # IV is directly related to the SHM problem applied to large structures. he proposed hardware shall employ a multiplexed array of PZT transducers in order to individually communicate with the instrumentation system.
he following section explains how EMI parameters can be directly calculated by the proposed instrumentation system.
EMI PARAMETERS
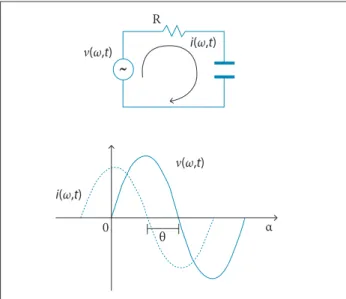
he EMI can be represented as a simple resistor-capacitor (RC) circuit connected in series with a sinusoidal excitation
applied by the instrumentation hardware (Fig. 4a), since the PZT transducers are predominantly capacitive devices. Due to the applied excitation at a given frequency, V(ω),a phase shited current will circulate through the EMI (Fig. 4b). Eqs. 4 and 5 describe mathematically these waveforms.
i(ω,t)
i(ω,t)
ν(ω,t) ν(ω,t)
R
θ
0 α
˜
Figure 4. EMI circuit and excitation: (a) Equivalent circuit; (b) Voltage applied and circulating current.
where:
ω is the excitation frequency; ν(ω,t) is the time variant voltage waveform; t means time; i(ω,t) is the time variant current waveform; I(ω) is the efective current at frequency ω; θ is the phase displacement between ν(ω,t) and i(ω,t).
he total impedance of the EMI is a complex number, which is dependent on ω. Equations 6 and 7 deine Za.
where:
f is the excitation frequency [Hz]; i is the imaginary part;
Xcis the capacitive reactance. he SHM problem relies mainly on R(ω), which is a function of ω due to the electromechanical coupling between the PZT patch and the monitored structure.
(4)
(6) (5)
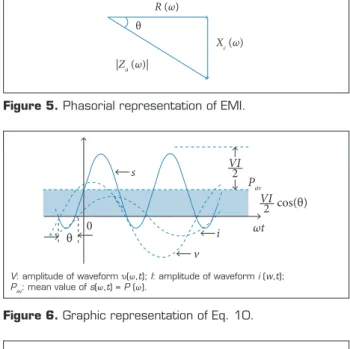
Representing Za(ω) in the phasorial diagram illustrated in Fig. 5, one leads to Eq. 8.
From Eq. 8, |Za(ω)| can be directly calculated from Eq. 9, where the ef ective values of i(ω,t) and v(ω,t), respectively IRMS and
VRMS, are measured by the proposed data acquisition hardware.
R (ω)
|Za(ω)|
Xc(ω) θ
0
v
i ωt
V I 2
s
θ
V I P
a v
2 cos(θ)
where:
P(ω) is a time invariant portion of s(ω,t),consumed by the EMI of the PZT patch, Eq. 11.
Figure 5. Phasorial representation of EMI.
Figure 6. Graphic representation of Eq. 10. V: amplitude of waveform υ(ω,t); I: amplitude of waveform i (w,t);
P
av: mean value of s(ω,t) = P (ω).
Combining Eqs. 8, 9 and 11 results in the very simple Eq. 12, which requires only two parameters to calculate R(ω).
Equation 12 requires a very low computational cost as compared to previous approaches and can be implemented in any microcontroller with low analog to digital sampling rates.
MEASURING EMI PARAMETERS
The instrumentation required to obtain P(ω) and I(ω) is very simple and can be illustrated by the block diagram presented in Fig. 7.
(8)
(9)
(10)
(11)
(12)
Working directly with the angle θ can lead to several measuring problems, thus reducing the precision in the calculation of R(ω). To overcome this problem, an alternative solution aiming at measuring the average power consumed by the PZT patch, P, is proposed.
Multiplying Eqs. 4 and 5, one obtains the instantaneous power waveform, s(ω,t) — Eq. (10). h e graphic representation of this multiplication can be seen in the Fig. 6.
From Fig. 7, an analogic multiplier circuit is used to obtain
s(ω,t) with high precision and stability at frequencies around 400 kHz. h e resulting time variant part of s(ω,t) is removed by using a second order low pass i lter (SOLPF) with a cut frequency less than 200 Hz. At last, I(ω) is directly measured through a small dedicated integrated circuit. Considering that the EMI properties of the PZT patch will not vary over the time during the measuring process, P(ω) and I(ω) will not vary over the time either. In this way, the data acquisition rate is no longer an issue. h us, the circuit can be signii cantly simplii ed, as well as the data analysis procedure, which is now reduced to Eq. 11.
COMPLETE ARCHITECTURE OF THE
PROPOSED SYSTEM
h e proposed architecture to measure the EMI of an array of PZT transducers is shown in Fig. 8. Hardware and i rmware are described in the following sections.
υ(t)
i(t) i(t) S(t)
SOLPF
RMS PEMI
REMI (ω) = PEMI (ω)
IRMS (ω)2
IRMS A
f [Hz]
P
EMI : power consumed by the electromechanical impedance; R
EMI : resistive part of the electromechanical impedance; A: amplitude.
HARDWARE ARCHITECTURE DESCRIPTION If a number of N PZT patches are bonded onto the structure, they cannot be analyzed simultaneously, since the mechanical excitation of a PZT transducer might inl uence the measurement of the others. Each PZT patch should be analyzed individually
and a switching system (SS) block is required to activate/
deactivate each transducer (Fig. 7).
Solid state analog digitally controlled switches (ADCS) are employed to switch the PZT array. Each one is capable of switching N digitally controlled outputs to a common input. h ree switches are required for each PZT channel in a configuration that compensates for the intrinsic non-linarites of each ADCS. ADCS1 provides the feedback for the high speed voltage follower (HSVF) for compensating for any non-linearity (in/out capacitances, series resistance etc.) and voltage drop over the shunt resistor and ADCS1. ADCS2 activates/deactivates the main line of each PZT patch. Finally, ADCS3 contains the response VR(ω,t) of the signal applied to each transducer circuit and measured at the respective shunt resistor.
A demultiplexer of x bits to N lines is used to decode the binary word that identii es each PZT channel on each ADCS. Commercial chips include this demultiplexer for a limited number of switches. When this number is not sui cient, an external
demultiplexer has to be added to the circuit. h e integrated circuit ADG406BNZ, from Analog Devices Inc., incorporates a 4 to 16 demultiplexer with 1 to 16 analog switches and was used in the prototype.
h e hardware that measures the required EMI parameters is concentrated on the signal conditioning and measurement (SCM) block (Fig. 8). h e i rst part of this hardware block is the sine wave generator, which is created by a direct digital synthesizer (DDS), AD9850, from Analog Devices. Amplitude and frequency of the excitation are provided to the DDS through a serial port interface (SPI) provided by the digital signal controller (DSC).
In general, i(ω,t) is not measured directly and a shunt resistor is used for this purpose. Figure 8 presents the equivalent simplii ed circuit used to measure the current of each PZT at an arbitrary channel.
h e circuit shown in Fig. 9 is commonly used in applications where several PZT patches are bonded to a metallic structure. h e voltage amplitude applied to the PZT patch is kept constant independently from the PZT impedance variation and the shunt resistor value. h e excitation signal VR(ω,t) is acquired by using the switch ADCS3, and the signal applied in each PZT patch,
Vex(ω,t), is collected by using the ADCS1 switch. Both signals converge to a dif erentiator, leading to VRshunt(ω,t), which is
Data visualization and long term storage
Program memory
Serial port interface
Paralell port interface
Demultiplexer x bits to N lines
x bits
Digital BUS
0 1
1 2
2 d0 d1 d2 dx 2x
2x 3
Core
RMS AD536 AD9850
HSVF DDS
+ –
Low pass filter
DSC Signal conditioning
and measurement
Switching system REMI(ω) =
PEMI(ω)
S(ω,t) A
f [Hz]
VRShunt(ω,t) VRShunt
RShunt
Vex(ω,t)
Vr(ω,t)
PEMI IRMS(ω)2
IRMS IPZT
IPZT
IPZT =
Two-channel AD converter USB
interface
AD0
AD1
... ...
...
...
0 1 2 N-1
ADCS1
S0
S1
S2
S4-1 3
... 0 1 23 N-1
... 0 1 23 N-1
ADCS2 Rshunt0
PZT0 PZT1 PZT2
PZT4-1 Rshunt1
S0
S1
S2
S4-1
ADCS3 S0
S1
S2
S4-1
AD: analog to digital.
High-speed voltage follower
V
ex(ω,t)
Vr(ω,t) I
PZT(ω,t)
V(ω,t)
V–
V+
7
˜
Out
– +
+
+
– 8
PZT
R
sh
un
t
the voltage drop in the shunt resistor. his value is used to calculate IPZT(ω,t). hus:
where:
Rshuntis the shunt resistor.
he system acquires the voltage and current signals varying in time and sends these two signals to an AD734 from Analog Devices, which is a chip that multiplies these two signals to obtain the apparent power, s(ω,t). Simultaneously, the efective current, IRMS, is obtained from an AD536A RMS-DC converter, also from Analog Devices.
he SOLPF eliminates the oscillatory component of the apparent power and isolates the average power consumed by the transducer.
FIRMWARE DESCRIPTION
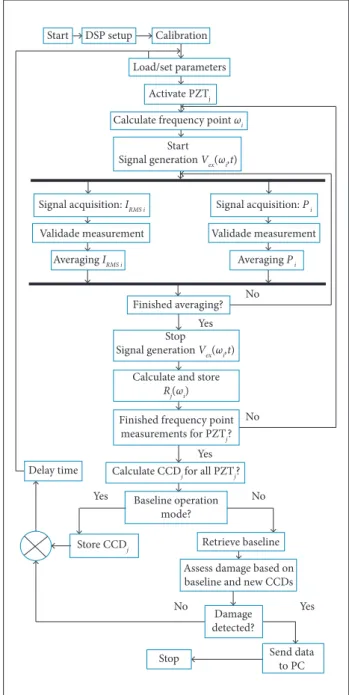
With a few parameters recorded directly on a lash memory or externally deined by a computer system through a USB connection, the developed firmware is intended to work standalone. he lowchart of the irmware code is presented in Fig. 10.
Initially, the DSP Setup step conigures the peripherals to work properly. hen, the Calibration step aims at correcting any non-linearity in the generation of Vex(ω,t) before any measurement is performed. Load/Set Parameters deines the operation mode (baseline or monitoring mode), the number j of PZT patches in the sensing network and the start/stop excitation frequency. In the “baseline mode”, the irmware obtains the baseline IS for each PZTj that are recorded in the lash memory. In the “monitoring mode”, new FIS are obtained and compared with the baselines. hen, the procedure Activated PZTj selects the next PZT patch to be considered, calculates frequency point ωi and deines the current excitation frequency. At this point, the whole system is ready to start the measurement phase. he procedure Start Signal Generation drives the selected PZTj with Vex(ω,t) during the measuring process. hen, the efective current IRMSi and the average power Pi are measured and averaged several times so that stable values are obtained. When the averaging process is
Figure 9. Partial circuit used to measure the PZT current.
Start DSP setup Calibration
Load/set parameters
Activate PZTj
Signal acquisition: IRMS i
Averaging IRMS i
Finished averaging?
Finished frequency point measurements for PZTj?
Calculate CCDj for all PZTj?
Store CCDj Delay time
Baseline operation mode?
Retrieve baseline
Assess damage based on baseline and new CCDs
Damage detected?
No
No
No
No Yes
Yes
Yes
Yes
Stop Send data
to PC Validade measurement Validade measurement
Signal acquisition: P i
Averaging P i Calculate frequency point ωi
Start Signal generation Vex(ωi,t)
Stop Signal generation Vex(ωi,t)
Calculate and store Rj(ωi)
Figure 10. Flowchart of the irmware.
(13)
(14)
inished, the real part of the PZT impedance is calculated and stored in the EEPROM memory.
he process is repeated to inally one obtain the real part of the electromechanical impedances (Rj) for all PZT patches. he inal operation assesses the damage based on the new CCDs and the baseline references. he process is repeated within a pre-deined time delay to continuously monitor the structure.
EXPERIMENTAL RESULTS
A prototype of the hardware was built to test and validate the proposed SHM system. For this purpose, experiments were conducted in two diferent structures to verify precision, stability, repeatability and capability of detecting structural modiications (simulated damage) in the studied structures. Two case studies were performed, as presented in the following sections.
CASE STUDY #1 – ALUMINUM BEAM
he goal of this irst experiment is to verify the accuracy and sensitivity of the prototype as compared with the HP4194A impedance analyzer, which is used as the reference system. Both measurement systems are conigured at the arbitrary frequency range of 100 to 110 kHz due to the number of peaks of impedance found in this range. Also, it was intended to reduce the sensitivity to external electrical noise.
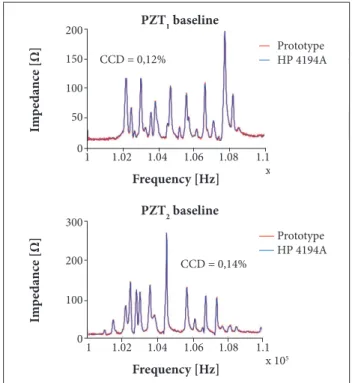
Using the same specimen studied by Finzi Neto et al. (2010) and presented in Fig. 11, a set of IS (containing 401 frequency points) for the patches named PZT1 and PZT2 was obtained by using both SHM systems, which are conigured to average each frequency point 1,024 times. The averaging process takes only 0.01 s for each frequency point.
he calculated CCD values quantify the diference between the reference IS (HP4194) and its counterpart obtained by the prototype. he results are presented in Fig. 12.
Qualitatively, it can be clearly seen from Fig. 12 that the IS from the prototype and the impedance analyzer, for each PZT
Figure 11. Aluminum beam used in the irst case study.
Frequency [Hz]
PZT2 baseline
Prototype
HP 4194A CCD = 0,14%
Im
p
ed
anc
e [Ω]
1 300
200
100
0
1.02 1.04 1.06 1.08 1.1
x 105
Frequency [Hz]
PZT1 baseline
Prototype
HP 4194A CCD = 0 ,1 2 %
Im
p
ed
anc
e [Ω]
1 1 5 0 2 0 0
1 0 0
5 0
0
1 .0 2 1 .0 4 1 .0 6 1 .0 8 1 .1 x 1 05
Prototype HP 4 1 9 4 A
Figure 12. IS obtained by the prototype and the impedance analyzer for the aluminum beam under pristine condition. patch, are almost identical. he low CCD damage index, for each PZT patch, quantitatively demonstrates that the prototype’s accuracy is high. his quality is essential to identify incipient damage such as the ones simulated in the next case study.
CASE STUDY #2 – AIRCRAFT PANEL
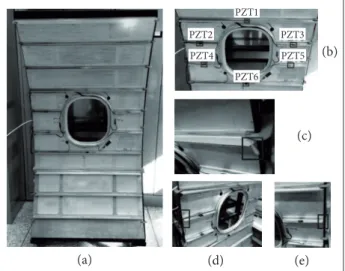
he goal of this second case study is to verify the sensitivity of the prototype to detect incipient structural modiications (damage) on a complex structure. In the aluminum aircrat panel presented in Fig. 13(a), an array of 6 PZT patches was mounted so that the patches were distributed on the support stringers of the structure as shown in Fig. 13(b).
To verify the capability and sensitivity to detect incipient damage (all simulated), four diferent structural states were considered. he methodology followed for this case study is described next:
I. BASELINE → Measurement and storage of the baseline IS of each PZT patch numbered from #1 to #6.
II. STATE 1 → Measurement and storage of the irst FIS with no structural modiications (pristine condition). his second measurement veriies the stability and precision of the process.
III. STATE 2 → Addition of a clip, Fig. 13(c), to simulate damage on the stringer where PZT #1 is located.
Figure 14. Results of PZTs #1 (a), #2 (b) and #3 (c) Corresponding CCD metric.
Frequency [Hz]
PZT3 – Impedance signature PZT3 – Metric CCD PZT2 – Metric CCD PZT1 – Metric CCD
Im
p
ed
anc
e [Ω]
D
amage ind
ex
[%]
D
amage ind
ex
[%]
D
amage ind
ex
[%]
200
2 3 4 5 0 1
1
0 .5
2
1.5 2.5
2 3 4
7 x10⁴
150
100
50
Frequency [Hz]
PZT2 – Impedance signature
Im
p
ed
anc
e [Ω] 200 250
2 3 4 5 6 7
x104
150
100
50
Frequency [Hz]
PZT1 – Impedance signature
Im
p
ed
anc
e [Ω] 150 200
2 3 4 5 6 7
x104
100
50
Baseline State 1 State 2 State 3 State 4
1 0 1 0.5 2
1.5 2.5
2 3 4
3 3.5
0 1
0.5 2
1.5
2 3 4
IV. STATE 3 → Removal of the clip, inserted on STATE 2, and the irst ixation clamp, Fig. 13(d), to simulate damage close to the stringer where PZT #2 is located.
V. STATE 4 → Removal of the second ixation clamp, Fig. 13(e), to simulate damage close to the stringer where PZT #3 is located.
The experiment was conducted at a controlled room temperature to avoid undesirable shit efects on the IS, as described by Baptista et al. (2012).
The frequency range applied to each PZT patch of the array is wider (20 – 70 kHz) than the one used in the previous case study, with a higher number of frequency points (2,000 points). his is required due to the diferent types and sizes of the simulated damage applied to the structure.
he test results are presented in Figs. 14 and 15. At STATE 1, no PZT patch presented a damage index higher than 0.3%, which was obviously expected, since no simulated damage was applied to the structure.
At STATE 2, the inclusion of the clip damage, Fig. 13(c), is mainly detected by PZT #1 with a damage index of 3.2%. he remaining PZT patches presented much lower damage indexes, which could be used to locate the irst simulated damage.
STATE 3 applied two modiications to the structure that STATE 1 did not. First, the removal of the clip is identiied by PZT #1 with the reduction of the damage index to less than 0.3%, which demonstrates stability on the measurements performed by the prototype. Second, the removal of the ixation clamp close to PZT #2 increased the damage indexes of all other PZT patches. his is mainly due to the severity of the induced damage considered.
Figure 13. (a) Aircraft aluminum panel used in the experiment; (b) Array of 6 PZTs; (c) Clip used to simulate damage on the stringer of PZT #1; (d) Removal of one clamp in the left-hand side of the stringer; (e) Removal of a second clamp on the opposite side of the stringer.
(a) (d) (e)
(b)
(c) PZT1
PZT3
PZT5
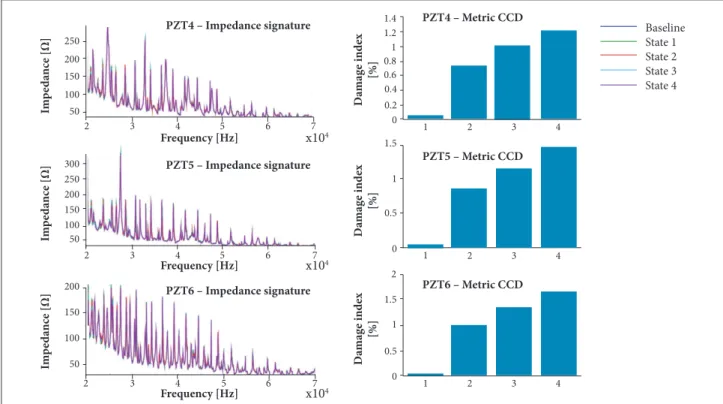
Figure 15. Overall results showing structural modiication interpreted by PZTs #4 (a), #5 (b), #6 (c).
Frequency [Hz]
PZT6 – Impedance signature PZT6 – Metric CCD PZT5 – Metric CCD PZT4 – Metric CCD
Im
p
ed
anc
e [Ω]
D
amage ind
ex
[%]
D
amage ind
ex
[%]
D
amage ind
ex
[%]
200
2 3 4 5 0 1
1
0.5 2
1.5
2 3 4
7 6
x104
150
100
50
Frequency [Hz]
PZT5 – Impedance signature
Im
p
ed
anc
e [Ω] 200250
300
2 3 4 5 6 7
x104
150
100
50
Frequency [Hz]
PZT4 – Impedance signature
Im
p
ed
anc
e [Ω] 200 250
2 3 4 5 6 7
x104
150
50 100
Baseline State 1 State 2 State 3 State 4
1 0 0.4
0.2 0.6 0.8 1 1.2 1.4
2 3 4
0 1
0.5 1.5
2
1 3 4
STATE 4 indicates the removal of the second fixation clamp, close to PZT #3. The corresponding damage index increased to 2.3%. The remaining PZT patches increased their damage indexes due to the severity of the induced damage. However, all these values are lower than those obtained by PZT #3, which could (possibly, but not necessarily) indicate the location of the induced damage.
The overall results indicate that the EMI technique presents high sensitivity to a variety of damage configurations in complex structures. Most importantly, the proposed SHM system is accurate and stable enough to detect these various types of damage.
CONCLUSION
This contribution presented an alternative EMI-based architecture for multiplexed piezoceramic sensors/actuators used in SHM applications. The proposed architecture offers stability, reliability, low cost, and scalability with no need of high speed DAH or specialized hardware. In the present study, only the CCD damage metric was used to assess damage in
the monitored structures. However, other damage metrics can be easily implemented in the microcontroller firmware.Then, together with a wireless communication system, the EMI technique can be used for in-service structural monitoring. It was shown that the impedance signals obtained from the prototype are similar to those obtained from a classical impedance analyzer. As the proposed architecture represents significant lower costs and leads to a small size SHM analyzer, it seems to be better suited both for industrial and on-board applications.
ACKNOWLEDGEMENTS
REFERENCES
Annamdas VGM, Soh CK (2010) Application of electromechanical impedance technique for engineering structures: review and future issues. J Intell Mater Syst Struct 21(1):41-59. doi: 10.1177/1045389X09352816
Baptista FG, Filho JV (2009) A new impedance measurement system for pzt-based structural health monitoring. IEEE T Instrum Meas 58(10):3602-3608. doi: 10.1109/TIM.2009.2018693
Baptista FG, Filho JV, Inman DJ (2012) Real-time multi-sensors measurement system with temperature effects compensation for impedance-based structural health monitoring. Structural Health Monitoring 11(2):173-186. doi: 10.1177/1475921711414234
Finzi Neto RM, Steffen Jr V, Rade DA, Gallo CA, Palomino LV (2010) A low-cost electromechanical impedance-based SHM architecture for multiplexed piezoceramic actuators. Structural Health Monitoring 10(4):391-402. doi: 10.1177/1475921710379518
Giurgiutiu V, Reynolds A, Rogers CA (1999) Experimental investigations of E/M impedance health monitoring for spot-welded structural joints, J Intell Mater Syst Struct 10(10):802-812. doi: 10.1106/N0J5-6UJ2-WlGV-Q8MC
Giurgiutiu V, Rogers CA (1997) The electro-mechanical (E/M) impedance method for structural health monitoring and non-destructive evaluation. Proceedings of the International Workshop on Structural Health Monitoring; Stanford, USA.
Giurgiutiu V, Xu B (2005) A low-cost and field portable electromechanical (E/M) impedance analyzer for active structural health monitoring. Proceedings of the 5th International Workshop on Structural Health Monitoring; Stanford, USA.
Giurgiutiu V, Zagrai A, Bao JJ (2002) Piezoelectric wafer embedded active sensors for aging aircraft structural health monitoring. Structural Health Monitoring 1(1):41-61. doi: 10.1177/147592170200100104
Koo K, Park S, Lee J, Yun C (2009) Automated impedance based structural health monitoring incorporating effective frequency shift for compensating temperature effects. J Intell Mater Syst Struct 20(4):367-377. doi: 10.1177/1045389X08088664
Liang C, Sun FP, Rogers CA (1994) Coupled electromechanical analysis of adaptive material systems – determination of the actuator power consumption and system energy transfer. J Intell Mater Syst Struct 5(1):12-20. doi: 10.1177/1045389X9400500102
Lopes Jr V, Park G, Cudney HH, Inman DJ (2000) Impedance-based structural health monitoring with artificial neural networks. J Intell Mater Syst Struct 11(3):206-214. doi: 10.1106/H0EV-7PWM-QYHW-E7VF
Mascarenas DL, Todd MD, Park G, Farrar CR 2007 Development of an impedance-based wireless sensor node for structural health monitoring. Smart Materials and Structures 16(6):2137-2145. doi: 10.1088/0964-1726/16/6/016
Overly TG, Park G, Farinholt KM, Farrar CR 2009 Piezoelectric active-sensor diagnostics and validation using instantaneous
baseline data. IEEE Sensors Journal 9(11):1414-1421. doi: 10.1109/JSEN.2009.2018351
Palomino LV, Steffen V (2009) Damage metrics associated with electromechanical impedance technique for SHM applied to a riveted structure. Proceedings of the 20th International Congress of Mechanical Engineering, COBEM 2009; Gramado, Brazil.
Park G, Cudney HH, Inman DJ (2000) An integrated health monitoring technique using structural impedance sensors. J Intell Mater Syst Struct 11(6):448-455. doi: 10.1106/QXMV-R3GC-VXXG-W3AQ
Park G, Inman DJ (2001) Impedance-based structural health monitoring, monograph. In: Woo SC, editor. Nondestructive testing and evaluation methods for infra-structure condition assessment. New York: Kluwer Academic Publishers. p. 35-38.
Park G, Kabeya K, Cudney HH, Inman DJ (1999) Impedance-based structural health monitoring for temperature varying applications. JSME Int J Ser A 42(2):249-258.
Park S, Lee JJ, Yun CB, Inman DJ (2008) Electro-mechanical impedance-based wireless structural health monitoring using PCA-data compression and k-means clustering algorithms. J Intell Mater Syst Struct 19(4):509-520. doi: 10.1177/1045389X07077400
Park G, Inman DJ (2005) Impedance-based structural health monitoring. In: Inman DJ, Farrar CR, Lopes Junior V, Steffen Junior V, editors. Damage prognosis: for aerospace, civil and mechanical systems. Chichester: Wiley. p. 275-292.
Peairs DM, Park G, Inman DJ (2004) Improving accessibility of the impedance-based structural health monitoring method. J Intell Mater Syst Struct 15(2):129-139. doi: 10.1177/1045389X04039914
Pitropakis I, Pfeiffer H, Wevers M (2012) Crack detection in aluminium plates for aerospace applications by electromagnetic impedance spectroscopy using flat coil sensors. Sensor Actuat A-Phys 176:57-63. doi: 10.1016/j.sna.2012.01.013
Raju V (1997) Implementing impedance-based health monitoring (Master’s thesis). Blacksburg, VA: Virginia Tech.
Rosiek M, Martowicz A, Uhl T, Stepinski T, Lukomski T (2010) Electromechanical impedance method for damage detection in mechanical structures. Proceedings of the 11th IMEKO TC 10 Workshop on Smart Diagnostics of Structures; Kraków, Poland.
Sun FP, Chaudry Z, Rogers CA, Majmundar M, Liang C (1995) Automated real-time structure health monitoring via signature pattern recognition. Proceedings of the SPIE; Italy.
Wang S, You C (2007) A circuit design for impedance-based structural health monitoring. J Intell Mater Syst Struct 19(9):1029-1040. doi: 10.1177/1045389X07083123