Smeared Crack Models for Reinforced Concrete Beams
by Finite Element Method
Modelos de Fissuração Distribuída em Vigas de Concreto
Armado pelo Método dos Elementos Finitos
R.C.G. MENIN a [email protected]
L.M. TRAUTWEIN b [email protected]
T.N. BITTENCOURT c [email protected]
a Grupo de Modelagem de Estruturas de Concreto / GMEC, Departamento de Engenharia de Estruturas e Geotécnica, Escola Politécnica da
Universidade de São Paulo / EPUSP, [email protected], Av. Prof. Almeida Prado tv.2, n.83 Cidade Universitária CEP 05508-900, São Paulo, Brasil;
b Grupo de Modelagem de Estruturas de Concreto / GMEC, Departamento de Engenharia de Estruturas e Geotécnica, Escola Politécnica da
Universidade de São Paulo / EPUSP, [email protected], Av. Prof. Almeida Prado tv.2, n.83 Cidade Universitária CEP 05508-900, São Paulo, Brasil;
c Grupo de Modelagem de Estruturas de Concreto / GMEC, Departamento de Engenharia de Estruturas e Geotécnica, Escola Politécnica da
Universidade de São Paulo / EPUSP, [email protected], Av. Prof. Almeida Prado tv.2, n.83, Cidade Universitária CEP 05508-900, São Paulo, Brasil.
Received 21 December 2008; Accepted 17 March 2009. Published 26 June 2009
Abstract
Resumo
The main goal of the present work is to present a comparison between two different strategies for the computational simulation of reinforced
concrete structures, both using smeared crack models to represent the behavior of the materials. As a irst approach, a multidirectional
smeared crack model available in DIANA has been adopted along with different softening rules for the cracked materials (brittle, linear, non-linear of Moelands-Reinhardt and Hordijk). Additionally, the Disturbed Stress Field Model – DSFM has also been adopted to model cracked
concrete as an orthotropic material with smeared rotating cracks. The inite element codes DIANA and VecTor2 have been used to evaluate the performance of the different smeared crack models to predict the behavior of reinforced concrete beams subjected primarily to lexure.
Keywords:smeared crack, reinforced concrete, inite element method.
O objetivo principal do trabalho é apresentar uma comparação entre distintas estratégias de simulação computacional de estruturas de
concreto armado utilizando modelos de issuração distribuída. Em uma primeira abordagem, foi adotado o modelo multidirecional de issuração distribuída do programa DIANA empregando-se diferentes regras de amolecimento para o material issurado (frágil, linear e
não-lineares de Moelands-Reinhardt e de Hordijk). Posteriormente, foi utilizada a formulação DSFM – Disturbed Stress Field Model,
mo-delando o concreto issurado como um material ortotrópico com issuras distribuídas do tipo rotacionais. Os programas DIANA e VecTor2 foram utilizados como ferramentas para avaliar a eicácia dos diferentes modelos no estudo de vigas de concreto armado submetidas a esforços de lexão.
1. Introduction
The reinforced concrete became one of the most important struc-tural materials in the last century, being widely used in different ar-eas of civil engineering. Due its low resistance to tensile stresses, the concrete structures suffer cracks even when they are subjected to low levels of load, which causes a reduction on their stiffness and modify the internal stress distribution, and as a result the struc-ture starts to present a non-linear behavior.
The crack modeling is a quite complex and intriguing topic for being associated to the discontinuity study in the displacement ield. In
the numerical simulation of reinforced concrete structures by Finite
Element Method, three different tendencies have been developed
to represent the cracks: discrete, smeared and incorporated. The discrete crack models are based on the idea of always work-ing with the portion of the solid which remains continuous and with-out any damages, so that during the formation or progression of an
existing crack, its sides incorporate to the outline of the solid. The cracks are modeled as displacement discontinuities among the i -nite elements and they must develop across their outlines, what ends up generating a restriction in its propagation direction. The application of these models is limited to the study of the problems involving the progression of few cracks, what hinders its use in most of the reinforced concrete structures.
In the smeared crack models, the cracked material is treated as
continuous, and the discontinuity of the displacement ield caused
by the crack is spread across the element by changing the con-stitutive equation. Despite the successful study of most of the
reinforced concrete structures, among the deiciencies of these models, it can be pointed out the dificulty in studying the localized
cracking situations, as well as the sensitivity problems concerning
the inite element mesh.
Later on, the incorporated crack models appeared which gather the favorable aspects of the previous two tendencies: there is no
need of a mesh redeinition (deiciency observed in the discrete model) and the results obtained are independent from the inite element mesh (deiciency of the smeared model). The models are
based on the concept of discontinuities incorporated in standard
inite elements.
2. Smeared crack models
Since it has begun to be used in reinforced concrete structures, the
Finite Element Method has shown more advantages by representing
the cracks through changes of the constitutive equations (smeared
models) instead of changes on the inite element mesh (discrete models). The irst analyses were based on the idea of fragile failure, that is, to make the material stiffness null in the direction of the maxi
-mum tensile stress when it exceeded the tensile strength.
Later on, it was observed that better results in the post-peak phase could be achieved by adopting a gradual reduction in the stress. In order to represent this behavior, the stress-strain diagram started
to be deined by experimental values and, thus, several models were proposed (Cedolin e Dei Poli [1], Bazant and Gambarova [2], Gupta and Maestrini [3], and Vecchio [4]).
Though successfully used to represent the behavior of the rein-forced concrete structures which presented a crack pattern well distributed, when used to simulate the behavior of structures in which a crack is predominant (plain concrete or deep beams), these
models presented some deiciencies. One of the deiciencies is the
sensitivity regarding the mesh, caused by the non-consideration of concepts associated to Fracture Mechanics. So, it was necessary to apply the Fracture Mechanics concepts directly over the con-crete structures analysis, creating a series of new models (Bazant
and Cedolin [5], Bazant and Oh [6], Feestra and de Borst [7]). Rots and Blaauwendraad [8] presented a comparative study be -tween the discrete and smeared crack models. This study
intro-duced the idea of dividing the smeared crack models into ixed and rotating. In the ixed model, the crack orientation is kept con -stant during the whole computational process, while in the rotating model the crack orientation may change, following the main direc-tions. There is also an intermediary option which is the concept of
multidirectional ixed smeared crack.
There are also the models based on the plasticity theory, which are able to represent well the pre-peak and post-peak phases, consist-ing of a constitutive model and a failure criterion. In this line it can be
pointed out the models by Ottosen [9] and Pramono and Willam [10].
3. Smeared crack models in DIANA
DIANA code – version 9.1 was used to evaluate the performance of different smeared crack models. DIANA is a inite element soft -ware based on the displacement method for non-linear analysis
of concrete structures, which has been developed since 1972 by
Delft University of Technology in Netherlands.
The smeared crack models are deined through the combination of
three factors: a failure criterion (constant or linear), the cut transfer through the crack (total, constant or variable) and the material soft-ening behavior (brittle, linear, multilinear or non-linear). In order to enable the combination of the crack model with a plastic behavior
of the material, the total strain, ε, is decomposed in two parts, one is the elastic strain, εe, and the other is the crack strain, εcr. In the
deinition of the constitutive model, a criterion for the beginning of
a new crack and its stress-strain relationship must still be estab-lished.
For the beginning of a new crack, two pre-requirements are
neces-sary: the principal stress must exceed a limit stress; and, in case there is a previous crack, the angle between the existing crack and the principal tensile stress must exceed the initial crack angle. Re -garding the constitutive model, the stress-strain relationship in the
normal direction of the crack may be expressed by:
where, ftis the concrete tensile strength and the variable y is the function that represents the material softening diagram. The
ulti-mate strain εultis assumed to be constant, and it may be obtained
from the concrete tensile strength ft, the fracture energy Gf, and the element area (represented by its equivalent length h):
(1)
( )
=
ult cr
t cr cr
y
f
ε
ε
ε
σ
(2)
=
t f
ult
hf
G
α
• Constant: it admits a constant value of the tensile strength and
considers the beginning of a crack if the maximum principal tensile stress exceeds the concrete tensile strength.
• Linear: it admits a linear variation and considers the beginning of new cracks, if the principal tensile
stress exceeds the minimum value between ft and
ft (1+σlateral / fc), in which σlateral is the principal lateral
stress and fc is the concrete compressive strength. In the smeared crack models, it is adopted a reduction parameter
β for the transverse stiffness of the material known as “shear reten-tion factor”. Thus, the shear stiffness may be expressed by:
The parameter β may range from 0 to 1. For values next to zero,
it is achieved a very small concrete shear stiffness and in the
op-posite case, for the unitary value it is obtained an ininite shear
stiffness that will prevent the formation of cracks in this direction. Following the recommendations found in the literature, in the
nu-merical examples analyzed in this work it was adopted β = 0.2. In the multidirectional smeared crack model it is possible to adopt a plasticity criterion for the material: Tresca, von Mises, Mohr-Cou-lomb or Drucker-Prager, and to choose the concrete tensile behav-ior in the softening branch. Among the different softening rules of the material available in DIANA it can be pointed out: brittle, linear, and non-linear by Moelands-Reinhardt and Hordijk, according to
Figure 1.
The brittle behavior is characterized by the total reduction of stress after the failure criterion has been achieved. This behavior may be
described by the following expression:
In the case of the linear softening model, the stress-strain
relation-ship in the crack is deined by the following expression:
Two other non-linear models may still be adopted. The softening model by Moelands-Reinhardt uses a non-linear relationship
be-tween stresses and strains expressed in the following equation, with the coeficient c1 taking the constant value of 0.31:
The other non-linear model present in DIANA is the model by Hordijk
which uses an exponential relationship between the normal tensile
where:
The fracture energy Gf may be calculated in two ways: the irst
one based on the model code CEB-FIP [11] and the second based
on the laws of the softening and hardening branches of concrete. Another possibility is to use the hardening-softening laws with rheological models originated from the plasticity theory. Among the smeared crack models available in DIANA, it may be pointed
out: ixed, multidirectional and rotating models. In the present
work just the multidirectional smeared crack models were used.
3.1 Multidirectional smeared crack models
The multidirectional smeared crack models are known for
pre-senting an intermediary behavior between the ixed and rotating
models. These models allow the propagation of several cracks at
the same point and according to the deinition of the parameter called “threshold angle”, a ixed or rotating model may be ob
-tained. This parameter represents the angle between an existing
crack and another one formed at the same point and its standard
value is 60º. If this parameter is changed to 90º, a ixed model is obtained and if changed to 0º a rotating model is obtained. In the present work, it was used the standard value deined by DIANA.
The multidirectional models present some differences in relation
to the ixed models, among which it may be pointed out: different
concrete models for tensile stresses, an option to decrease or not the transverse stiffness and the possibility to use constitu-tive models originated from the plasticity theory. The behavior of
the concrete subjected to tensile stresses may be deined in two
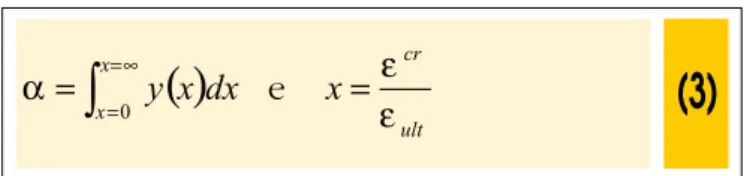
different forms: constant or linear:
(3)
( )
∫
==∞=
x xdx
x
y
0α
e
ult crx
ε
ε
=
Figure 1 – Material softening models – DIANA
σcr σcr
σcr
σcr
εcr εcr
εcr
εcr
ft ft
ft ft
εult εult
εult εult
Gf/ h Gf/ h
Brittle Linear
Hordijk Moelands & Reinhardt
(4)
G
D
β
β
−
=
1
sec(5)
( )
∞
<
<
→
≤
→
=
cr cr t cr crf
ε
ε
ε
σ
0
0
0
1
(6)
( )
∞
<
<
→
≤
<
→
−
=
cr ult ult cr ult cr t cr crf
ε
ε
stresses and strains, with the coeficients c1 and c2 taking,
respective-ly, the values of 3.0 and 6.93, according to the following equation:
The multidirectional model available in DIANA is characterized for modeling the material combining a smeared crack model (brittle,
linear, exponential,...) with a plastic model for compression, in
which it is possible to use the classical failure models by Tresca,
Von Mises, Mohr-Coulomb and Drucker-Prager.
The constitutive model for the reinforcement is the perfect elas-to-plastic. By adopting this model, the reinforcement stress may
be determined by the equations (9) and (10), where fy is the yield stress, Es is the elastic module and εs is the reinforcement strain:
4. Smeared crack models in VecTor2
VecTor2 is a inite element software used in the analysis of
two-dimensional reinforced concrete structures which has been
devel-oped at the University of Toronto since 1990. The software devel
-opment has been happening parallel to a series of experimental
tests, in order to better predict the behavior of a variety of rein-forced concrete structures.
The theoretical bases of VecTor2 are the MCFT – Modiied Com
-pression Field Theory, developed by Vecchio and Collins [12] and DSFM – Disturbed Stress Field Model, developed later by Vecchio [4]. These formulations are analytical models to predict the response
of reinforced concrete elements, representing the cracked concrete as an orthotropic material with rotating smeared cracks. The main concepts of the MCFT and DSFM formulations will be addressed in
the next sections.
4.1 Modiied Compression Field Theory (MCFT)
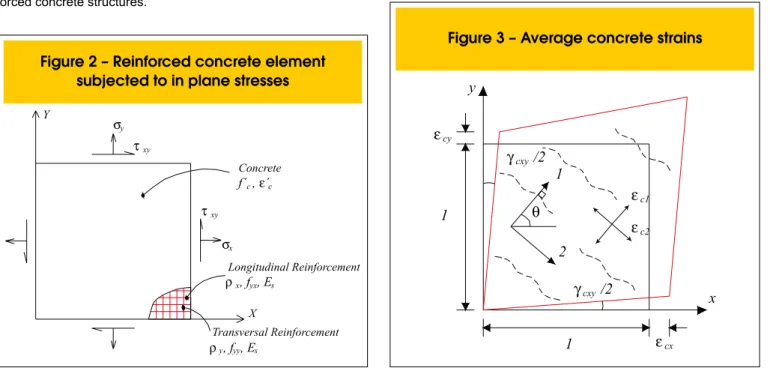
The MCFT is an analytical model to represent the behavior of two-di-mensional reinforced concrete structures discretized by membrane ele-ments subjected to normal and shear stresses, as shown in Figure 2. This formulation evaluates the average stresses and strains (in the region between the cracks) and the local stresses and strains of the concrete and reinforcement, as well as the widths and orienta-tions of the cracks during the loading and, based on this informa-tion, the failure mode of the element can be determined.
The modeling of the cracked concrete element is performed by us-ing an orthotropic material and a rotatus-ing smeared crack model. In other words, the cracked concrete is treated like a continuous medium with cracks smeared across the membrane element. The smeared cracks may suffer changes in their directions always
re-maining linked to the direction changes in the principal stress ield.
The MCFT is based on three groups of relationships: compatibil-ity relationships for the average strains in the concrete and
rein-forcement; equilibrium relationships for the average stresses in the concrete and reinforcement; and the constitutive relationships
for the cracked concrete and reinforcement. Among the hypoth-eses admitted in the MCFT formulation, it may be pointed out: the
uniformly distributed reinforcement; uniformly applied shear and normal stresses; perfect bond between the concrete and the rein
-forcement; uniformly distributed and rotating cracks; and the orien -tation of principal stress and strain are the same.
(8)
( )
( )
( )
∞ < < →
≤ < → − + − −
+ =
cr ult
ult cr
ult cr
ult cr
ult cr
t cr cr
c c c
c f
ε ε
ε ε ε
ε ε ε ε
ε ε
σ
0
0 exp 1 exp
1 2
3 1 2
3
1
Figure 2 – Reinforced concrete element
subjected to in plane stresses
X Y
σy
σx τxy τxy
Concrete f´c,ε´c
Longitudinal Reinforcement
ρx, fyx, Es
Transversal Reinforcement
ρy, fyy, Es
(9)
s s
s
E
ε
σ
=
±
if
y s
y
ε
ε
ε
≤
≤
−
(10)
y s
=
±
f
σ
if
ults s
y
ε
ε
ε
≤
≤
or
y s ult
s
ε
ε
ε
≤
≤
−
−
Figure 3 – Average concrete strains
1
ε
cyε
cx1
1
2
θ
x
y
ε
c1ε
c2γ
cxy/2
4.1.1 Compatibility relationships in the MCFT
The compatibility relationships in the MCFT are achieved from the average strains in the components which represent the concrete
and the reinforcement, according to Figure 3. Based on the perfect bond hypothesis, the average strains in the concrete (εc) are equal
to the average strains in the reinforcement (εs). Although any
num-ber of components and reinforcement orientations may be consid-ered in the MCFT formulation, considering the membrane element orthogonally reinforced of Figure 2, the compatibility equations
may be expressed by:
With a value for the shear strain γxy, it is possible to obtain the
aver-age principal concrete tensile strain (εc1) and the average principal
concrete compressive (εc2), as well as the orientations of the
aver-age principal tensile strain and stress axes using Mohr’s circle:
4.1.2 Equilibrium relationships in the MCFT
Considering the free body diagram of the membrane element
shown in Figure 4, through the balance of forces in the x and y
directions, the results of the normal stresses applied in panel σx e
σy must be balanced by the normal stresses in the concrete fcx and
fcy and by the stresses in the reinforcement fsx e fsy.
The balance of moments requires that the shear stress applied to the panel, represented by τxy, to be totally resisted by the average shear stress in the concrete τcxy, assuming that the reinforcement does not present any kind of dowel action. Thus, these equilibrium
relationships for the average stresses may be expressed by the following equations, where ρsx and ρsy are the reinforcement ratios
in the x and y directions:
Since the cracked concrete is orthotropic with respect to the
direc-tions of the principal stress, Mohr’s circle can be used to relate
the average concrete stresses fcx and fcy, to the average principal concrete tensile stress fc1:
4.1.3 Constitutive relationships in the MCFT
A set of thirty panels measuring 890x890x70 mm was tested ex -perimentally and the results were analyzed to develop constitutive models able to represent the behavior of the cracked concrete in compression and tension.
The constitutive relationship to describe the concrete in
com-(11)
sxcx
x
ε
ε
ε
=
=
(12)
sycy
y
ε
ε
ε
=
=
Figure 4 – Free body diagram of the
reinforced concrete element
fc
xθ
f
c21
f
syf
sxτ
cxyx
σ
yσ
xτ
x yτ
xyf
c1y
f
cy2
(13)
(
) (
[
)
]
0.52 2
2 1
2
1
.
2
1
,
c x y x y xyc
ε
ε
ε
ε
ε
γ
ε
=
+
±
−
+
(14)
−
=
=
=
−y x
xy
ε
ε
γ
θ
θ
θ
ε σ 1tan
.
2
1
(15)
sxsx cx
x
f
ρ
f
σ
=
+
(16)
sysy cy
y
f
ρ
f
σ
=
+
(17)
cxy
xy
τ
τ =
(18)
( )
θ
τ
tan
1 cxy
c
cx
f
f
=
−
(19)
( )
θ
τ
.
tan
1 cxy
c
cy
f
pression relates the principal compressive stress, fc2, to the
principal compressive strain, εc2. The tests with the panels
have indicated that the compressive strength and stiffness
suffered reductions as the principal tensile strain, εc1
in-creased. This phenomenon, known as compression softening is incorporated through the stiffness reduction in the stress-strain curve of the concrete:
The term which appears in the numerator is the Hognestad’s parabolic relationship, obtained for the concrete subjected to the uniaxial com
-pression, generally used for normal strength concrete. The value ε0
corresponds to the strain associated to the peak stress of the concrete
fc’, as determined experimentally from uniaxial compression tests of
concrete cylinders. The denominator relects the softening effect. With regards to concrete in tension, it is irst necessary to deter
-mine the values of the uniaxial cracking strength of the concrete,
ft’, and its corresponding tensile strain, εcr, which may be obtained
through the following expressions:
where Ec is the initial tangent stiffness of the concrete, estimated
by the following expression:
It is admitted that before cracking, the concrete presents a linear-elastic be-havior in tension. Therefore, after cracking, tensile stresses may continue
to exist in the concrete between the cracks due to bond interactions be -tween the concrete and reinforcement. To model this phenomenon known as tension stiffening, the MCFT proposed the following relationship:
For the reinforcement in compression and tension, the MCFT uses a bilinear relationship to relate the average stress and strain, in the same way it had been done with the crack model in DIANA.
where Es is the elastic module and fsyield is the yield stress of the
reinforcement.
(20)
(
) (
)
(
)
(
1 0)
2 0 2 0 2 2
/
34
.
0
8
.
0
/
/
2
'
ε
ε
ε
ε
ε
ε
c c c
c c
f
f
−
−
=
Figure 5 – (a) Average stresses between cracks and (b) local stresses at crack free surface
σ
yσ
xτ
xyf
syf
sxx
y
2
1
θ
f
c1(a)
σ
yσ
xf
scryf
scrxx
y
2
1
θ
θ
ni
τ
ci(b)
τ
xy(21)
'
33
.
0
'
ct
f
f
=
(MPa)
(22)
c t cr
E
f
'
=
ε
(23)
'
5000
cc
f
E
=
(MPa)
(24)
1
1 c c
c
E
f
=
ε
for 0
<
ε
c1≤
ε
cr(25)
11
200
1
'
c t c
f
f
ε
+
=
for
ε
c1>
ε
cr(26)
yield
s s s
s
E
f
4.1.4 Local crack conditions in the MCFT
Given a compatible average strain condition, the constitutive
relationships can be used to determine the average stresses in the concrete and reinforcement, as well as the normal and shear stresses acting on the structure. However, it would be unconserva-tive to disregard the possibility that the response of the structure may be guided by the local yielding of the reinforcement at the crack or sliding shear failure along a crack. To cover these possi-bilities, the MCFT limits the local stresses at the crack and average tensile concrete stress.
The stress ield in the reinforced concrete suffers variations when
evaluated according to the average values in the area between the cracks and when evaluated locally at the crack. This behavior
can be better understood considering Figure 5(a), which depicts
the average stresses in a section located between cracks, and
Figure 5(b), which depicts the local stresses at the free surface
of the crack.
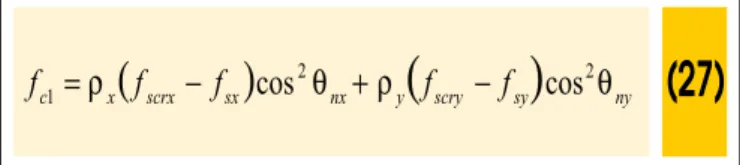
At a free surface of the crack, the average concrete tensile stresses are practically reduced to zero. Consequently, to transmit the average tensile stresses across the crack, the stresses and strains in the reinforcement must increase locally at the crack. Static equivalence between the average and local stresses in the normal direction to the crack surface, results in the following relationship:
where fscrx and fscry are the local reinforcement stresses at a crack,
and θnx and θny the values of the angles between the normal to the
crack and the reinforcement. Considering the equation (27), the
average tensile concrete stress must be limited by the yielding of the reinforcement at the crack and consequently:
As a principal plane, the shear stress is absent and thus, they do
not appear in Figure 5(a). However, as the reinforcement generally
crosses the cracks at a skew angle, the local shear stresses, τci will be present on the crack surface. Consequently, through the static equivalence of the average and local stresses in the tangential di-rection to the surface of the crack, the local shear stresses can be determined by the following equation:
However, the local shear stress is limited by the aggregate interlock mechanism, which decreases with the increase of the crack width (w) and with the reduction of the size of the aggregated (a). Based on the analysis of the aggregate interlock mechanisms developed
by Walraven [13], the MCFT establishes a limit for the shear stress
on the crack:
4.2 Disturbed Stress Field Model (DSFM)
The DSFM is an extension of the MCFT, with the purpose of treat
-ing the MCFT deiciencies. For example, in lightly reinforced ele
-ments, in which the shear slip along the crack is more expressive, the rotation of the stress ield tends to present a certain discrep
-ancy concerning the rotation of the strain ield. In these cases, the
stiffness and strength end up being overestimated by the MCFT, which assumes the orientations of the principal stress and strain are the same. On the other hand, in elements which present small
rotations in the stress and strain ields, the MCFT generally under -estimates the shear stiffness and strength.
The DSFM is conceptually similar to the MCFT, however, it ends up
extending the MCFT in several aspects. Primarily, the DSFM en -larges the compatibility relationships of the MCFT to include crack shear slip. Furthermore, the DSFM decouples the orientation of the
principal stress and strain ields. By explicitly calculating crack slip
deformations, the DSFM eliminates the need to check the shear
stress. Modiications in the calculation of the constitutive relation -ships for the concrete and reinforcement are also presented.
4.2.1 Compatibility relationships in the DSFM
Although the MCFT admits that the orientations of the principal
stress-es and strains remain the same, experimental tstress-ests indicate that this hypothesis is not always valid after the crack. The experimental re
-sults show that the principal strain ield generally suffers modiications in its orientation at a larger rate than in the principal stress ield.
Figure 6 – Deformations due to crack shear slip
y
θ
1
2
w
δ
ss
x
(27)
(
scrx sx)
nx y(
scry sy)
ny xc
f
f
f
f
f
ρ
θ
ρ
θ
2 2
1
=
−
cos
+
−
cos
(28)
(
sxyield sx)
nx y(
syyield sy)
nyx
c
f
f
f
f
f
ρ
θ
ρ
θ
2 2
1
≤
−
cos
+
−
cos
(29)
(
scrx sx) ( ) ( )
nx nx y(
scry sy) ( ) ( )
ny ny xci
ρ
f
f
θ
θ
ρ
f
f
θ
θ
τ
=
−
cos
.
sin
+
−
cos
.
sin
(30)
(
26
)
/
24
31
.
0
'
18
.
0
+
+
≤
a
w
f
c ci
This phenomenon is attributable to the manner by which the stress
and strain ields are determined. The measured strains are total
strains, which are obtained by the sum of the average strains in cracked concrete (Figure 2) and the shear strains, caused by
slip-ping across the crack, as shown in Figure 6.
In order to represent this behavior, the DSFM deines the total strains, εx, εy and γxy as the sum of the net concrete strains, εcx, εcy
and γcxy, and the strains due to shear slip, εxs, ε y
s and γ xy
s.
The principal net concrete tensile strain (εc1) and principal
net concrete compressive strain (εc2) may be evaluated using
Mohr’s circle:
The crack slip shear components, εx s, ε
y s and γ
xy
s, can be calculated
from the average crack slip shear strain γs. This strain is equal to
the slip in the crack, δs, divided by the average space between the
cracks, s, according to the following expression:
The orientation of the principal net concrete strains, θ, and the ori
-entation of the principal concrete stress, θσ, with respect to the x axis can be determined from Mohr’s circle with the components of
the net concrete strain as follows:
Likewise, the orientation of the principal total strain ield, θε, can be determined from the components of the total strain:
Although in the DSFM, it is possible to use any number of rein-forcement components and orientations, considering the orthogo-nally reinforced membrane element and assuming perfect bond, the average strains in the components of the reinforcement in the
x and y directions will be equal to the total strains:
4.2.2 Equilibrium relationships in the DSFM
Considering again an orthogonally reinforced membrane element, the equilibrium relationships of the DSFM are the same determined previously for the MCFT, that is:
(31)
sx cx
x
ε
ε
ε
=
+
(32)
sy cy
y
ε
ε
ε
=
+
(33)
s xy cxy
xy
γ
γ
γ
=
+
(34)
(
) (
[
)
]
0.52 2 2 1
2
1
.
2
1
,
c cx cy cx cy cxyc
ε
ε
ε
ε
ε
γ
ε
=
+
±
−
+
(35)
s
s sδ
γ =
(36)
( )
( )
( )
−
=
=
θ
γ
θ
γ
θ
γ
γ
ε
ε
ε
2
cos
.
2
sin
.
2
1
2
sin
.
2
1
s s s s xy s y s x s(37)
−
=
=
− cy cx cxyε
ε
γ
θ
θ
σ 1tan
.
2
1
(38)
−
=
− y x xyε
ε
γ
θ
ε 1tan
.
2
1
(39)
x sxε
ε =
(40)
y syε
ε =
(41)
sx sx cxx
f
ρ
f
σ
=
+
(42)
sysy cy
y
f
ρ
f
σ
=
+
(43)
cxy
xy
τ
Similarly, the DSFM formulation also incorporates the equilibrium relationships for the local stresses at the crack:
It is worthy pointing out that the average concrete tensile stress must be limited by the yielding of the reinforcement traversing the crack:
However, unlike the MCFT, the tensile stress is not subjected to the limitation of the shear stresses at a crack, since the DSFM incor-porates deformations due to shear slip, instead of imposing a limit stress corresponding to the shear slip failure.
4.2.3 Constitutive relationships in the DSFM
The experimental analysis of a series of reinforced concrete pan
-els led Vecchio and Collins [12] to propose a reduction factor, βd, in
order to relect the softening effect of the concrete and its connec -tion to the principal tensile strain.
In this equation, the softening effect of transverse tensile strains is taken into account by factor Cd, deined by:
The factor Cs determines if the analysis of the element will take into account slip deformations. If the analysis does not consider the slip deformations, as in the MCFT, then factor
Cs = 1.0. If the analysis considers element slip distortions, as in the DSFM, then the softening effect appears to be less for
the same value of the relationship εc1/εc2 since the softening
effect is attributed only to the tensile strains and in this case,
Cs = 0.55.
In order to consider the concrete softening effect, the concrete cyl-inder strength fc’, and its corresponding strain peak, εc’, are both reduced:
With regards to the constitutive models to simulate the behavior
of the concrete in tension, it is admitted that the response before crack is linear-elastic and for cracked concrete the average con-crete tensile stresses, fc1a, due to tension stiffening, may be
mod-eled by a nonlinearly decaying relationship:
The coeficient ct incorporates the inluence of the reinforcement bond
characteristics and can be determined by the following equation:
where dbi is the bar diameter and ρi is the reinforcement ratio of each of the n reinforcement components. In the DSFM, a trilinear constitutive model for reinforcement in tension or compression is used to account for strain-hardening phenomenon:
(44)
(
scrx sx)
nx y(
scry sy)
ny xc
f
f
f
f
f
ρ
θ
ρ
θ
2 2
1
=
−
cos
+
−
cos
(45)
(
scrx sx) ( ) ( )
nx nx y(
scry sy) ( ) ( )
ny ny xci
ρ
f
f
θ
θ
ρ
f
f
θ
θ
τ
=
−
cos
.
sin
+
−
cos
.
sin
(46)
(
sxyield sx)
nx y(
syyield sy)
nyx
c
f
f
f
f
f
ρ
θ
ρ
θ
2 2
1
≤
−
cos
+
−
cos
(47)
0
.
1
1
1
≤
+
=
d s d
C
C
β
(48)
(
)
0.82
1
/
0
.
28
35
.
0
−
−
=
c c d
C
ε
ε
(49)
'
.
c d
p
f
f
=
−
β
(50)
'
.
c d
p
β
ε
ε
=
−
(51)
1
1 c c
c
E
f
=
ε
,
cr c
ε
ε ≤
≤
1
0
(52)
11
1
'
c t t a
c
c
f
f
ε
+
=
,
cr
c
ε
ε >
1
(53)
m
c
t=
2
.
2
(54)
ni n
i bi
i
d
m
θ
ρ
cos
4
1
1
∑
=
=
(mm)
(55)
ss s
E
f
=
ε
,
syield s
ε
ε ≤
<
0
(56)
syield
s
f
where Es is the elastic module; fsyield is the yield strength of the
re-inforcement; εsyield is the yield strain of the reinforcement; εsh isthe
strain at the onset of strain hardening; and εu is the ultimate strain
of the reinforcement.
4.3 Composite material stiffness matrix
The composite material stiffness matrix is the sum of the concrete material stiffness matrix Dc and the reinforcement component ma-terial stiffness matrices Dsi:
As the MCFT and DSFM model the reinforced concrete element as an orthotropic material in the principal stress direction, it is
neces-sary to formulate the concrete material stiffness matrix relative to
these directions, Dc’. Assuming that the Poisson’s effect is negli -gible, then Dc’ can be calculated by:
The secant modules are computed from the current values of the principal stresses fc1 and fc2 and the corresponding net concrete
strains εc1 and εc2:
Likewise, the reinforcement component matrices Dsi’ must be determined
initially relative to their longitudinal axes. Assuming that the reinforcement only resists to uniaxial stresses, the matrix Dsi’ can be determined by:
Afterwards, the material stiffness matrices Dc’ and Dsi’ initially
eval-uated relative to the principal axes are transformed to the x and y
axes by means of the transformation matrix:
5. Numerical examples
5.1 Simply supported reinforced concrete
beam – Leonhardt and Walther [14]
A set of four reinforced concrete beams (ET1, ET2, ET3 e ET4) ex
-perimentally analyzed by Leonhardt and Walther [14] will be stud -ied numerically using different smeared crack models in DIANA
and VecTor2. The beams are simply supported and submitted to vertical loads as shown in Figure 7.
The beams have the same amount of reinforcement but they have different core widths, what implies in different reinforcement ratios.
(57)
sh s sh syield
s
f
E
f
=
+
ε −
ε
,
ε
sh<
ε
s≤
ε
uFigure 7 – Reinforced concrete
beams (ET1, ET2, ET3 and ET4)
30 cm 30 cm 30 cm 30 cm
15 cm 10 cm 10 cm 5 cm
7.5 cm
17.5 cm
10 cm
ET1 ET2 ET3 ET4
20 cm 105 cm 45cm
5 11 P 35 cm A
(58)
∑
=+
=
n i 1 si cD
D
D
(59)
=
c c cG
E
E
0
0
0
0
0
0
'
2 1 cD
(60)
1 1 1 c c cf
E
=
ε
,
2 2 2 c c c
f
E
=
ε
,
2 1 2 1
.
c c c c cE
E
E
E
G
+
=
(61)
=
0
0
0
0
0
0
0
0
'
si i siE
ρ
D
(62)
si si sif
E
ε
=
(63)
c c T cc
T
D
T
D
=
.
'.
(64)
si si
T
si
si
T
D
T
D
=
.
'.
The longitudinal reinforcement at the bottom of the cross section consists of four bars with diameter of 20 mm and yield stress fy = 428 MPa. The longitudinal reinforcement at the top consists of two bars with diameter of 8 mm and yield stress fy = 465 MPa. The transverse reinforcement is represented by stirrups of 6 mm and yield stress fy = 320 MPa.
The concrete cube strength, achieved experimentally by Leon
-hardt and Walther [14], was fcub = 28.5 MPa. The corresponding values for the concrete cylinder strength (fc = 22.8 MPa), the con-crete cracking strength (ft = 1.57 MPa) and the initial elastic module (Eco = 23874.67 MPa) were determined from the concrete cube
strength, according to Vecchio and Collins [12].
The set of reinforced concrete beams was analyzed with smeared crack models, employing different softening rules from DIANA (brit-tle, linear, non-linear by Moelands-Reinhardt and Hordijk) and the plasticity criterion by von Mises, as well as using the DSFM from
VecTor2. The parameters used in the softening models are showed in Table 1. The perfect elasto-plastic behavior and elastic module
Es = 210000 MPa were considered for the reinforcements.
The inite element mesh used for modeling the concrete structure with 341 nodes and 300 rectangular elements is shown in Figure 8. Incorporated models were used in DIANA for the discretization of the reinforcement. On the other hand, VecTor2 used discrete
models for the longitudinal reinforcement and smeared models for the stirrups.
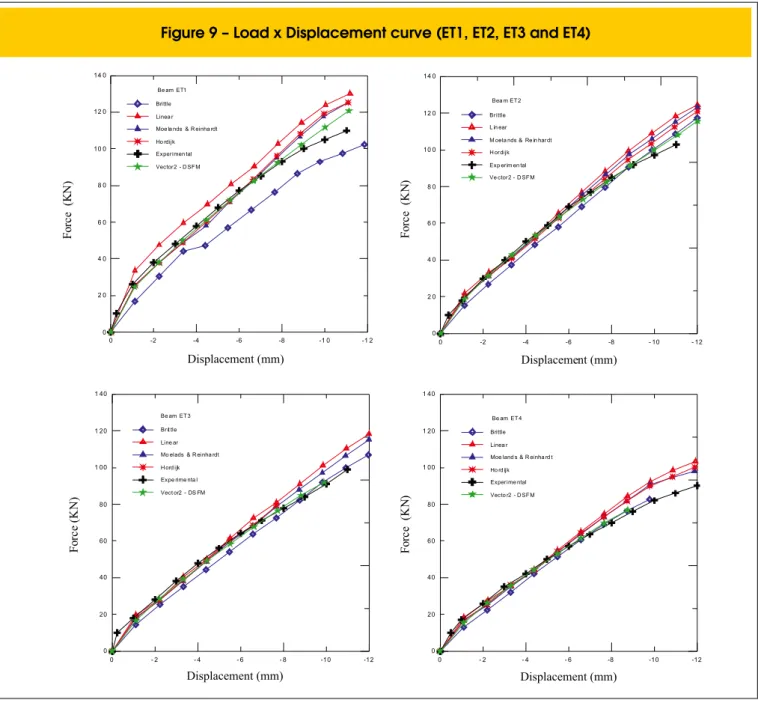
The vertical displacements of the beams at Point A (midspan) are shown in Figure 9. It can be observed that the load x dis-placement curves achieved with the different models present a
great concordance with the experimental results. In general, the
computational models presented a little higher stiffness than the
experimental results.
The additional stiffness associated to the consideration of perfect bond and the contribution of concrete between cracks is more
sig-niicant for smaller reinforcement ratios. The beam ET1 (with the
smaller reinforcement ratio) presented the biggest discrepancy
to the experimental results. The discrepancy between numerical and experimental models was less signiicant in the beams with higher reinforcement ratios (ET2, ET3 and ET4), as according to d’Avila [15].
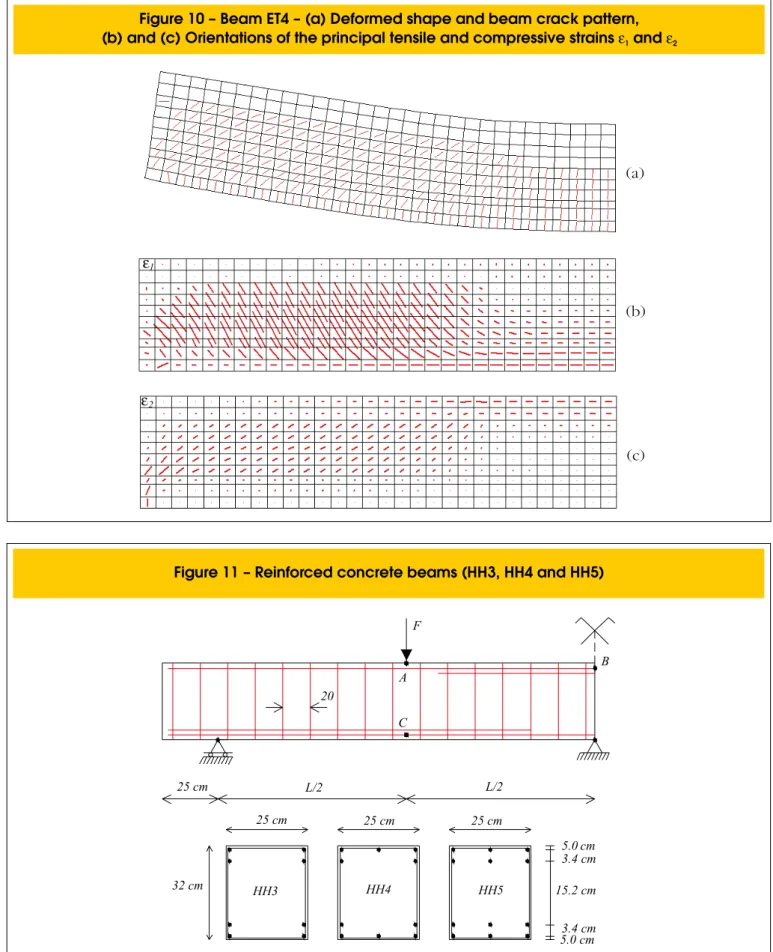
To better understand the behavior of the beams and their
col-lapse mechanisms, it is shown in Figure 10, the crack pat
-tern and the orientations of the principal tensile strains ε1 and
principal compressive strain ε2 of the beam ET4 for a load
P=76.8 KN.
5.2 Continuous reinforced concrete
beam – Leonhardt and Walther [16]
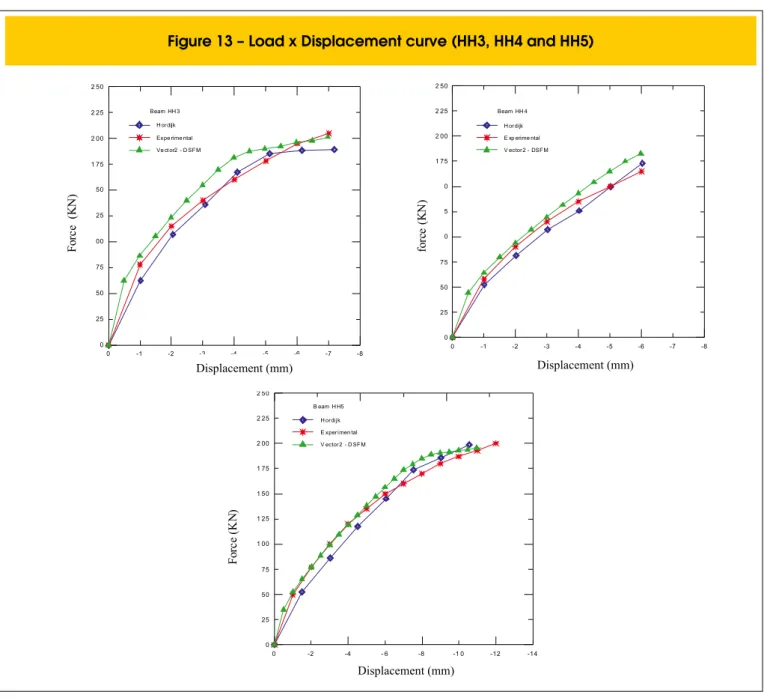
A set of three reinforced concrete beams (HH3, HH4, and HH5) tested experimentally by Leonhardt and Walther [16] will be an -alyzed using a smeared crack model with the softening rule by Hordijk and the plasticity criterion by von Mises in DIANA and also
with the DSFM in VecTor2. The beams have rectangular cross sec -tions (25 x 32 cm2), presenting different lengths and reinforcement
ratios, as shown in Figure 11.
The positive and negative longitudinal reinforcements are repre-sented by bars of 14 mm with yield stress fy = 417 MPa. The trans-verse reinforcements consist of stirrups of 8 mm with yield stress
fy = 371 MPa.
The length of the beams and their respective mechanical
prop-erties are shown in Table 2. Likewise the previous example, the
concrete cylinder strength, the concrete cracking strength and
Table 1 – Mechanical properties for cracked concrete
Property
Value
Softening Models
Shear Retention factor ( )
β
0.2
All DIANA models
Ultimate Strain( )
ε
u0.0003337
Linear
Fracture Energy (G )
f0.00068 KN/cm
Moelands-Reinhardt, Hordijk
Crack bandwidth (h)
17.32 cm
Moelands-Reinhardt, Hordijk
the initial elastic module were determined from the concrete cube
strength according to Vecchio and Collins [12].
The parameters adopted for the Hordijk’s model are showed in Table 3. The perfect elasto-plastic behavior and elastic module Es = 210000 MPa were adopted for the reinforcement.
The inite element mesh used for modeling the concrete struc
-ture with 369 nodes and 320 rectangular elements is shown in Figure 12. Incorporated models were used in DIANA for the dis
-cretization of the reinforcement. On the other hand, VecTor2 used
discrete models for the longitudinal reinforcement and smeared models for the stirrups.
The vertical displacements of the beams at Point A are shown in
Figure 13. The load x displacement curves achieved with the
dif-ferent models present a great concordance with the experimental
results. At the beginning of the loading process the computational
models presented a smaller stiffness than the experimental results, however, for the inal phase, this situation inverts and the com -putational models start to present a little higher stiffness than the
experimental results.
The additional stiffness in the computational models is caused by two factors: the consideration of the perfect bond and the contribu-tion of concrete between cracks, which was also observed in the
previous example.
For this series of continuous beams, it is also showed a compar-ison of the reinforcement stresses for the different models. The analyzed points are: under the load for the positive reinforcement (Point C) and at the central support for the negative reinforcement (Point B), as shown in Figure 14, indicating that the computational
models were able to evaluate properly the reinforcement stresses during the loading process.
Figure 9 – Load x Displacement curve (ET1, ET2, ET3 and ET4)
- 1 0 - 6
- 2 - 4 - 8 - 1 2
0
D i s p l a c e m e n t(m m ) 2 0
6 0 1 0 0 1 4 0
0 4 0 8 0 1 2 0
L
o
a
d
(
K
N
)
B e amE T1
B ri ttl e
Li nea r
Moe la nds& R ei nha rdt
Ho rdi j k
E x per i men tal
V ec tor 2- D S F M
- 1 0 - 6
- 2 - 4 - 8 - 1 2
0
D i s p l a c e m e n t( m m ) 2 0
6 0 1 0 0 1 4 0
0 4 0 8 0 1 2 0
L
o
a
d
(
K
N
)
B ea m E T 2
B r i ttl e
L in ear
M oel a nds&Re in har dt
H or di j k
E x p er im en tal
V e c tor 2 -D S F M
- 1 0 - 6
- 2 - 4 - 8 - 1 2
0 2 0 6 0 1 0 0 1 4 0
0 4 0 8 0 1 2 0
L
o
a
d
(
K
N
)
B e amE T 3
B r it tl e
Li ne ar
Mo el ads& R ei nha rdt
H ord i jk
E x pe ri me nta l
V ec t or2-DS FM
- 1 0 - 6
- 2 - 4 - 8 - 1 2
0 2 0 6 0 1 0 0 1 4 0
0 4 0 8 0 1 2 0
L
o
a
d
(
K
N
)
B e amE T 4
B ri ttl e
Li nea r
Moe l and s& R ei nha rd t
Ho rd ij k
E x per i me ntal
V ec to r2- D S F M
F
o
rc
e
(
K
N
)
F
o
rc
e
(K
N
)
F
o
rc
e
(
K
N
)
F
o
rc
e
(
K
N
)
Displacement (mm) Displacement (mm)
Figure 10 – Beam ET4 – (a) Deformed shape and beam crack pattern,
(b) and (c) Orientations of the principal tensile and compressive strains
ε
1and
ε
2ε
1ε
2(a)
(b)
(c)
Figure 11 – Reinforced concrete beams (HH3, HH4 and HH5)
F
B A
C 20
25 cm L/2 L/2
25 cm 25 cm 25 cm
32 cm
HH3 HH4 HH5
5.0 cm
5.0 cm 3.4 cm 3.4 cm
Table 2 – Mechanical properties of concrete
Beams
L (cm)
F
cub(MPa)
F (MPa)
cF (MPa)
tE (MPa)
c0HH3
211
37.1
29.68
1.80
27240
HH4
257
33.6
26.88
1.71
25923
HH5
300
36.3
29.04
1.78
26944
Table 3 – Parameters for the Hordijk model
Property
Value
Beams
Shear Retention factor ( )
β
0.2
HH3, HH4 e HH5
Fracture Energy (G )
f0.00068 KN/cm
HH3, HH4 e HH5
Crack bandwidth (h)
17.32 cm
HH3, HH4 e HH5
Figure 12 – Finite element mesh – 8x40
To better understand the behavior of the beams and their collapsemechanism, the crack pattern and the reinforcement stresses of
the beam HH5 for a load P=195.4 KN are shown in Figures 15 and 16.
6. Conclusions
The smeared crack models of DIANA and VecTor2 proved to be very eficient to analyze the reinforced concrete beams subjected
to bending. The load x displacement curvesobtained with the
differ-ent models presdiffer-ented a great concordance with the experimdiffer-ental
values. In general, the computational models presented a higher
stiffness than the experimental results. Among the causes of the
additional stiffness, it can be pointed out the concrete contribution
between cracks, which proved to be more signiicant for smaller re -inforcement rates and the hypothesis of perfect bond, since due to the non-consideration of the bond loss, it is natural that the cracked structure becomes stiffer. The selection of the material softening
rule showed to be more signiicant for smaller reinforcement ratios,
in which the brittle model presented the highest discrepancy with
respect to the experimental values.
The smeared crack models permitted to simulate the post-crack behavior of the reinforced concrete allowing to follow up the evo-lution of stresses and strains during the loading process and to obtain a crack pattern which enabled to better understand its
be-havior, as well as to follow up the stress evolutions and the yielding of the reinforcements.
7. Acknowledgments
The authors acknowledge the inancial support from FAPESP and Professor Frank Vecchio from University of Toronto for the release of the use license for VecTor2.
8. References
[01] Cedolin, L. e Dei Poli, S. Finite Element Studies of Shear-Critical R/C Beams. Journal of Engineering Mechanics Division, New York: ASCE, v.103, n.EM3, 1977; p.395-410.
[02] Bazant, Z.P. e Gambarova, P. Rough Cracks in Reinforced Concrete. Journal of the Structural Division, New York: ASCE, v.106, 1980; p.819-842. [03] Gupta, A.K. e Maestrini, S.R. Post-Cracking Behavior
of Membrane Reinforced Concrete Elements Including Tension-Stiffening. Journal of Structural Engineering. New York: ASCE, v.115, n.4, 1989; p.957-976.
of Structural Engineering, v.126, n.9, 2000; p.1070-1077.
[05] Bazant, Z.P. e Cedolin, L.Finite Element Modeling of Crack Band Propagation. Journal of Structural Engineering, New York: ASCE, v.109, n.1, 1983; p.69-92.
[06] Bazant, Z.P. e Oh, B.Crack Band Theory for
Fracture Concrete. Materials & Constructions, v.16, n.93, 1983; p.155-177.
[07] Feenstra, P.H. e de Borst, R. Constitutive Model for Reinforced Concrete. Journal of Engineering Mechanics, New York: ASCE, v.121, n.5, 1995; p.587-595.
[08] Rots, J.G. e Blaauwendraad, J. Crack Models for Concrete: Discrete or Smeared? Fixed, Multi- directional or Rotating? HERON, Delft, v.34, n.1, 1989.
Figure 13 – Load x Displacement curve (HH3, HH4 and HH5)
- 7 - 5
- 3
- 1 - 2 - 4 - 6 - 8
0
D i sp la ce m e n t ( m m ) 2 5
7 5 1 2 5 1 7 5 2 2 5
0 5 0 1 0 0 1 5 0 2 0 0 2 5 0
L
o
a
d
(
K
N
)
B eamHH 3 H or dij k E x pe ri me ntal V e ct or2- D S F M
- 7 - 5
- 3
- 1 - 2 - 4 - 6 - 8
0
D i sp la ce m e n t ( m m ) 2 5
7 5 1 2 5 1 7 5 2 2 5
0 5 0 1 0 0 1 5 0 2 0 0 2 5 0
L
o
a
d
(
K
N
)
B eamHH 4 H or di jk E xp eri me ntal V ec tor 2 -DS F M
- 1 4 - 1 0
- 6
- 2 - 4 - 8 - 1 2
0
D i s p l a c e m e n t ( m m ) 2 5
7 5 1 2 5 1 7 5 2 2 5
0 5 0 1 0 0 1 5 0 2 0 0 2 5 0
L
o
a
d
(
K
N
)
B eamH H5 H or di j k E x per i men tal V ec tor 2- D S F M
F
o
rc
e
(
K
N
)
Displacement (mm)
fo
rc
e
(
K
N
)
Displacement (mm)
F
o
rc
e
(K
N
)
Displacement (mm)
[09] Ottosen, N.S.Material Models for Concrete, Steel
and Concrete-Steel Interaction. Bulletin d’Infornation,
n.194, Lausane: CEB, 1988.
[10] Pramono, E. e Willam, K. Fracture Energy-Based Plasticity Formulation of Plain Concrete. Journal of Engineering Mechanics, New York: ASCE, v.115, n.6, 1989; p.1183-1204.
[11] COMITÉ EURO-INTERNATIONAL DU BÉTON. CEB-FIP Model Code 1990, Bulletin d’Information n.213/214, Lausane: CEB, 1993.
[12] Vecchio, F.J. e Collins, M.P. The Modiied Compression Field Theory for Reinforced Concrete Elements Subject to Shear, ACI Journal, v.83, n.2, 1986; pp. 219-231. [13] Walraven, J.C. Fundamental Analysis of Aggregate
Figure 14 – Reinforcement Stresses (HH3, HH4 and HH5)
(a)negative reinforcement –HH3, (b)positive reinforcement – HH3, (c)negative reinforcement – HH4,
(d)positive reinforcement – HH4, (e)negative reinforcement – HH5, (f)positive reinforcement– HH5
2 5 7 5 1 2 5 1 7 5 2 2 5
0 5 0 1 0 0 1 5 0 2 0 0 2 5 0 L o a d( KN )
5 0 1 5 0 2 5 0 3 5 0 4 5 0
0 1 0 0 2 0 0 3 0 0 4 0 0 5 0 0
R e i n f o r ce m e n t S t r e s s ( M P a )
B ea m H H 3
Ho rd ij k E x pe ri me nta l
V ec to r2-DS FM
2 5 7 5 1 2 5 1 7 5 2 2 5 0 5 0 1 0 0 1 5 0 2 0 0 2 5 0
L o a d( K N ) 5 0
1 5 0 2 5 0 3 5 0 4 5 0
0 1 0 0 2 0 0 3 0 0 4 0 0 5 0 0
R e i n f o r c e m e n t S t r e ss ( M P a )
B e amHH 3
H or di jk
E x pe ri m ent al V ec t or 2 -D S F M
(a)
(b)
2 5 7 5 1 2 5 1 7 5 2 2 5 0 5 0 1 0 0 1 5 0 2 0 0 2 5 0
L o a d ( K N ) 5 0
1 5 0 2 5 0 3 5 0 4 5 0
0 1 0 0 2 0 0 3 0 0 4 0 0 5 0 0
R e i n f o r c e m e n t S t r e s s ( M P a )
B e am H H4
Ho rd ij k E x per i ment al
V ec tor 2 -D S FM
2 5 7 5 1 2 5 1 7 5 2 2 5 0 5 0 1 0 0 1 5 0 2 0 0 2 5 0
L o a d( K N ) 5 0
1 5 0 2 5 0 3 5 0 4 5 0
0 1 0 0 2 0 0 3 0 0 4 0 0 5 0 0
R e i n f o r c e m e n t S t r e ss ( M P a )
B ea mHH 4
Ho rd ij k
E x pe ri m enta l V ec to r2-DS FM
(c)
(d)
2 5 7 5 1 2 5 1 7 5 2 2 5 0 5 0 1 0 0 1 5 0 2 0 0 2 5 0
L o a d( K N ) 5 0
1 5 0 2 5 0 3 5 0 4 5 0
0 1 0 0 2 0 0 3 0 0 4 0 0 5 0 0
R e i n f o r c e m e n t S t r e ss ( M P a )
B ea mHH 5
Ho rd ij k E x pe ri m enta l V ec to r2-DS FM
2 0 6 0 1 0 0 1 4 0 1 8 0 0 4 0 8 0 1 2 0 1 6 0 2 0 0
L o a d ( K N ) 5 0
1 5 0 2 5 0 3 5 0 4 5 0
0 1 0 0 2 0 0 3 0 0 4 0 0 5 0 0
R e i n f o r c e m e n t S t r e ss ( M P a )
B eamHH 5
H or di jk
E xp eri me ntal V ec tor 2 -DS F M
Figure 15 – Crack pattern for beam HH5
Figure 16 – Reinforcement stresses for beam HH5
[14] Leonhardt, F. e Walther, R. Beiträge zur Behandlung
der Schubprobleme im Stahlbetonbau. Beton-und
Stahlbetonbau, v.57, n.7, Berlin, 1962; p.161-173. [15] d’Avila, V.M.R. Estudo sobre Modelos de Fissuração
de Peças de Concreto Armado via Método dos
Elementos Finitos, Porto Alegre, 2003, Tese de
Doutorado – Universidade Federal do Rio Grande do Sul, 259 p.
[16] Leonhardt, F. e Walther, R. Beiträge zur Behandlung
der Schubprobleme im Stahlbetonbau. Beton-und