• Nenhum resultado encontrado

Rev. CEFAC vol.16 número1

N/A
N/A
Protected

Academic year: 2018

Share "Rev. CEFAC vol.16 número1"

Copied!
10
0
0

Texto

(1)

LATE AUDITORY EVOKED POTENTIALS TO SPEECH

STIMULI PRESENTED WITH DIFFERENT TRANSDUCERS

IN HEARING CHILDREN

Potencial evocado auditivo de longa latência para estímulo de fala

apre-sentado com diferentes transdutores em crianças ouvintes

Raquel Sampaio Agostinho-Pesse (1), Kátia de Freitas Alvarenga (2)

(1) Speech Therapist of the Speech Therapy Clinic, School of

Dentistry, University of São Paulo – USP, Bauru campus; Master in Sciences, Department of Speech Pathology, Uni-versity of São Paulo.

(2) Speech Therapist, Associate Professor, Bauru School of

Dentistry, University of São Paulo – FOB-USP, Bauru, São Paulo, Brazil; Researcher of the Cochlear Implant Team of the Audiological Research Center of the Hospital of Reha-bilitation of Craniofacial Anomalies – USP, Bauru campus, Post-doctoral fellowship in electrophysiology and child audiology.

Conlict of interest: non-existent

system by acoustic or electrical stimulation through electronic devices applied to deafness occurs.

In order to obtain an audiological diagnosis in

the irst months of life, the auditory evoked poten -tials (AEPs) are fundamental, since at this age, the

child has no motor, cognitive and language skills

needed to precisely answer to behavioral methods. In clinical practice, the psychoacoustic thresholds are determined by electrophysiological audiometry

performed by means of brainstem auditory evoked responses (BAER) or auditory steady state evoked

potentials (ASSEP).

In the posterior stage of the audiological diagnosis, regarding the indication of an individual hearing aid (HA), the information obtained through

the AEPs are also fundamental, not only for verii -cation of the electroacoustic parameters of hearing aids, but also for the validation step, or in other

words, evaluating the beneits and limitations of

„ INTRODUCTION

The literature in this area shows that the central

auditory system undergoes marked changes on the auditory deprivation in the irst years of life1. Thus,

intervention for hearing loss should be as early as possible so that the maturation of the auditory

ABSTRACT

Purpose: to analyze, in a comparative manner, the inluence of the transducer on the recordings of

P1, N1 and P2components elicited through speech stimulus, as to the latency and amplitude in hearing children. Method: the sample was comprised of 30 hearing children aged 4-12 yrs, both genders. The

long latency auditory evoked potentials were researched by means of transducers, insertion phone and speakers, elicited through speech stimulus /da/ presented with interstimuli interval of 526ms, the

intensity of 70dBNA and presentation rate of 1.9 stimuli per second. Whenever present, P1, N1 and P2 components were analyzed as to latency and amplitude. Results: it was found a strong level of

agreement between the researcher and the judge. There was no statistically signiicant difference when

comparing the values of latency and amplitude of the P1, N1 and P2 components, when considering gender and ear, as well as the latency of components when considering the types of transducers.

However, there was a statistically signiicant difference for the amplitude of the P1 and N1 components

with greater amplitude for the speaker transducer. Conclusion: the latency values of the P1, N1 and P2 components and P2 amplitude obtained with insertion phone may be used as normal reference

independent of the transducer used for the recording of auditory evoked potentials of long latency.

(2)

parents or guardians, tonal injunction or conditioned

audiometry, according to age, extent of acoustic impedance and research of otoacoustic evoked

emissions by transient stimuli.

The Fisher Auditory Problems Checklist question -naire (1997) was applied to the parents of children aged seven to 12 years, with the aim of discarding those with complaints related to auditory processing

disorders. This questionnaire consists of 25 items, where the children’s parents were asked to mark

the complaints with an X, if present. The score was

done by counting the number of unmarked items

and multiplied by four 9.

Inclusion criteria:

Pure tone thresholds within normality 10-11; Tympanometry type A curve, presenting normal

mobility of the tympanum –ossicular system12;

Stapedial relex present at normal levels, ie, triggered between 70 and 100 dB above the

threshold track area13-14;

Presence of otoacoustic emissions evoked by transient stimuli;

Children aged from seven to 12 with more than a

72% score on the Fisher questionnaire 9.

Regarding the exclusion criteria, were

considered:

Tonal thresholds below the normality standards;

Absence of ipsilateral and contralateral acoustic

relexes in one or more frequency;

Absence of otoacoustic evoked emissions;

Less than a 72% score on the Fisher

questionnaire;

Lack in schedules or inability to inish the review.

Of the total of 53 children invited to participate in the study, 23 (43%) were excluded for the following

reasons:

Two children did not return to complete the evaluation;

Three children with a score less than 72% in the

Fisher questionnaire;

Four children had absent acoustic relex;

Five children did not allow the completion of the review;

Nine children missed the evaluation, even after two summonses.

Thus, the casuistry was comprised of 30 children, 20 females and 10 males, ranging in age from four to 12 years.

For the LLAEP research, the Smart EP device USB Jr Intelligent Hearing Systems offering two recording channels was used. Thus, the electrodes

were inserted for recording of auditory evoked

the electronic device. At this stage, it is analyzed

whether the ampliication offered enabled speech

perception for the child through procedures usually

performed with an acoustic transducer box.

In recent years, long latency auditory evoked

potential (LLAEP) has been used for this purpose by representing the electrical activity that occurs in the central auditory system and the ability to be elicited by speech stimuli, such as vowels and even sentences, a condition of special interest in audio-logical research.

The source generating these potentials involves

the region of the auditory cortex, mainly from struc -tures of the thalamocortical and cortico-cortical

auditory pathways, primary auditory cortex and

associated cortical areas2. Thus, the P

1, N1, P2, N2

and P3 components relect the neural activity of the

dendrites involved in the skills of attention, discrimi

-nation, memory, integration and decision making,

the P3 being considered a cognitive potential 3-7, 8. Speciically, the P1-N1-P2 complex signals the neural processing of the acoustic signal in the auditory

cortex, typically elicited in response to clicks, tones

and speech. The morphology of the components is similar to each record and its presence indicates that a speech stimulus was encoded in the auditory

cortex, on the other hand, their absence suggests

that the speech was not encoded7.

LLAEPs occur between 50 and 750ms

post-stimulus, with a wide variability in the values considering the studies performed, as shown in Figure 1 18,18-23,25,28-30.

Although the results obtained so far show that it is possible to capture the LLAEP reliably, with

children making use of hearing aids, it was not

found in the literature researched, that the study had as an objective to analyze the transducer used

to somehow achieve stimulation inluences of the

record obtained.

So the question arose: if the amplitude and

latency of the P1, N1 and P2 components can be

inluenced by the transducer speaker, once the veriication of hearing aids is obtained, does the procedure have to be performed in the free ield?

Based on the described, the goal was to

analyze, in a comparative way, the inluence of

different transducers in the record of the P1, N1 and P2 components elicited by speech stimuli, as well as the latency and amplitude in hearing children.

„ METHOD

For the casuistry, invited to participate in the study, were children aged four to 12 years with

(3)

peak amplitude. The variable amplitude was

determined as the difference between the point corresponding to 0.0 μV (baseline recording) and

the maximum positive value in the case of P1 and

P2 components, and negative, speciically for the

N1 component, measured in μV and the latency measured in ms.

For the N1 component, when observed by

the double peak recording, called N1a and N1b, considered the irst component to record the latency

and amplitude.

The components were visually deined by consid -ering the normal values reported in the literature (Figure 1).

The study was conducted at the Audiological Research Center (ARC) of the University of São Paulo (USP) with the approval of the Ethics Committee of the National Research under Case

No. 181/2004.

Data Analysis

An analysis agreement was performed between

the researcher and an experienced judge in the ield

of electrophysiology for the analysis of the records.

The judge had no prior knowledge about the data

of the child and on the type of transducer used,

earphone or speaker.

The analysis of the variations of the results obtained by the researcher and the judge was performed with the Kappa statistical method that evaluates the correlation between the judges, by paired analysis and presents the percentage of agreement and the strength of agreement, which

was interpreted by the kappa value (1.00).

To verify the systematic error and the casual error17 of the analyzes between the researcher

and the judge, the paired t test and error calculation were used, respectively. The systematic error is

signiicant and its interpretation indicates that a judge tends to identify higher values when p ≤ 0.05.

The random error is an “average” value of error

presented for marking components, considering

the units of measurement used. The normality test used for the distribution of the differences was the Kolmogorov-Smirnov.

The statistical test was applied to the paired “t”,

considering the following test variables: sex, ear,

transducer type, amplitude and latency of the P1, N1 and P2 components (Figures 2 and 3)

potentials occurring on channel A and the recording

of eye movements and blinking on the B channel 15.

On channel A, the active electrode was placed

at Cz connected to the input (+) of the pre-ampliier,

and the reference electrode placed on the mastoid of the stimulated ear and connected to the input (-). The ground electrode was placed on Fpz connected to the ground position.

On channel B, the active electrode was placed on the supraorbital position contralateral to the ear stimulated connected to the input (+) of the

pre-ampliier, and the reference electrode on the

infraorbital position on the same side connected to the (-) input. With this arrangement of electrodes, we sought to establish the amplitude of the eye

movement and previous blink and research poten -tials in order to delimit the level of rejection that was used in each test. With this procedure, the inter-ference of the eye movement artifact is minimized, since this rejection limit was adopted for channel

A so that, consequently, eye movements were not

captured by it, not interfering in the LLAEP record.

To record the auditory evoked and ocular

potentials, disposable MEDITRACETM 200 brand ECG electrodes were used, with Ten 20TM brand conductive gel for EEG that was inserted after

cleaning the skin of individuals with Nuprep brand abrasive gel for ECG / EEG. The impedance level was kept between 1 and 3 kohms for the electrodes.

The evaluation parameters used were bandpass

ilter from 1 to 30 Hz, gain of 100,000 K on both channels, averaging 512 stimuli and the analysis

window response of –100ms pre-stimulus

and-500ms post-stimulus.

The speech stimulus / da / produced in an anterior

study 16 was presented with 526ms of interstimulus

interval in an intensity 70dBNA and presentation rate of 1.9 stimuli per second.

The auditory stimulation occurred in two ways for further comparative analysis, through the EAR TONE3A earphone, Biologic 300ohm and RMS

50 Watts speaker box positioned at 90 ° azimuth,

40 cm away from the stimulated ear. The side of

stimulation was randomly deined, as well as the

transducer order type, starting at one time by the

earphone and the other by the speaker.

The examinations were performed in a quiet

environment, with the child seated comfortably in a reclining chair and oriented to watch a video of their preference without sound.

The P1, N1 and P2 components, when present, were analyzed for latency and amplitude. Such

(4)

Legend: RH: Right Hemisphere; LH: Left Hemisphere.

Figure 1 – Mean latency values, in ms, of the P1, N1 e P2, componentsin accordance with each study analyzed

Albrecht et al. (2000)

Tom 1000Hz

Earphone

right ear 86dBNPS

5-6 years 7-8 years 9-10 years 11-12 years 13-14 years 15-16 years

HD HE HD HE 92(25) 94(11) 88(12) 80(26) 71(12) 67(21) 106(9) 105(10) 99(13) 84(18) 74(27) 67(16) 254(56) 229(54) 223(29) 202(49) 144(53) 172(52) 241(47) 216(47) 211(36) 180(22) 148(43) 177(53) -- -- -- -- -- -- -- -- -- -- -- -- Cunninghan

et al. (2000) /ga/

Earphone

right ear 75dBNPS

5-7 years 8-10 years 11-12 years 13-15 years 90(13) 89(17) 88(20) 80(15) 146(20) 133(22) 37(20) 120(13) -- -- -- -- -- -- -- --

Ponton et al.

(2000) Click

Speaker headset

left ear 65dBNS

5-6 years 7 years 8 years 9 years 10 years 11 years 12 years 85(16) 79(22) 66(13) 68(16) 64(6) 61(10) 54(16) -- -- -- -- -- -- -- 137 99(9) 106(19) 95(19) 98(8) 89(10) 90(15) 135 136(4) 147(15) 136(15) 149(15) 142(4) 147(12) Ventura et al.

(2009) Click

Earphone

right ear 70dBNA 3-12 years 87(25) 145(43) --- 204(57)


Author Stimulus Transducer Intensity Age P1 N1a N1b P2 Ohlrich e Barnet

(1972) Click

Overhead

speaker 65dBNA

1 month 6 months 12 months 63(10) 89(39) 66(20) 92(17) 120(44) 95(32) -- -- -- 220(35) 193(29) 170(34)

Barnet et al.

(1975) Click

Overhead

speaker 108dBNPS

5 months 1 month 1½ months 2 months 3 months 6 months 9 months 12 months 15 months 18 months 24 months 30 months 36 months 72(4) 65(24) 59(14) 64(32) 72(19) 99(27) 66(26) 65(11) 66(16) 57(19) 76(19) 77(19) 67(27) 97(17) 104(34) 95(29) 101(19) 114(34) 139(31) 91(24) 109(21) 105(45) 88(27) 91(26) 113(32) 100(20) -- -- -- -- -- -- -- -- -- -- -- -- -- 217(26) 214(38) 201(33) 229(55) 219(33) 199(28) 176(23) 182(31) 158(36) 167(20) 151(22) 154(24) 153(21) Ohlrich et al.

(1978) Click Earphone

5 months 36 months 88 71 116 104 -- -- 234 153 Tonnquist-Uhlén

et al. (1995)

Tone burst

500Hz Earphone 75dBNA 8-16 years --

HD HE

-- --

102 100 Ponton et al.

(1996) Click

Surface headset

left ear 65dBnNA 6-19 years 50.6(8.0) -- -- --

Bruneau et al. (1997)

Tone burst

750Hz Speaker

50 dBNPS 60 dBNPS 70 dBNPS 80dBNPS 4-8 years -- -- -- -- 146(6) 143(6) 135(5) 149(7) -- -- -- -- -- -- -- --

Sharma et al. (1997)

/ba/ Ear phone

right ear 75dBNPS

(5)

survey was conducted with an earphone and 83.33

% with a speaker.

The descriptive analysis (mean, standard

deviation, maximum and minimum values) the

latency and amplitude of the P1, N1 and P2 compo-nents, when they were surveyed with transducers

earphone and speaker are presented in Tables 4 and 5.

The comparison between the values of amplitude and latency of the P1, N1 and P2 components, by means of the paired Student’s t test, considering

the type of transducer earphone and speaker is

presented in Table 6.

„ RESULTS

Normal distribution was observed for all variables. The analysis of agreement between the researcher and the judge, with regard to the latency and amplitude values are found in Tables 1 and 2.

There was no statistically signiicant difference

when comparing the mean values of amplitude and latency of the P1, N1 and P2 components for each type of transducer, considering gender and ear (Table 3), which allowed the analysis of data consid-ering the group of children evaluated.

With regards to obtaining the response, there was the record of the P1 and N1 components in 100% of the children for both transducers, however, the P2 component was recorded in 90% when the

Figure 2 – Mean values, standard deviation, minimum and maximum latency values for the P1, N1 e P2, components considering the types of transducers

Figure 3 – Mean values, standard deviation, minimum and maximum amplitude values for the P1, N1

e P2, components considering the types of transducers

-8,00 -6,00 -4,00 -2,00 0,00 2,00 4,00 6,00 8,00 10,00

P1fone N1fone P2fone P1caixa N1caixa P2caixa

Componentes

)


Components

Amp

lit

u

d

e

V)

50,00 100,00 150,00 200,00 250,00 300,00 350,00

P1fone N1fone P2fone P1caixa N1caixa P2caixa

Componentes

La

nc

ia

s

(m

s)


Components

L

a

te

n

ci

e

s

(6)

Table 1 – Mean values and standard deviation and concordance for each measurement, such as transducer and earphone, considering the components analyzed

*p≤0.05: statistically signiicant difference

Paired t Test and calculation of systemic error (t Test) and casual (Dahlberg) error

Legend: X= mean; SD=standard deviation; R=correlation; p=signiicance value.

Table 2 – Mean values and standard deviation and concordance for each measurement, such as transducer and speaker, considering the components analyzed

*p≤0.05: statistically signiicant difference

Paired t Test and calculation of systemic error (t Test) and casual (Dahlberg) error

Legend: X= mean; SD=standard deviation; R=correlation; p= signiicance value.

Table 3 – Comparison of latency (ms) and amplitude (µV) values for the P1, N1 e P2 components

performed with earphone transducers and speakers considering sex and stimulated ear

*p≤0.05: statistically signiicant difference

Paired t Test

EARPHONE

Researcher Judge Difference Correlation Casual

error

Systematic

error p

X SD X SD X SD R P

P1 latency 84.80 14.74 85.60 14.58 0.80 20.36 0.99 0.000* 1.74 1.84 0.075

N1 latency 205.80 25.17 204.23 24.93 -1.56 4.70 0.98 0.000* 3.45 1.82 0.078

P2 latency 289.23 20.68 288.96 21.07 -0.03 3.31 0.99 0.000* 2.30 0.05 0.953

P1 amplitude 2.54 1.05 2.62 1.13 0.08 0.65 0.82 0.000* 0.46 0.72 0.474

N1 amplitude -3.20 1.18 -3.35 1.37 -0.15 0.48 0.94 0.000* 0.35 1.68 0.103

P2 amplitude 1.39 1.11 1.44 1.17 0.08 0.43 0.93 0.000* 0.30 1.01 0.320


SPEAKER

Researcher Judge Difference Correlation Casual

error

Systematic

error p

X SD X SD X SD R P

P1 latency 88.40 17.38 87.66 16.85 -0.73 2.76 0.99 0.000* 1.99 1.45 0.157

N1 latency 189.70 28.06 190.23 27.44 0.53 4.28 0.99 0.000* 3.00 0.68 0.500

P2 latency 281.96 12.33 281.96 12.43 -0.33 1.49 0.99 0.000* 1.04 1.09 0.286

P1 amplitude 3.69 1.58 3.78 1.66 0.09 0.77 0.89 0.000* 0.54 0.67 0.504

N1 amplitude -3.94 2.04 -4.07 1.50 -0.13 1.63 0.61 0.000* 1.14 0.45 0.655

P2 amplitude 1.63 0.92 1.59 0.88 -0.08 0.27 0.95 0.000* 0.20 1.55 0.133


LLAEP Components

Latency Amplitude

P1 N1 P2 P1 N1 P2

Headset Speaker Headset Speaker Headset Speaker Headset Speaker Headset Speaker Headset Speaker Sex 0.072 0.750 0.757 0.144 0.493 0.510 0.222 0.651 0.222 0.543 0.788 0.526 Ear 0.828 0.211 0.391 0.500 0.236 0.998 0.055 0.677 0.854 0.636 0.126 0.691

(7)

procedure that requires an anesthesia doctor, which

for many centers becomes a problem. Another important aspect is the high concordance with the psychoacoustic thresholds described in the literature.

LLAEPs evaluate the top of the signal processing in the central auditory system, including speech sounds18. Thus, the presence of components,

especially the P1 demonstrates that the auditory

sensation occurred, which enables to make an

„ DISCUSSION

The research of the auditory evoked potentials

have been used as an objective method of evalu-ating individuals with normal hearing, but also in

individuals with hearing impairment making use

of the electronic device: HA or HF, with the goal of evaluating the effectiveness of thereof. In this

context, we highlight the LLAEPs, P1, N1 and P2

components, performed with the child in a state of alert, which eliminates the use of sedation, a

Table 4 – Descriptive analysis for latencies of the P1, N1 e P2, components considering the type of transducer, earphone and speaker

Legend: n=number of children; SD= standard deviation Descriptive analysis

Table 5 – Descriptive analysis for the amplitudes of the P1, N1 e P2, components considering the type of transducer, earphone and speaker

Legend: n=number of children; SD= standard deviation Descriptive analysis

Table 6 – Results of the Paired Student T test to compare the latency (ms) and amplitude (µV) values for the P1, N1 e P2 components performed with transducers, earphones and speakers

* p≤ 0.05: statistically signiicant difference

Paired t Test

Long Latency Auditory Evoked Potential-latency (ms)

N Mean SD Minimum Maximum

P1-earphone 30 84.80 14.74 63 121

N1-earphone 30 205.80 25.17 136 232

P2-earphone 27 289.23 20.68 221 327

P1-speaker 30 88.40 17.38 57 142

N1-speaker 30 189.70 28.06 132 237

P2-speaker 25 281.96 12.33 266 314


Long Latency Auditory Evoked Potential – amplitude (µV)

N Mean SD Minimum Maximum

P1-earphone 30 2.54 1.05 0.77 5.01

N1-earphone 30 -3.20 1.17 -7.13 -1.29

P2-earphone 27 1.34 1.11 0.01 4.01

P1-speaker 30 3.69 1.58 1.46 8.59

N1-speaker 30 -4.20 1.39 -6.82 -1.21

P2-speaker 25 1.63 0.92 0.04 4.08


Long Latency Auditory Evoked Potential P1

latency

N1

latency

P2

latency

P1

amplitude

N1

amplitude

P2

amplitude

Transducer 0.495 0.304 0.555 0.000* 0.018* 0.117

(8)

of the components of the LLAEP has a great deal of subjectivity because it is directly related to the

experience of the examiner. Thus, the concern is valid in knowing whether or not the inluence of the

transducer under the P1, N1 and P2 components, so that the professional can consider this variable

when analyzing a record, thus avoiding mistakes.

With regards to obtaining a response, the P1 and N1 components were recorded in 100% of the children for both transducers, however, the P2 component was recorded in 90% when the survey was conducted with an earphone and 83.33% with

a speaker, with no apparent factor to explain this inding.

In Table 6, it can be seen that there was no

signiicant difference between the latency values

of the amplitude of the P1, N1 and P2 components

for the record with earphones and speakers, with

a similar dispersion of the latency of these compo-nents. Therefore, the latency values obtained with the transducer earphone can be used as a reference

for the procedure performed with a speaker for

these variables.

However, this did not occur for the amplitude of the P1 and N1 components, which was presented as greater when researched with the acoustic

trans-ducer speaker, which was statistically signiicant (Table 6). This inding is extremely important

because normal values should be used according to the transducer, since changes in amplitude indicate changes in the magnitude of synaptic activity involved during the perceptual processing 34.

„ CONCLUSION

The results obtained demonstrated that, in the

analysis of the long latency auditory evoked poten -tials elicited by speech stimuli, the latency values of the P1, N1 and P2 components and the P2 amplitude, obtained with headsets, can be used as a reference for the record analysis obtained with the acoustic

transducer speaker. However, the amplitude values

of the P1 and N1 components differ according to the type of transducer used and must be determined for both the transducer earphone, as well as for the

speaker.

inference about the psychoacoustic threshold of the individual.

Early diagnosis of hearing loss, brings to professionals in the intervention phase in hearing loss, concerns about the indication process and adaptation of electronic devices applied to deafness

in the infant population. This is justiied, initially,

because the selection of electroacoustic character-istics of hearing aids considers the anatomical and acoustic conditions of each ear since it is based on electroacoustic procedures for certifying whether the given program generates the sound pressure level

required to make speech audible and comfortable

for the child. At this stage no behavioral assessment methods are recommended.

Already in the validation step, the effectiveness of the electronic device for the detection of sound

and consequently for other auditory skills involved in the processing of speech sounds is veriied

with the child using the electronic device, ie, the

test is carried out in the free ield with the stimulus presented by the acoustic transducer box.

In the audiology clinical practice, there is concern about the accuracy of the results when the procedure is done this way, because many variables must be

controlled, from the positioning of the acoustic boxes

to the stimulus calibration, including the variability of the test-retest.

The literature search focused on the LLAEP in normal children, the population evaluated in this study, and it appears that in the literature searches were performed with a headset 8,19-28 and free ield 29-33, with analysis of the age and characteristics of the

stimulus used, involving the type, intensity, duration, interstimulus interval, among others. It is important to note that the diversity in the methodology used in these studies complicates the comparative analysis

and may explain the variability of the latency and

amplitude of the P1, N1 and P2 components, as observed in Figure 1 and the results obtained in the

present study (Tables 4 and 5 ). Accordingly, it is recommended that studies purporting to examine changes in speciic groups, using the control group

for data analysis.

In this context, no studies seeking to determine the inluence of the transducer used for stimulus

(9)

7. Martin BA, Tremblay KL, Korczak P. Speech evoked potentials: from the laboratory to the clinic. Ear Hear. June, 2008; 29(3): 285-313.

8. Ventura LMP, Costa Filho AO, Alvarenga KF. Maturação do sistema auditivo central em crianças ouvintes normais. Pro Fono. Abr-Jun, 2009; 21(2): 101-6.

9. Johnson CDC, Benson PV, Seaton JB. Educational

audiology handbook. In: ______. Assessment

practices. San Diego: Singular Publishing Group; 1997. p. 49-372.

10. Lloyd LL, Kaplan H. Audiometric interpretation: a

manual o basic audiometry. University Park Press:

Baltimore; 1978. P. 16-7, 94.

11. Northen JL, Downs MP. Hearing in children.

3ª.ed. Williams & Wilkins: Baltimore; 1984. P. 89. 12. Jerger J. Clinical experience with

impedance audiometry. Arch Otolaryngol, 1970;Oct;92(4):311-24

13. Gelfand SA. The contralateral acoustic relex threshold. In: Silman S. The acoustic relex: basic

principles and clinical aplications. Academic Press: Orlando, Florida; 1984. P. 137-86.

14. Jerger S, Jerger J. Alterações auditivas: um manual para avaliação clínica. Atheneu: São Paulo; 1989. p. 102.

15. Ventura LMP. Maturação do sistema auditivo

central em crianças ouvintes normais: potenciais evocados auditivos de longa latência. [dissertação]. Bauru (SP): Faculdade de Odontologia de Bauru. Universidade de São Paulo; 2008.

„ REFERENCES

1. Sharma A, Nash AA, Dorman M. Cortical development, plsticity and re-organization in children with cochlear implants. J Commun Disord. July-Aug, 2009; 42(4): 272-9.

2. Woods DL, Clayworth CC, Knight RT, Simpson GV, Naeser MA. Generators of middle and

long-latency auditory evoked potentials: implications

for studies of patients with temporal lobe lesions. Electroenceph Clin Neurophysiol. Ireland. Mar, 1987; 68(2): 132-48.

3. Knight RT, Hillyard SA, Woods DL, Neville HJ. The effects of frontal and temporal-parietal lesions on

the auditory evoked potential in man. Electroenceph Clin Neurophysiol. Ireland. Oct, 1980; 50(1/2):

112-24.

4. Näätänen R, Picton T. The N1 wave of the human electric and magnetic response to sound: A review and an analysis of the component structure.

Psychophysiology. July, 1987; 24(4): 375-425. 5. Rif J, Hari R, Hämäläinen M, Sams M. Auditory

attention affects two different areas in the human

supratemporal cortex. Electroencephalogr Clin

Neurophysiol. Ireland. Dec, 1991; 79(6): 464-72. 6. Woods DL, Knight RT, Scabini D. Anatomical substrates of auditory selective attention: behavioral and electrophysiological effects of posterior

association cortex lesions. Brain Res Cogn Brain

Res. Dec, 1993; 1(4): 227-40.

RESUMO

Objetivo: analisar, de forma comparativa, a inluência do transdutor no registro dos componentes P1, N1 e P2 eliciados por estímulo de fala, quanto à latência e à amplitude, em crianças ouvintes. Método:

30 crianças ouvintes de quatro a 12 anos de idade, de ambos os sexos. Os potenciais evocados audi

-tivos de longa latência foram pesquisados por meio dos transdutores, fone de inserção e caixa acús

-tica, eliciados por estímulo de fala /da/, sendo o intervalo interestímulos de 526ms, a intensidade de 70dBNA e a taxa de apresentação de 1,9 estímulos por segundo. Foram analisados os componentes

P1, N1 e P2 quando presentes, quanto à latência e à amplitude. Resultados: constatou-se um nível de

concordância forte entre a pesquisadora e o juiz. Não houve diferença estatisticamente signiicante

ao comparar os valores de latência e amplitude dos componentes P1, N1 e P2, ao considerar sexo

e orelha, assim como para a latência dos componentes quando analisado os tipos de transdutores. Entretanto, houve diferença estatisticamente signiicante para a amplitude dos componentes P1 e

N1, com maior amplitude para o transdutor caixa acústica. Conclusão:os valores de latência dos componentes P1, N1 e P2 e amplitude de P2 obtidos com fone de inserção podem ser utilizados como

referência de normalidade independente do transdutor utilizado para a pesquisa dos potenciais evo -cados auditivos de longa latência.

(10)

evidence from multi-channel evoked potentials. Clin

Neurophysiol. Feb, 2000; 111(2):220-36.

26. Ponton C, Eggermnot JJ, Khosla D, Kwong B, Don M. Maturation of human central auditory system

activity: separating auditory evoked potentials by

dipole source modeling. Clin Neurophysiol. Mar, 2002; 113(3):407-20.

27. Kummer P, Burger M, Schucter M, Rosanowski F, Eysholdt U, Hoppe U. Cortical auditory evoked

potentials to acoustic changes in speech stimuli in children. Folia Phoniatr Logop. Aug, 2007;

59(5):273-80.

28. Bishop DVM, Hardiman M, Uwer R, Suchodoletz Wv. Maturation of the long-latency auditory ERP: step function changes at start and end of

adolescence. Dev Sci. Sep, 2007; 10(5):565-75. 29. Ohlrich ES, Barnet AB. Auditory evoked responses during the irst of life. Electroencephalogr

Clin Neurophysiol. Ireland. Feb, 1972; 32(2):161-9.

30. Barnet AB. Auditory evoked potentials during

sleep in normal children from ten days to three years of age. Electroencephalogr Clin Neurophysiol.

Ireland. Jul, 1975; 39(1):29-41.

31. Bruneau N, Roux S, Guérin P, Barthélémy C, Lelord G. Temporal prominence of audotory evoked

potentials (N1 wave) in 4-8 year-old children. Psychophysiology. Jan, 1997; 34(1):32-8.

32. Pang EW, Taylor MJ. Tracking the development of the N1 from age 3 to adulthood: an examination of

speech and non-speech stimuli. Clin Neurophysiol. Feb, 2000; 111(2):388-98.

33. Sharma A, Dorman MF, Spahr AJ. A sensitive period for the development of the central auditory system in children with cochlear implants: implications for age of implantation. Ear Hear. Dec,

2002; 23(6): 532-9.

34. Vaughan HGJr, Ritter W. The sources of auditory

evoked responses recorded from the human scalp.

Electroencephalogr Clin Neurophysiol. Ireland. Apr, 1970; 28(4): 360-7.

16. Banhara MR. Potencial cognitivo-P300 evocado por estímulo de fala em usuários de implante coclear multicanal. [dissertação]. São Paulo (SP): Universidade de São Paulo. Fisiopatologia

Experimental; 2007.

17. Houston WJB. The analysis of errors in orthodontic measurements. Am. J. Orthod. May,

1983; 83(5): 382-90.

18. Digeser FM, Wohlberedt T, Hoppe U. Contribution of spectrotemporal features on auditory event-related potentials elicited by consonant-vowel syllables. Ear Hear. 2009; 30(6): 704-12.

19. Ohlrich ES, Barnet AB, Weiss IP, Shanks BL. Auditory evoked potential development in early

childhood: a longitudinal study. Electroencephalogr Clin Neurophysiol. Ireland. Apr, 1978; 44(4): 411-23.

20. Tonnquist-Uhlen I, Borg E, Spens KE. Topography of auditory evoked long-latency

potentials in normal children, with particular reference to the N1 component. Electroencephalogr

Clin Neurophysiol. Ireland. Jul, 1995; 95(1): 34-41.

21. Ponton CW, Don M, Eggermont JJ, Waring MD, Masuda A. Maturation of human cortical auditory function: differences between normal-hearing children and children with cochlear implants. Ear

Hear. Oct, 1996; 17(5): 430-7.

22. Sharma A, Kraus N, McGee TJ, Nicol TG. Developmental changes in P1 and N1 central auditory responses elicited by consonant-vowel syllables. Electroencephalogr Clin Neurophysiol.

Ireland. Nov, 1997; 104(6): 540-5.

23. Albrecht R, Suchdoletz Wv, Uwer R. The

development of auditory evoked dipole source

activity from childhood to adulhot. Clin Neurophysiol. Dec, 2000; 111(12):2268-76.

24. Cunningham J, Nicol T, Zecker S, Kraus N. Speech-evoked neurophysiologic responses in

children with learning problems: development and behavioral correlates of perception. Ear Hear. Dec,

2000; 21(6): 554-68.

25. Ponton CW, Eggermont JJ, Kwong B, Don M.

Maturation of human central auditory system activity:

Received on: September 27, 2011 Accepted on: April 18, 2012

Mailing address:

Raquel Sampaio Agostinho-Pesse

Rua Dr. Henrique Arouche de Toledo, 2-54 Jardim América – Bauru – SP

CEP: 17017-320

Imagem

Figure 1 – Mean latency values, in ms, of the P 1,  N 1  e P 2,  components in accordance with each study  analyzed Albrecht et al
Figure 2 – Mean values, standard deviation, minimum and maximum latency values for the P 1 , N 1  e P 2 ,  components considering the types of transducers
Table 2 – Mean values and standard deviation and concordance for each measurement, such as  transducer and speaker, considering the components analyzed
Table 4 – Descriptive analysis for latencies of the P 1 , N 1  e P 2 , components considering the type of  transducer, earphone and speaker

Referências

Documentos relacionados

The probability of attending school four our group of interest in this region increased by 6.5 percentage points after the expansion of the Bolsa Família program in 2007 and

Purpose: The aim of the present study was to compare latency and amplitude of the cortical auditory evoked response P1i among newborns in an alert state and during light

Among the EAPs, the short (Auditory Evoked Potential Brain Stem Potential - BAEP), mean (Moderate Latency Auditory Evoked Potential - MEL) or long latency (P1, N1, P2, N2) can

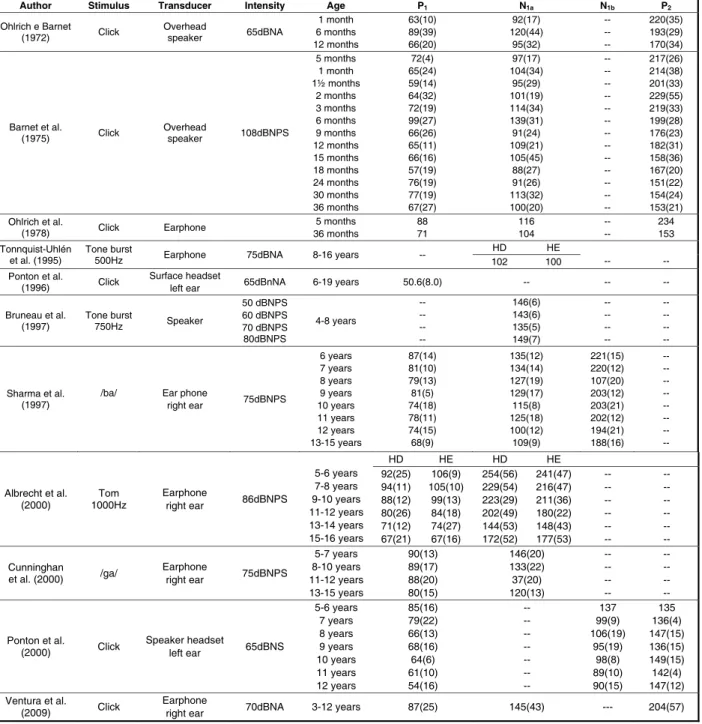
The material from the present study was based on the results from the basic audiological evaluation and the Long Latency Auditory Evoked Potentials (latencies of..

The articles from Audiology are the next, and cover subjects such as: long latency auditory evoked potential in school children with learning disabilities; the use of different

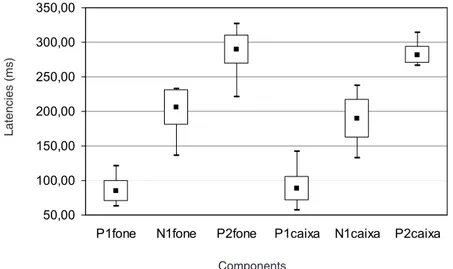
There was a decrease in the latency of the components P1 and P2 obtained with speech stimulus across the evaluations, and a decrease in the latency and increase in the amplitude of

Since the speech stimulus is a complex signal and its presence signals speech processing in the cortex, this study aimed to compare the results of Long Latency Auditory Evoked

On first putting down our lines at the anchorage we obtained some cat fish. The quantity of fresh water poured out by the river diminished. the marvel in some