FISH STOCK ASSESSMENT OF PIRAPUTANGA
Brycon
microlepis
IN THE CUIABÁ RIVER BASIN,
PANTANAL OF MATO GROSSO, BRAZIL
MATEUS, L. A. de F.1 and ESTUPIÑÁN, G. M.B.2
1Departamento de Produção Animal, Universidade Federal de Mato Grosso, CEP 78060-900, Cuiabá, MT, Brazil 2Centro de Pesquisas em Biologia Aquática, INPA, CEP 69011-970, Manaus, AM, Brazil
Correspondence to: Lúcia A. F. Mateus, Departamento de Ecologia, IB, Unesp, CEP 13506-900, Rio Claro, SP, Brazil, e-mail: lmateus@terra.com.br
Received November 27, 2000 – Accepted March 28, 2001 – Distributed February 28, 2002
(With 4 figures)
ABSTRACT
Fork length measurements of individuals of Brycon microlepis landed and commercialized at the Porto
Market in Cuiabá, MT, from May-October 1996 to May-October 1997 were used to estimate growth and mortality parameters for this species. The average estimated populational parameters were: L∞= 705 mm, k = 0.275 year–1, C = 0.775, WP = 0.465, Lc = 164 mm, M = 0.585 year–1, Z = 0.822 year–1, with F = 0.237 year–1. Yield per recruit analysis suggests that the stock is not yet overexploited.
Key words: Brycon, mortality, yield per recruit, fisheries management.
RESUMO
Avaliação do estoque pesqueiro da piraputanga Brycon microlepis na bacia do rio Cuiabá, Pantanal Mato-grossense
Medidas de comprimento furcal obtidas de exemplares de Brycon microlepis desembarcados e
comer-cializados no Mercado do Porto em Cuiabá, MT, no período de maio a outubro de 1996 e de maio a outubro de 1997, foram utilizadas para a obtenção de estimativas dos parâmetros de crescimento e mortalidade da espécie. Os parâmetros populacionais médios estimados foram: L∞ = 705 mm; k = 0,275 ano–1; C = 0,775; WP = 0,465; Lc = 164 mm; M = 0,585 ano–1; Z = 0,822 ano–1, sendo F = 0,237 ano–1. A análise do rendimento por recruta e a taxa de explotação indicam que o rendimento máximo sustentável não foi alcançado. Portanto, o estoque ainda não está sobreexplotado.
Palavras-chave: Brycon, mortalidade, rendimento por recruta, manejo de pesca.
INTRODUCTION
The fundamental purpose of fisheries stock assessment is to provide a background for the elaboration of management plans envisioning opti-mum long-term exploitation of natural aquatic resources (Sparre & Venema, 1997; Hilborn & Walters, 1992). To this end, implementation is necessary of fisheries strategies that render high year-to-year catches.
Studies on yield per recruit have already been developed to evaluate fresh-water fisheries stocks. Petrere (1983), based on data from 1977 and 1978,
concluded that the stock of tambaqui, Colossoma macroponum, in Amazonas State was not overfished.
However, Isaac & Ruffino (1996) pointed out the overfishing of this species in Santarém, while Barthem & Petrere (1995) showed a similar situation affecting the piramutaba Brachyplatystoma vaillantii
in the Amazon.
yet overfished. However, for other commercially important species, such as the pacú (Piaractus mesopotamicus), cachara (Pseudoplatystoma fasciatum), and piraputanga, among others, there
are no available data on the maximum sustainable yield.
The piraputanga is an omnivorous characid of the sub-family Bryconinae (Britski et al., 1999),
a species known to undertake periodic upriver migrations associated with reproduction. According to data from the Plano de Conservação da Bacia do Alto Paraguai (PCBAP – Conservation Plan of the Upper Paraguai Basin, 1997), in 1995 this species ranked sixty in the commercial fishery catch in Mato Grosso, when 28.3 tons were captured. However, this figure might have been underes-timated, as no systematic accompaniment of fishe-ries landings exists in this State.
Consumption of piraputanga has been increa-sing in recent year due to its well-appreciated flavor, and its commercialization has been growing in restaurants around Cuiabá, the capital city of Mato Grosso (MT) where its fisheries have great local economic importance. Nevertheless, basic data about the biology of this species is meager, and information about the present situation of its stock is lacking.
The present study aimed to evaluate the status of the piraputanga in the Cuiabá River Basin, MT, through yield-per-recruit analysis based on length frequency date based on commercial landings in the fish market of Cuiabá.
MATERIAL AND METHODS
Fork length (LF) measurements in millimeters were obtained from individuals landed and com-mercialized in the Porto Market in Cuiabá, MT, from May to October of 1996 and 1997. Fork lengths were grouped into frequency distributions tables on a monthly basis for each year, and the mean length was calculated from these tables. Total length (LT) measurements were gathered in order to establish a relationship between LT and LF; this was accomplished by means of a linear regression, accordingly to the model LT = a + b * LF, where a and b are parameters estimated by the regression. The following estimates of the growth para-meters were obtained: L∞= asymptotic fork length (cm), k = growth coefficient (year–1), C = oscillation
parameter, and WP = winter point, i.e., the period where growth slows. These parameters were esti-mated with the program ELEFAN I (Pauly, 1987) within the FISAT program (Gayanilo et al., 1994).
Estimation of the natural mortality rate was obtained through Pauly’s empirical model (Pauly, 1980):
ln M = –0.0152 – 0.279 ln L∞+ 0.6543 ln k + + 0.4634 lnT
where L∞is the asymptotic length and T is the mean annual temperature (in °C), which is assumed to reflect the water surface temperature.
The total mortality rate (Z) was obtained accordingly to the model proposed by Ssentongo & Larkin (1973):
Z = (n . k/(n + 1))(ln{L∞ – Lc/( L∞ – L})–1
with the variance of the term (Z/k) calculated as follows:
Var(Z/k) = (n . (n + 1)–2)(ln((L
∞– Lc)( L∞ – L)))–2
where n is the number of fishes sampled, k is the growth coefficient, L∞is the asymptotic length (cm), Lc is the length of the smallest fish in the sample, and L is the average length in the samples.
The relative yield per recruit (Y’/R) was cal-culated by the method of Beverton & Holt (1966) with the FISAT package (Gayanilo et al., 1994),
and according to the model:
Y’/R = EUM/k[1 – (3U/1 + m) + (3U2/1 + 2m) –
– U3/1 + 3m)]
where:
m = (1 – E)/(M/k) = k/Z U = 1 – (Lc/L∞)
E = F/Z (exploitation rate)
RESULTS
350
300
250
200
150
100
50
0
200 300 400 500 600 700
LF (mm)
Frequency
n=2270 1996
350
300
250
200
150
100
50
0
200 300 400 500 600
LF (mm)
Frequency
n=2569 1997
Fig. 1 — Frequency distribution of fork length of the piraputanga Brycon microlepis in the Cuiabá River Basin, Pantanal
Matogrossense.
400
350
300
250
200
LF
(mm)
May Jun Jul Aug Sep Oct
Months
1996
400
350
300
250
200
LF
(mm)
May Jun Jul Aug Sep Oct
Months
1997
Fig. 2 — Monthly average length during 1996 and 1997 of the piraputanga Brycon microlepis in the Cuiabá River Basin,
Pantanal Matogrossense.
The relationship between total and fork length of the piraputanga Brycon microlepis in the Cuiabá
River Basin, Pantanal Mato-grossense, can be obtai-ned by the expression: LT = 16,768 + 0.983LF, r = 0.96, n = 130.
The parameters that describe growth in length of the piraputanga were very similar during 1996 and 1997 (Table 1). The values for k and L∞obtained by the ELEFAN I were respectively 0.28 year–1 and 701 mm for 1996 and 0.27 year–1 and 710 mm for 1997.
The oscillation parameter (C) estimated for 1996 was 0.75 and for 1997 was 0.80, with the winter point (WP) being equal to 0.50 for 1996 and 0.43 for 1997.
These results suggest that growth follows a seasonal oscillatory pattern, with a slow growth rate between May and June, a period corresponding to the low water regime of the region.
TABLE 1
Population parameters of the piraputanga Brycon microlepis in the Cuiabá River Basin,
Pantanal Mato-grossense.
Year L∞ (mm) K (year–1) C WP Rn M (year–1) Z (year–1) F (year–1) E
1996 701 0.28 0.75 0.50 0.174 0.59 0.831 0.241 0.290
1997 710 0.27 0.80 0.43 0.154 0.58 0.814 0.234 0.287
Fig. 3 — Frequency distribution of length and growth curves estimated for the piraputanga Brycon microlepis in the Cuiabá
River Basin, Pantanal Mato-grossense, for 1996 and 1997.
The total mortality, Z, estimated with the length at the first catch (Lc) being equal to 164 mm for 1996 was 0.831 year–1 with a var(Z/k) equal to 0.0039. For 1997, Z was estimated as 0.814 years–1, with var(Z/k) = 0.0036.
The natural mortality rate, M, during 1996, with an annual mean temperature of 26.1°C was estimated at 0.59 year–1. For 1997, when the annual mean temperature was 26.4°C, M was estimated at 0.58 year–1. Fish mortality, F, was estimated by considering that Z = M + F; using this equation, Z was estimated, for 1996 and 1997, as being equal to 0.241 year–1 and 0.234 year–1, respectively (Table 1).
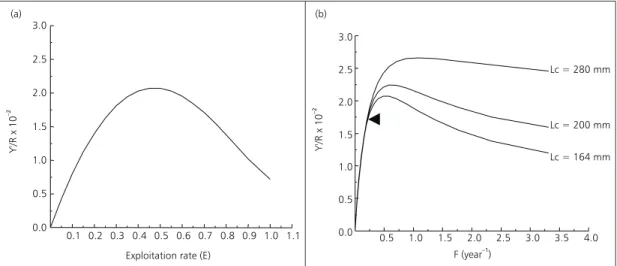
Yield-per-recruit analysis was carried out using the mean values of the populational para-meters between 1996 and 1997, where L∞= 705 mm, k = 0.275 year–1, Lc = 164 mm, M = 0.585 year–1, Z = 0.822 year–1, and F = 0.237 year–1. Fig. 4a shows the relationship between the yield per recruit and the exploitation rate (E), which denotes the fraction of the population that was effectively
removed by fishery (F/Z), for the actual values of M, F, and Lc. E is equal to 0.288, suggesting that the exploitation rate does not yet reach the maximum sustainable yield. In Fig. 4b, the yield per recruit is plotted against F for different values of Lc, with actual values of Lc and F being indi-cated by an arrow. Fig. 4a and b shows that the maximum sustainable yield was not reached. In (a), yield per recruit is demonstrated to have increased as Lc increased, which diminished the risk of overfishing.
DISCUSSION
By law, the minimum length for catching the piraputanga is 30 cm (total length). Even so, during all months of 1996 and 1997, individuals below this limit were landed, as evidenced by the rela-tionship between total and fork length. This in-dicates fishery pressure on young individuals, which in turn may affect recruitment, leading to overfishing. However, data on the size of first
60
40
20
0
Length
(cm)
1996
Jan Feb Mar Apr May Jun Jul Aug Sep Oct Nov Dec
1997 60
40
20
0
Length
(cm)
gonadal maturation are not yet available; this infor-mation is essential for establishing a safer minimum
catch length as well as for implementing of a mana-gement plan for this species.
Fig. 4 — (a) Yield per recruit and exploitation rate and (b) yield per recruit and fish mortality (F) of the piraputanga Brycon
microlepis in the Cuiabá River Basin, Pantanal Mato-grossense. ( ) present value of F.
The piraputanga is an omnivorous species that, based on WP values obtained, shows decreased growth during the lowering period, when schools are returning to the river beds and the feeding area decreases. Moreover, migratoryfishes are accu-mulating reserves for reproductive migration. Studies carried out with other flooding area species indicated diminished growth rate during low water periods (Mateus & Petrere (submitted); Barthem, 1990; Isaac & Ruffino, 1996). Food availability is then less in relation to fish density, fish are then restricted to riverbeds, as they lack access to flooded areas for feeding. Increase in growth as the water level rises is suggested as being a response to increased food availability during this period (Lowe-McConnel, 1999), which enables species to accelerate somatic growth and accumulate reserves for reproductive migration (Junk, 1985).
The Beverton & Holt model of yield per re-cruit indicates that the stock of Brycon microlepis
in the Cuiabá River Basin is not over-fished. Nevertheless, caution should be exercised in using this analysis, as we cannot yet consider other important factors, such as environmental integrity,
that can interfere with recruitment, as in the case of Brycon microlepis which depends on flooded
areas for reproduction, and marginal vegetation for feeding. Thus, these areas must be preserved in order to maintain the renovation capacity of the fish stocks (Welcome, 1979; Nakatani et al.,
1997; Agostinho, 1997).
CONCLUSIONS AND RECOMMENDATIONS
In this study we concluded that the stock of
Brycon microlepis at the present fishing level is
not overfished. However, individuals below the minimum legal limit for catch are being exploited, indicating a tendency for catching juveniles by the commercial fishery.
As a management strategy, we suggest:
l reproductive biology studies in order to
determine the growth parameters of first gonadal maturation so that a safer mi-nimum length estimation for catch can be established;
0.5 1.0 1.5 2.0 2.5 3.0 3.5 4.0 0.0
0.5 1.0 1.5 2.0 2.5 3.0
Lc = 280 mm
Lc = 200 mm
Lc = 164 mm
F (year )–1
0.1 0.2 0.3 0.4 0.5 0.6 0.7 0.8 0.9 1.0 1.1 0.0
0.5 1.0 1.5 2.0 2.5 3.0
Exploitation rate (E)
(a) (b)
Y'/R
x
10
–2
Y'/R
x
10
l preservation of flooded areas and riparian
vegetation;
l implementation of a collection system of
statistical data associated with fishery; this would help to monitor not only the stock of the piraputanga but also of other commercially important stocks so that an adequate management plan could be im-plemented for the entire wetland region.
Acknowledgments — We would like to thank to Dr. Miguel Petrere Jr. for a critical reading of the manuscript.
REFERENCES
AGOSTINHO, A. A., 1997, Qualidade dos habitats e pers-pectivas para a conservação. In: A. A. Agostinho, A. E.
de M. Vazzoler & N. M. Hahn (eds.), A planície de inun-dação do Alto Rio Paraná. EdUEM, Maringá, PR, pp. 455-460.
BARTHEM, R. B., 1990, Ecologia e pesca da piramutaba (Brachyplatystoma vaillanti). Tese de Doutorado,
Unicamp, Campinas, SP, Brasil, 268p.
BARTHEM, R. B. & PETRERE Jr., M., 1995, Fisheries and population dynamics of Brachyplatystoma vaillanti
(Pimalodidae) in the Amazon Estuary. Ann. Woeld Fisheries Congress, Athen, pp. 329-340.
BEVERTON, R. J. H. & HOLT, S. J., 1966, On the dynamics of exploited fish populations. Fish. Invest., Lond. Series, 2(19), 533p.
BRITSKI, H. A., SILIMON, K. Z. & LOPES, B. S., 1999,
Peixes do Pantanal. CPAP/EMBRAPA, Corumbá, MS, 184p.
GAYANILO Jr., F. C., SPARRE, P. & PAULY, D., 1994, The FAO-ICLARM Stock Assessment Tools (FISAT) User’s Gui-de. FAO Computerized Information Series (Fisheries) 6, 186p.
HILBORN, R. & WALTERS, C. J., 1992, Quantitative fishe-ries stock assessment. Choice, dynamics and uncertainty.
Chapman and Hall, London, 570p.
ISAAC, V. J. & RUFFINO, M. L., 1996, Population dynamics of tambaqui Colossoma macropomum Curvier, in the lower Amazon Brazil. Fisheries Management and Ecology, 3:
315-333.
JUNK, W. J., 1985, Temporary fat storage, an adaptation of some fish species to the water level fluctuation and related environmental changes of the Amazon river. Amazoniana,
9(3): 315-351.
LOWE-MCCONNEL, R. H., 1999, Estudos ecológicos de co-munidades de peixes tropicais. EdUSP, São Paulo, SP,
534p.
MATEUS, L. A. F. & PETRERE Jr., M. (submitted) Age, growth and yield per recruit analysis of the pintado,
Pseudoplatystoma coruscans AGASSIZ, in the Cuiabá
river basin, Pantanal of Mato Grosso, Brazil. Brazilian Journal of Ecology.
NAKATANI, K., BAUMGARTNER, G. & CAVICCHIOLI, M., 1997, Ecologia de ovos e larvas de peixes. In: A. A.
Agostinho, A. E. de M. Vazzoler & N. M. Hahn (eds.),
A planície de inundação do Alto Rio Paraná. EdUEM,
Maringá, PR, pp.281-306.
PAULY, D., 1980, On the interrelationships between natural mortality, growth parameters and mean environmental tem-perature in 175 fish stock. International Council for the Exploration of the Sea,39: 175-192.
PAULY, D., 1987, A review of ELEFAN system for analysis of length-frequency data in fish and aquatics invertebrates.
In: D. Pauly & G. R. Morgan (eds.), Length based methods in fisheries research. ICLARM Conference Proccedings, 13: 7-34.
PCBAP – Plano de Conservação da Bacia do Alto Paraguai. Projeto Pantanal, 1997, Progama Nacional do Meio Am-biente/PNMA. Ministério do Meio Ambiente, Recursos
Hídricos e Amazônia Legal, Brasília, Brasil, 3o vol. PETRERE Jr., M., 1983, Yeild per recruit of the tambaqui,
Colossoma macropomum Curvier, in the Amazonas State,
Brazil. J. Fish Biol., 22: 133-144.
SPARRE, P. & VENEMA, S. C., 1997, Introdução à avalia-ção de mananciais de peixes tropicais. Parte 1: Manual, FAO, 404p.
SSENTONGO, G. W. & LARKIN, P. A., 1973, Some simple methods of estimating mortality rates of exploited fish populations. J. Fish. Res. Bd. Can., 30: 695-698. WELCOME, R. L., 1979, Fisheries ecology of floodplain