Acta bot. bras. 22(4): 970-982. 2008.
Temporal variation of the phytoplankton community at short sampling
intervals in the Mundaú reservoir, Northeastern Brazil
Ênio Wocyli Dantas1,2,3,6, Ariadne do Nascimento Moura2, Maria do Carmo Bittencourt-Oliveira3, João Dias de Toledo Arruda Neto4,5 and Airlton de Deus C. Cavalcanti2
Received: July 19, 2007. Accepted: January 31, 2008
RESUMO – (Variação temporal da comunidade fitoplanctônica em curtos intervalos amostrais no reservatório de Mundaú, Nordeste
brasileiro). O objetivo deste estudo foi detectar a influência dos fatores abióticos sobre a comunidade fitoplanctônica em um reservatório de abastecimento, em curtos intervalos amostrais. As amostras foram coletadas na subsuperfície (0,1 m) e fundo das regiões pelágica (8 m) e litorânea (2 m), durante dois períodos sazonais, estações seca e chuvosa. As variáveis abióticas analisadas foram: temperatura da água, oxigênio dissolvido, condutividade elétrica, sólidos totais dissolvidos, turbidez, pH, nitrogênio total, nitrito, nitrato, fósforo total, fósforo total dissolvido e ortofosfato. A biomassa fitoplanctônica foi determinada a partir de valores de biovolume. A influência das variáveis abióticas na dinâmica das espécies fitoplanctônicas foi determinada através da Análise de Correspondência Canônica. A biomassa algal variou de 1,17×10⁴ a 9,21×10⁴ µg.L-1, sendo que as cianobactérias apresentaram valores de biomassa entre 1,07×10⁴ e
8,21×10⁴ µg.L-1. A mais alta disponibilidade de fósforo, limitação de nitrogênio, pH alcalino e estabilidade térmica favoreceram florações
de cianobactérias, especialmente durante o período seco. As diferenças entre os horários e as estações amostrais na distribuição da comunidade fitoplanctônica foram determinadas pelos valores de temperatura, pH, fósforo total e turbidez. As associações fitoplanctônicas que mais se destacaram foram do grupo funcional Sn, formado por Cylindrospermopsisraciborskii, que predominou no sistema em ambos períodos sazonais. Concluiu-se que o fitoplâncton apresentou uma forte influência das variáveis abióticas especialmente no estabelecimento de padrões sazonais de distribuição.
Palavras-chave: Cylindrospermopsisraciborskii, eutrofização, nutrientes, reservatório de abastecimento
ABSTRACT – (Temporal variation of the phytoplankton community at short sampling intervals in the Mundaú reservoir, Northeastern
Brazil). The aim of this study was to determine how abiotic factors drive the phytoplankton community in a water supply reservoir within short sampling intervals. Samples were collected at the subsurface (0.1 m) and bottom of limnetic (8 m) and littoral (2 m) zones in both the dry and rainy seasons. The following abiotic variables were analyzed: water temperature, dissolved oxygen, electrical conductivity, total dissolved solids, turbidity, pH, total nitrogen, nitrite, nitrate, total phosphorus, total dissolved phosphorus and orthophosphate. Phytoplankton biomass was determined from biovolume values. The role abiotic variables play in the dynamics of phytoplankton species was determined by means of Canonical Correspondence Analysis. Algae biomass ranged from 1.17×10⁴ to 9.21×10⁴ µg.L-1; cyanobacteria
had biomass values ranging from 1.07×10⁴ to 8.21×10⁴ µg.L-1. High availability of phosphorous, nitrogen limitation, alkaline pH and
thermal stability all favored cyanobacteria blooms, particularly during the dry season. Temperature, pH, total phosphorous and turbidity were key factors in characterizing the phytoplankton community between sampling times and stations. Of the species studied, Cylindrospermopsisraciborskii populations were dominant in the phytoplankton in both the dry and rainy seasons. We conclude that the phytoplankton was strongly influenced by abiotic variables, particularly in relation to seasonal distribution patterns.
Key words: Cylindrospermopsisraciborskii, eutrophication, nutrients, water supply reservoir
Introduction
Reservoirs are continental environments generally viewed as a transition between lotic and lenticsystems, as they are manmade lakes used to fulfill specific needs
(Straskraba & Tundisi 2000). These artificial ecosystems exhibit space/time variability affecting the formation of several ecological niches. The ability or potential algae have to comply with habitat heterogeneity is a result of their behavior and reproduction characteristics. Thus,
1 Universidade Estadual da Paraíba, Centro de Ciências Biológicas e Sociais Aplicadas, Campus V, Av. das Baraúnas 352, João Pessoa, PB, Brasil 2 Universidade Federal Rural de Pernambuco, Departamento de Biologia, Área de Botânica, Rua D. Manoel de Medeiros s.n., 52171-030
Recife, PE, Brasil ([email protected])
3 Escola Superior de Agricultura “Luiz de Queiroz”, Departamento de Ciências Biológicas, Av. Pádua Dias 11, C. Postal 9, 13418-900 Piracicaba, SP, Brasil
971
Dantas, Moura, Bittencourt-Oliveira, Arruda Neto & Cavalcanti: Temporal variation of the phytoplankton... phytoplankton is important in predicting environmental
events and is a much-needed input in interpreting the functioning of reservoirs.
The small shift in daytime length in tropical environments does not impede seasonal changes in phytoplankton communities. Fluctuations in biomass and phytoplankton composition are mainly related to hydrological changes (Huszar & Reynolds 1997). Short-term studies are important to the understanding of processes occurring on short time scales, such as atelomixis, deoxygenating and denitrification, which contribute toward changes in the dynamics and structure of phytoplankton communities.
In Brazil, studies on phytoplankton in short sampling intervals (24 hours) have been carried out in systems of the southeastern region (Ramirez & Bicudo 2002; 2005; Lopes et al. 2005) and northern region (Huszar &
Reynolds 1997; Melo & Huszar 2000), which exhibit distinct climate characteristics from the northeastern region. In Brazilian lakes and reservoirs studied in 24 hour sampling intervals, temperature plays an important role in the structure and dynamics of the phytoplankton community, explaining the space and time variability of algae throughout a daily cycle.
The northeastern region of Brazil is mainly characterized by its semi-arid climate, where water shortages reflect the temporary aspect of its hydrographic basins and the low precipitation, typically below 1.000 mm.y-1 (Strahler 1986). The construction
of reservoirs is a solution to problems associated to water needs, assuring availability in the dry season. However, influencing factors such as long water residence time in the reservoirs, high temperatures and evapotranspiration, along with an ever increasing dumping of domestic and industrial sewage from urban centers, have inflicted environmental problems such as eutrophication on reservoirs located in northeastern Brazil. In the region and particularly in the state of Pernambuco, 90% of all reservoirs are eutrophic (Bouvy et al. 2000) and algae
blooms occur frequently in a number of aquatic systems. The most common cyanobacteria blooms are from
Cylindrospermopsis raciborskii(Woloszynska) Seenayya
& Subba Raju (Bouvy et al. 1999; 2000; 2001),
Microcystis aeruginosa (Kützing) Kützing (Chellappa &
Costa 2003) and Anabaena spiroides Klebahn (Molica
et al. 2005).
There are studies demonstrating that, under eutrophic conditions, phytoplankton biomass is controlled by abiotic factors (the bottom-up effect); small variations in nutrient levels within short sampling intervals result in a rapid change in the structure of the algae community. However, there is a lack of studies using short sampling intervals and associating environmental conditions of
aquatic systems in northeastern Brazil with the phytoplankton community. Thus, the aim of the present study was to detect the influence of abiotic variables on temporal distributions (daily and between the dry and rainy seasons) of a phytoplankton community in a eutrophic drinking water supply system (the Mundaú Reservoir) in northeastern Brazil during short periods.
Material and methods
The Mundaú reservoir lies within the coordinates 08°56’47’’S and 36°29’33’’W at an altitude of 716 m. Maximum reservoir depths are 10 and 9 meters in the rainy and dry seasons, respectively. The accumulation capacity of this reservoir is 1. 968.000 m3 and the water
retention time coincides with the duration of the dry season.
The occurrence of macrophytes is not important, but isolated banks of Nymphaea spp have been observed.
The terrestrial vegetation around the reservoir is made up of species featured in the caatinga (xeric scrubland
and thorn forest). This reservoir is intended for the public water supply, but currently receives part of the urban drainage from the city of Garanhuns, Pernambuco (SHR 2000).
Samples were collected in two seasonal periods: dry (January 2005) and rainy (June 2005) over 20 hour sampling periods during daylight (8 am, 12 pm and 4 pm) and dark (8 pm, 12 am and 4 am) hours. Samples were collected from the subsurface in pelagic (E1) and littoral
(E2) zones using a van Dorn bottle. Samplings were
performed at 8 m and 2 m, respectively.
Abiotic variables were determined in situ and
included water temperature and dissolved oxygen using an oximeter (Schott Glaswerke Mainz, handylab OX1); electrical conductivity and total dissolved solids (TSD) by means of a conductivimeter (Schott Glaswerke Mainz, handylab LF1); turbidity using a turbidimeter (Hanna Instruments, HI 93703), and pH using a potentiometer (Digimed, DMPH-2). Water transparency was determined using a 25 cm diameter Secchi disc. The determination of the photic zone was performed following the procedure described in Margalef (1983).
Dantas, Moura, Bittencourt-Oliveira, Arruda Neto & Cavalcanti: Temporal variation of the phytoplankton...
972
(µg.N-NO2.L-1) and nitrate (µg.N-NO3.L-1) followed
procedures described in Valderrama (1981), Mackereth
et al. (1978) and Golterman et al. (1971), respectively.
Total phosphorus (µg.TP.L-1) and total dissolved
phosphorus (µg.TDP.L-1) were determined following
Valderrama (1981). Orthophosphate (µg.P-PO4.L-1) was
determined following Strickland & Parsons (1965). The content of particulate phosphorus (µg.PP.L-1) and
dissolved organic phosphorus (µg.DOP.L-1) were
determined from the difference between TP and TDP, and PTD and P-PO4, respectively.
Samples for taxonomic analysis were preserved in 4% formaldehyde. Identification was performed down to species level using an optical microscope (Zeiss/ Axioskop) or to the highest possible taxonomic resolution using relevant literature (Komárek & Foot 1983; Sant’Anna 1984; Round et al. 1990; Komárek &
Anagnostidis 1999; Komárek & Anagnostidis 2005). Water aliquots of 100 mL were collected daily from the reservoir and preserved in acetic Lugol’s solution for the determination of cell density (cell.L-1) following
the Utermöhl method (Hasle 1978). Densities were converted into biovolumes following the procedure in Edler (1979).
Analysis of variance (ANOVA) was calculated using the BioEstat 3.0 statistical package (Ayres et al. 2003)
and employed to determine the degree of temporal variation (time of the day and seasonal period) and spatial variation (depth and sampling station). The significance level was set at 5%. Canonical Correspondence Analysis using the PC-ORD software version 4.14 for Windows (McCune & Mefford 1999) was employed for the evaluation of the temporal gradient and to determine what abiotic variables were influencing the dynamics of phytoplankton species.
Results
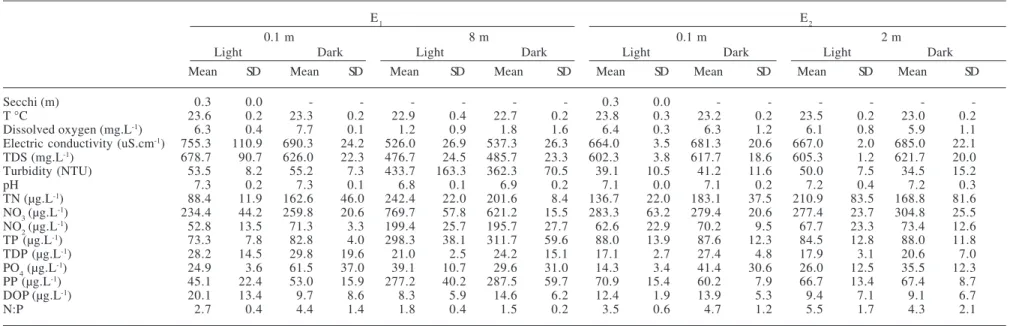
In the dry period, the Mundaú reservoir exhibited lower oxygenated water, higher pH in the subsurface and lower turbidity when compared to the rainy season, which had well-oxygenated water, pH ranging from near neutral to lower values and high turbidity, especially near the sediment in the pelagic zone (Tab. 1, 2).
No vertical differences were observed (p > 0.05)
in the dry season regarding temperature, dissolved oxygen, electrical conductivity, total dissolved solids, turbidity and pH. A difference in turbidity (F = 15.850,
p < 0.01) was observed between the light and dark hours;
higher turbidity was found in the dark hours, except in E2 at a depth of 2 m (Tab. 1). Electrical conductivity and total dissolved solids had lower variation coefficients (0.38% and 0.31%), with no vertical or temporal
variability during light and dark hours.
The most significant vertical differences in the rainy season were observed in E1, where temperature (F = 15.180, p < 0.01), dissolved oxygen (F = 89.497, p < 0.001), electrical conductivity (F = 31.235, p < 0.001), total dissolved solids (F = 36.577, p < 0.001)
and pH (F = 32.216, p < 0.001) had higher values at the
subsurface. No differences were observed between light and dark hours in the rainy season, with the exception of the concentrations of dissolved oxygen at the subsurface of the pelagic zone (F = 28.880, p < 0.01),
which were higher during dark hours.
The analysis of nutrients from the dry season (Tab. 1) as a function of depth revealed differences in the concentrations of total nitrogen (F = 10.026, p < 0.01)
and total dissolved phosphorus (F = 19.267, p < 0.001)
at both stations as well as orthophosphate and total phosphorus, with higher values at the bottom (p < 0.01), particularly in E1. Vertical differences for NO3 and NO2
were registered only during daylight hours, with the smaller values occurring at the subsurface, except for the NO2 concentrations in E2. These two nitrogen rich
forms also displayed horizontal variation between light and dark hours
NO3 levels were higher in E1, whereas NO2 levels
were higher in E2. NO3 concentrations were higher during
dark hours at the subsurface and during light hours at the bottom. NO2 levels between light/dark hoursexhibited
a similar pattern in E1, but an opposite pattern in E2.
There was an increase in nitrogen-composed products, total nitrogen, nitrate and nitrite (Tab. 2) in the rainy season as well as a reduction in dissolved-phosphate elements, total dissolved phosphorus, orthophosphate and dissolved organic phosphorus (Tab. 2). Vertical differences were significant only in E1, with total nitrogen levels, nitrate, nitrite and total
phosphorus significantly higher (p < 0.01) near the sediment. Horizontal differences between light/dark hours were more evident for total nitrogen and orthophosphate concentrations. These two nutrients had higher values at the subsurface in the dark hours. Total nitrogen was higher concentrations in E2, whereas
orthophosphate was higher in E1.
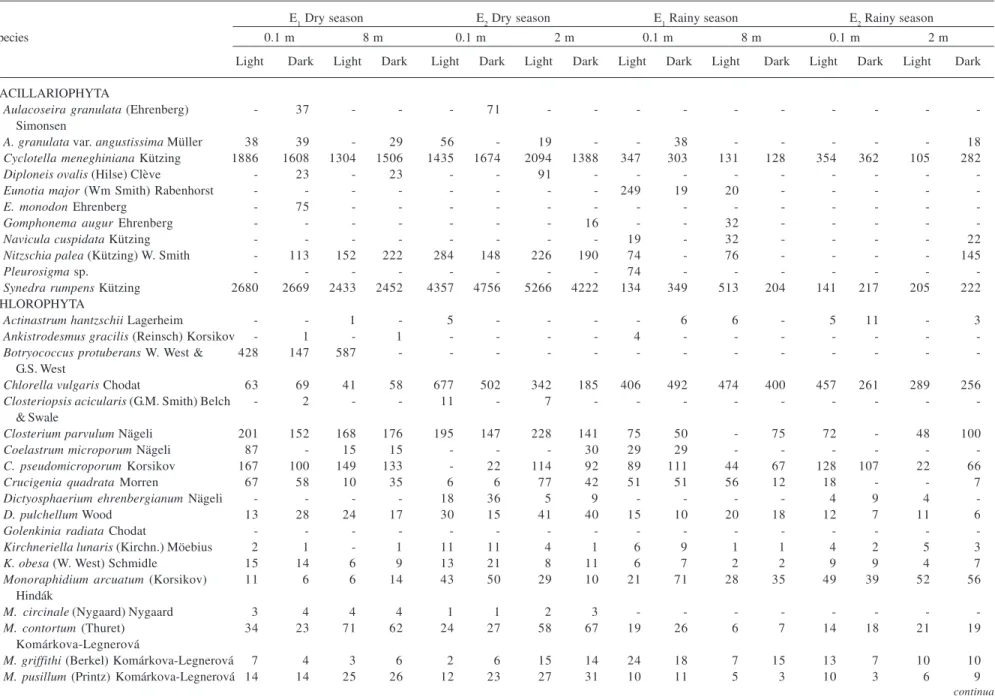
Biotic variables – Phytoplankton flora was represented by 66 infrageneric taxa and six generic taxa. The highest species richness was observed for Chlorophyta, corresponding to 54.17% of the infrageneric taxa identified, followed by Cyanophyta (19.44%), Bacillariophyta (15.28%), Euglenophyta (8.33%), Dinophyta (1.39%) and Cryptophyta (1.39%) (Tab. 3). Phytoplankton biomass ranged from 1.17×10⁴ to
9.21×10⁴ µg.L-1 (Fig. 1). The community was made up
Acta bot. bras. 22(4): 970-982. 2008.
973
Table 1. Physical and chemical variables of the Mundaú reservoir, Northeastern Brazil at the sampling stations E1 e E2 during the dry season. (-) dates without sampling.
E1 E2
0.1 m 8 m 0.1 m 2 m
Light Dark Light Dark Light Dark Light Dark
Mean SD Mean SD Mean SD Mean SD Mean SD Mean SD Mean SD Mean SD
Secchi (m) 0.3 0.0 - - - 0.4 0.0 - - -
-T °C 27.5 0.8 27.3 0.4 25.4 0.5 25.3 0.2 28.3 0.6 27.5 0.8 27.2 1.3 26.9 0.4
Dissolved oxygen (mg.L-1) 0.8 0.4 1.2 1.1 0.2 0.2 0.4 0.2 0.8 0.0 1.8 1.1 0.7 0.1 1.2 1.0
Electric conductivity (uS.cm-1) 396.3 0.6 398.3 1.5 393.7 3.5 394.7 3.5 396.0 1.7 398.0 1.0 392.0 2.0 390.3 2.3
TDS (mg.L-1) 349.3 0.6 350.7 1.2 346.3 2.1 347.0 3.0 349.0 1.7 351.3 0.6 345.7 1.5 343.7 2.1
Turbidity (NTU) 32.9 1.4 35.9 2.2 21.2 5.0 26.3 5.1 32.9 1.4 36.6 1.2 32.5 4.6 29.9 3.9
pH 8.3 0.1 8.3 0.2 7.2 0.1 7.2 0.1 8.4 0.1 8.2 0.1 7.9 0.4 7.6 0.3
TN (µg.L-1) 57.4 11.4 61.9 5.4 102.7 22.3 81.6 13.4 61.9 22.7 59.9 8.9 70.5 30.2 80.1 20.4
NO3 (µg.L-1) 165.7 35.9 214.1 43.1 331.5 149.4 214.1 72.8 131.2 97.9 172.6 83.7 179.5 83.7 179.5 97.9
NO2 (µg.L-1) 8.2 0.5 13.8 3.6 42.6 48.7 8.2 2.4 39.2 39.6 20.4 16.0 8.5 0.9 23.2 26.4
TP (µg.L-1) 106.5 5.2 104.8 10.5 147.2 17.3 130.0 19.8 95.6 14.6 110.0 10.5 117.4 17.2 105.4 2.0
TDP (µg.L-1) 54.9 7.8 49.8 9.7 73.1 7.8 73.6 7.3 49.2 8.6 56.5 4.5 60.6 5.6 60.6 3.1
PO4 (µg.L-1) 75.2 2.7 70.6 9.6 76.7 7.0 92.0 8.0 67.5 5.3 75.2 5.3 69.0 4.6 69.0 20.1
PP (µg.L-1) 51.6 13.0 55.0 7.2 74.1 9.6 56.4 25.6 46.4 12.0 53.5 9.4 56.8 21.3 44.7 3.7
DOP (µg.L-1) 54.9 7.8 26.7 8.6 48.1 6.5 43.6 7.0 27.2 9.4 32.0 5.6 38.1 7.1 38.1 7.6
N:P 1.2 0.3 1.3 0.2 1.5 0.3 1.4 0.1 1.4 0.3 1.2 0.3 1.4 0.8 1.7 0.5
Table 2. Physical and chemical variables of the Mundaú Reservoir, Northeastern Brazil at the sampling stations E1 e E2 during the rainy season. (-) dates without sampling.
E1 E2
0.1 m 8 m 0.1 m 2 m
Light Dark Light Dark Light Dark Light Dark
Mean SD Mean SD Mean SD Mean SD Mean SD Mean SD Mean SD Mean SD
Secchi (m) 0.3 0.0 - - - 0.3 0.0 - - -
-T °C 23.6 0.2 23.3 0.2 22.9 0.4 22.7 0.2 23.8 0.3 23.2 0.2 23.5 0.2 23.0 0.2
Dissolved oxygen (mg.L-1) 6.3 0.4 7.7 0.1 1.2 0.9 1.8 1.6 6.4 0.3 6.3 1.2 6.1 0.8 5.9 1.1
Electric conductivity (uS.cm-1) 755.3 110.9 690.3 24.2 526.0 26.9 537.3 26.3 664.0 3.5 681.3 20.6 667.0 2.0 685.0 22.1
TDS (mg.L-1) 678.7 90.7 626.0 22.3 476.7 24.5 485.7 23.3 602.3 3.8 617.7 18.6 605.3 1.2 621.7 20.0
Turbidity (NTU) 53.5 8.2 55.2 7.3 433.7 163.3 362.3 70.5 39.1 10.5 41.2 11.6 50.0 7.5 34.5 15.2
pH 7.3 0.2 7.3 0.1 6.8 0.1 6.9 0.2 7.1 0.0 7.1 0.2 7.2 0.4 7.2 0.3
TN (µg.L-1) 88.4 11.9 162.6 46.0 242.4 22.0 201.6 8.4 136.7 22.0 183.1 37.5 210.9 83.5 168.8 81.6
NO3 (µg.L-1) 234.4 44.2 259.8 20.6 769.7 57.8 621.2 15.5 283.3 63.2 279.4 20.6 277.4 23.7 304.8 25.5
NO2 (µg.L-1) 52.8 13.5 71.3 3.3 199.4 25.7 195.7 27.7 62.6 22.9 70.2 9.5 67.7 23.3 73.4 12.6
TP (µg.L-1) 73.3 7.8 82.8 4.0 298.3 38.1 311.7 59.6 88.0 13.9 87.6 12.3 84.5 12.8 88.0 11.8
TDP (µg.L-1) 28.2 14.5 29.8 19.6 21.0 2.5 24.2 15.1 17.1 2.7 27.4 4.8 17.9 3.1 20.6 7.0
PO4 (µg.L-1) 24.9 3.6 61.5 37.0 39.1 10.7 29.6 31.0 14.3 3.4 41.4 30.6 26.0 12.5 35.5 12.3
PP (µg.L-1) 45.1 22.4 53.0 15.9 277.2 40.2 287.5 59.7 70.9 15.4 60.2 7.9 66.7 13.4 67.4 8.7
DOP (µg.L-1) 20.1 13.4 9.7 8.6 8.3 5.9 14.6 6.2 12.4 1.9 13.9 5.3 9.4 7.1 9.1 6.7
Dantas, Moura, Bittencourt-Oliveira, Arruda Neto & Cavalcanti: Temporal variation of the phytoplankton...
974
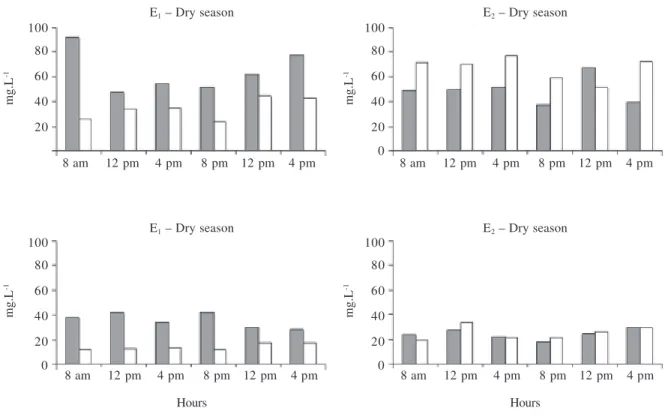
Hours Hours
Figure 1. Spatial and temporal variations of phytoplanktonic biomass in the Mundaú reservoir, Northeastern Brazil.
Cyanophyta, Dinophyta and Euglenophyta. Cyanophyta – the dominant group (Tab. 3), with more than 80% of total biomass – was the only group displaying significant differences in depth, particularly in E1. Biomass values were significantly higher at the subsurface (F = 18.255,
p < 0.01). There were differences in total biomass
between seasons, with less biomass in the rainy season (Fig. 1). In the dry season, the increase of phytoplankton biomass occurred beginning at 12 am, reaching its highest values at the first daylight, especially in E1
(Fig. 1). Higher biomass in the rainy season was registered in E1 during daylight hours until 8 pm, with a
reduction beginning at 12 am to 4 am (Fig. 1).
Cylindrospermopsis raciborskii (Woloszinska)
Seenayya et Subba-Raju, Geitlerinema amphibium
(Agardh ex Gomont) Anagnostidis, Cyclotella
meneghiniana Kützing and Synedra rumpens Kützing
displayed higher biomasses in the dry season, whereas
Microcystis aeruginosa (Kützing) Kützing, M. flos-aquae
(Wittrock) Kirchner, Chlorella vulgaris Chodat and
Cryptomonas ovata Ehrenberg displayed higher
biomasses in the rainy season (Tab. 3).
C.raciborskii was the dominant species throughout
the study (Tab. 3). In the dry season, this species had statistical differences as a function of depth at both sampling sites (FE1 = 18.945 and FE2 = 8.291; p < 0.05
and p < 0.01, respectively), with higher biomass at the
subsurface in E1 and near the sediment in E2. This species had higher biomass values in the dark hours in E1 and in
the daylight hours in E2. In the rainy season, differences
were only detected in E1 and C. raciborskii had a higher
biomass at the subsurface, with an opposite light-dark pattern than that observed in the dry season.
S. rumpens was subdominant in the dry season, with
biomasses higher than 5% of total biomass average in both sampling periods and seasons. C. meneghiniana
contributed with 5% of the total biomass in E1, particularly near the sediment. However, S. rumpens
displayed significant horizontal differences, with the biomass enhanced in E2 (F = 24.959, p < 0.001).
C. raciborskii was dominant in the rainy season, followed
by M. aeruginosa, particularly at the subsurface in both
seasons. Other taxa, such as M. flos-aquae, C. ovata
and S. rumpens, were also important, with biomasses
higher than 5% of total biomass average at least at one of the depths or sampling stations. M. flos-aquae and
C. ovata were more abundant at the subsurface, with
C. ovata having a more significant biomass in E2. Among
subdominant species, only C. ovata and M. flos-aquae
exhibited a light-dark pattern. C. ovata had higher
biomass during daylight hours, particularly at the subsurface. M. flos-aquae had higher biomass during
dark hours, except in E1 during the dry season.
The results from the Canonical Correspondence Analysis are displayed in Tab. 4 and 5 as well as Fig. 2 and 3. The Monte Carlo test proved significant (p < 0.01). There were relationships between
environmental variables and biological information.
E1 – Dry season E2 – Dry season
E1 – Dry season E2 – Dry season
mg.L
-1
mg.L
-1
mg.L
-1
mg.L
-1
100 80
60
40
20
100 80
60
40
20
0
100 80
60
40
20 0
100 80
60
40
20
0
8 am 12 pm 4 pm 8 pm 12 pm 4 pm 8 am 12 pm 4 pm 8 pm 12 pm 4 pm
Acta bot. bras. 22(4): 970-982. 2008.
975
Table 3. Phytoplanktonic species and average biomass (µg.L-1) observed in the Mundaú reservoir, Northeastern Brazil. (-) dates without sampling.
E1 Dry season E2 Dry season E1 Rainy season E2 Rainy season
Species 0.1 m 8 m 0.1 m 2 m 0.1 m 8 m 0.1 m 2 m
Light Dark Light Dark Light Dark Light Dark Light Dark Light Dark Light Dark Light Dark
BACILLARIOPHYTA
Aulacoseira granulata (Ehrenberg) - 37 - - - 71 - - -
-Simonsen
A. granulata var. angustissima Müller 38 39 - 29 56 - 19 - - 38 - - - 18 Cyclotella meneghiniana Kützing 1886 1608 1304 1506 1435 1674 2094 1388 347 303 131 128 354 362 105 282
Diploneis ovalis (Hilse) Clève - 23 - 23 - - 91 - - -
-Eunotia major (Wm Smith) Rabenhorst - - - 249 19 20 - - - -
-E. monodon Ehrenberg - 75 - - -
-Gomphonema augur Ehrenberg - - - 16 - - 32 - - - -
-Navicula cuspidata Kützing - - - 19 - 32 - - - - 22
Nitzschia palea (Kützing) W. Smith - 113 152 222 284 148 226 190 74 - 76 - - - - 145
Pleurosigma sp. - - - 74 - - -
-Synedra rumpens Kützing 2680 2669 2433 2452 4357 4756 5266 4222 134 349 513 204 141 217 205 222
CHLOROPHYTA
Actinastrum hantzschii Lagerheim - - 1 - 5 - - - - 6 6 - 5 11 - 3
Ankistrodesmus gracilis (Reinsch) Korsikov - 1 - 1 - - - - 4 - - -
-Botryococcus protuberans W. West & 428 147 587 - - - -G.S. West
Chlorella vulgaris Chodat 63 69 41 58 677 502 342 185 406 492 474 400 457 261 289 256 Closteriopsis acicularis (G.M. Smith) Belch - 2 - - 11 - 7 - - -
-& Swale
Closterium parvulum Nägeli 201 152 168 176 195 147 228 141 75 50 - 75 72 - 48 100
Coelastrum microporum Nägeli 87 - 15 15 - - - 30 29 29 - - -
-C. pseudomicroporum Korsikov 167 100 149 133 - 22 114 92 89 111 44 67 128 107 22 66
Crucigenia quadrata Morren 67 58 10 35 6 6 77 42 51 51 56 12 18 - - 7
Dictyosphaerium ehrenbergianum Nägeli - - - - 18 36 5 9 - - - - 4 9 4
-D. pulchellum Wood 13 28 24 17 30 15 41 40 15 10 20 18 12 7 11 6
Golenkinia radiata Chodat - - -
-Kirchneriella lunaris (Kirchn.) Möebius 2 1 - 1 11 11 4 1 6 9 1 1 4 2 5 3
K. obesa (W. West) Schmidle 15 14 6 9 13 21 8 11 6 7 2 2 9 9 4 7
Monoraphidium arcuatum (Korsikov) 11 6 6 14 43 50 29 10 21 71 28 35 49 39 52 56 Hindák
M. circinale (Nygaard) Nygaard 3 4 4 4 1 1 2 3 - - -
-M. contortum (Thuret) 34 23 71 62 24 27 58 67 19 26 6 7 14 18 21 19
Komárkova-Legnerová
M. griffithi (Berkel) Komárkova-Legnerová 7 4 3 6 2 6 15 14 24 18 7 15 13 7 10 10
Dantas, Moura, Bittencourt-Oliveira,
Arruda Neto & Cavalcanti:
Temporal variation of the phytoplankton...
976
Tabela 3 (continuação)
E1 Dry season E2 Dry season E1 Rainy season E2 Rainy season
Species 0.1 m 8 m 0.1 m 2 m 0.1 m 8 m 0.1 m 2 m
Light Dark Light Dark Light Dark Light Dark Light Dark Light Dark Light Dark Light Dark
Oocystis lacustris Chodat - - - - 1 3 5 - - - 57 10 - - -
-Pediastrum tetras (Ehrenberg) A. Braun - - -
-Scenedesmus acuminatus (Langeheim) 15 - 4 - - 7 - 8 15 8 8 30 22 - - 15
Chodat
S. acuminatus var. bernardii (G. M. Smith) - - - 3 - 3 8 - 3 5 3 - 3
Dedussenko
S. acutus Meyen - - - 8
S. arcuatus Lemmermann 1 3 - - - 7 6 3 - - -
-S. bernardii G. M. Smith - - 5 - - - - 9 9 - - - - 9 9
-S. bicaudatus (Hansgirg) Chodat - - 5 3 - - 4 9 - - - 2
S. ecornis (Ehrenberg) Chodat - 2 2 2 - - 3 - - - 2 - 3 - -
-S. quadricauda (Turpin) Brébisson 7 7 16 4 13 48 14 21 18 31 14 9 43 17 17 9
S. quadricauda var. parvus G. M. Smith 48 26 33 28 18 22 11 38 4 11 2 2 2 - 6 4
Scenedesmus sp. - - - 4 - 18 - - - 4 -
-Tetraedron caudatum (Corda) Hansgirg - - - 1 - - - 4 - - -
-T. gracile (Reinsch) Hansgirg 38 - - -
-T. incus (Teiling) G. M. Smith 10 12 14 17 24 3 7 10 - 3 - - -
-T. mediocris Hindák - 2 - - - - 2 2 - - -
-T. minimum (A. Braun) Hansgirg 16 35 65 51 24 20 65 35 28 24 4 8 4 16 8
-T. triangulare (Chodat) Komárek 35 39 25 26 27 12 25 23 15 12 6 3 12 6 18 6
T. victoriae Wolosynska - - - 73 - - -
-Tetrastrum elegans Playfair 6 3 55 35 18 6 26 16 13 19 6 31 - 6 6 13
CYANOPHYTA
Chroococcus limneticus Lemmermann - - - - 73 42 37 3 26 21 16 16 15 16 26 32
C. minutus Kützing 28 33 21 30 10 12 18 17 11 10 9 11 20 6 10 4
C. turgidus Kützing 33 62 21 24 104 106 64 22 51 85 85 61 313 153 184 80 Cylindrospermopsis raciborskii (Wolz.) 53238 55465 23438 29849 41018 38808 59439 49189 31242 25563 9310 11868 18380 19014 18382 19626
Seenayya et Subba-Raju
Geitlerinema amphibium (Agardh ex 550 642 1350 939 323 361 805 874 578 541 394 333 409 386 438 574 Gomont) Anagnostidis
Merismopedia minima Beck 17 13 41 38 5 2 13 19 7 6 10 1 4 2 1 3
M. punctata Meyen 263 250 251 242 84 182 240 281 112 104 297 379 79 38 80 91
Microcystis aeruginosa (Kützing) Kützing 1661 795 831 741 129 221 775 1553 1257 1571 398 788 1422 1309 2104 1031 M. flos-aquae (Wittrock) Kirchner 848 125 187 61 - 242 612 550 848 1937 241 363 232 838 843 729
M. panniformis Komárek et al. - - - 39 - - -
-M. wesenbergii (Komárek) Komárek - - - 190 98 - 182 95 91 -Pseudanabaena catenata Lauterborn 268 149 8 8 15 7 85 19 53 68 - - 29 15 67 31
Raphidiopsis mediterranea Skuja 1606 1042 103 286 459 406 1113 1384 1014 928 186 334 754 487 714 813
Spirulina sp. - - -
Acta bot. bras. 22(4): 970-982. 2008.
977
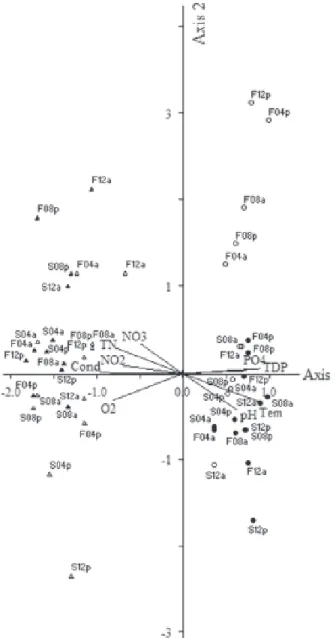
Eigenvalues of Axis 1 and 2 explain 27.4% of the biological data variance. The correlation of the species with environmental conditions was high on both axes.
CCA Axis 1 clearly split the seasons. The sampling units in the dry period were positively related to the axis, whereas those in the rainy period were negatively related. Taking into account the intra-set correlation, the variables positively associated to Axis 1 were temperature, pH, total dissolved phosphorus and orthophosphate, and a grouping of sampling units in the dry season was observed. These environmental variables had higher values in this season (Tab. 1 and 2). The chlorophyta
Closterium parvulum Nägeli, Monoraphidium contortum
(Thret) Komárkova-Legnerová and Scenedesmus
quadricauda var. parvus G.M. Smith,cyanobacteria such
as Cylindrospermopsis raciborskii and the diatoms
Aulacoseira granulata (Ehrenberg) Simonsen, Cyclotella
meneghiniana and Synedra rumpens all displayed higher
biomasses in the dry season (Tab. 3).
Dissolved oxygen, electrical conductivity, total nitrogen and nitrite were negatively associated to Axis 1 and a grouping of sampling units in the rainy period was
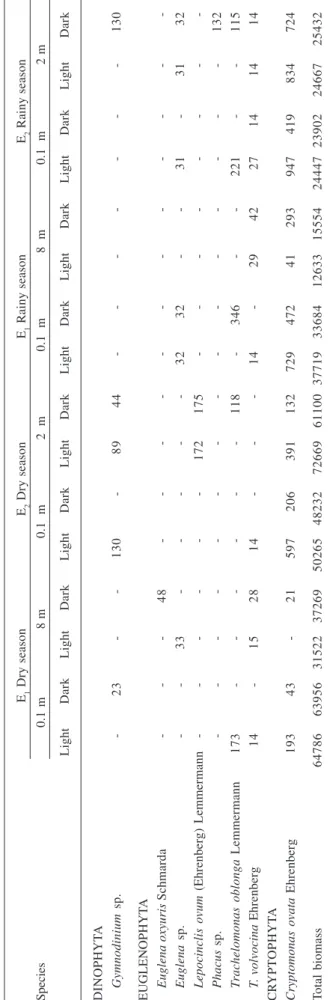
Tabela 3 (continuação)
E1 Dry season E2 Dry season E1 Rainy season E2 Rainy season Species 0.1 m 8 m
0.1 m
2 m
0.1 m
8 m
0.1 m
2 m Light Dark Light Dark Light Dark Light Dark Light Dark Light Dark Light Dark Light Dark DINOPHYT A Gymnodinium sp. -23 -130 -89 44 -130 EUGLENOPHYT A Euglena oxyuris Schmarda -48 -Euglena sp. -33 -32 32 -31 -31 32 Lepocinclis ovum (Ehrenberg) Lemmermann -172 175 -Phacus sp. -132 T rachelomonas oblonga Lemmermann 173 -118 -346 -221 -115 T . volvocina Ehrenber g 14 -15 28 14 -14 -29 42 27 14 14 14 CR YPT OPHYT A Cryptomonas ovata Ehrenberg 193 43 -21 597 206 391 132 729 472 41 293 947 419 834 724 Total biomass 64786 63956 31522 37269 50265 48232 72669 61100 37719 33684 12633 15554 24447 23902 24667 25432
Table 4. Statistical synthesis of the CCA first two axes performed in the Mundaú reservoir Northeastern Brazil.
Axis 1 Axis 2
Eigenvalue 0.062 0.015
Variance percentage explained 22.0 5.4 Variance percentage accumulated 22.0 27.4 Pearson correlation (species-environment) 0.934 0.844 Monte Carlo test
Eingenvalues – p 0.01 0.03
Correlations species-environment 0.01 0.01
Table 5. Canonic coefficients and intra-set correlation of the environmental variables for the axis 1 and 2 in the Mundaú reservoir Northeastern Brazil.
Canonical Correlation coefficient coefficient (intra-set) Axis 1 Axis 2 Axis 1 Axis 2
Temperature 0.208 -1.396 0.884 -0.320
Dissolved oxygen -0.071 -0.376 -0.810 -0.313 Electric conductivity -0.339 0.601 -0.964 0.018
Turbidity -0.154 -1.356 -0.490 -0.163
pH 0.050 1.172 0.626 -0.411
Total nitrogen -0.087 0.731 -0.769 0.299
Nitrate -0.086 -0.230 -0.490 0.344
Nitrite 0.108 0.008 -0.706 0.095
Dantas, Moura, Bittencourt-Oliveira, Arruda Neto & Cavalcanti: Temporal variation of the phytoplankton...
978
Figure 2. CCA ordination of the sampling unities, on the basis of the environmental variables of the Mundaú reservoir, Northeastern Brazil. The unities were identified according with the sampling station and the season period. ™ = E1 Dry; ˜ = E2 Dry; r = E1 Rainy; p = E2 Rainy. The unities identification respectively corresponds to the depths (S = Subsurface; B = Bottom) and daylight (8 am, 12 pm and 4 pm) and dark (8 pm, 12 am and 4 am) hours. Abbreviations: Cond = Electrical conductivity; NO2 = Nitrite; NO3 = Nitrate; O2 = Dissolved oxygen; pH = pH; PO4 = Orthophosphate; Tem = Temperature; TN = Total nitrogen; TDP = Total dissolved phosphorus; TP = Total phosphorus; Tur = Turbidity.
observed. These environmental variables had higher values in this period (Tab. 1 and 2). The Chlorophyta
Chlorela vulgaris, Monoraphidium arcuatum (Korsikov)
Hindák and M. griffithii (Berkel) Komárkova-Legnerová,
the cyanobacteria Chroococcus turgidus Kützing,
Microcystis aeruginosa and M. flos-aquae, and
phytoflagellates such as Cryptomonas ovata and
Trachelomonas volvocina Ehrenberg displayed higher
biomasses in the rainy period (Tab. 3).
Spatial and temporal variations (between hours) were observed on Axis 2. Spatial differences between sampling stations were more pronounced in the dry season, whereas differences between the light and dark hours were more pronounced in the rainy period. The variables positively associated to Axis 2 were pH and total phosphorus, whereas turbidity and temperature were negatively associated to the axis. In the dry season, E1 exhibited vertical differences and the CCA Axis 2 separated the sampling units from the subsurface and bottom, which were negatively and positively associated to the axis, respectively. Vertical differences were not observed in E2 and all sampling units from this station
were grouped in the CCA and negatively associated to Axis 2. In the dry period, the algae with higher biomasses in E1 were mostly the cyanobacteria Chroococcus minutus
Kützing, C. raciborskii, Geitlerinema amphibium and
Pseudanabaena catenata Lauterborn. Of these, only
G. amphibium had higher biomasses at the bottom. The
algae in E2 with higher biomasses were the Chlorophyta
C. vulgaris, M. arcuatum and Scenedesmus quadricauda
(Turpin) Brébisson, the cyanobacteria Chroococcus
limneticus Lemmermannand C. turgidus,diatoms such
as S. rumpens, and phytoflagellates such as C. ovata
(Tab. 3).
CCA Axis 2 for the rainy season separated the sampling units from the light and dark hours, which were negatively and positively associated to the axis, respectively. The algae in this period with higher biomasses during daylight hours were the Chlorophyta
Dictyosphaerium pulchellum Wood, Scenedesmus
quadricauda and Tetraedron triangulare (Chodat)
Komárek and phytoflagellates such as Cryptomonas
ovata. Cyanobacteria such as Microcystis flos-aquae and
the Chlorophyta Coelastrum pseudomicroporum
Korsikov, Monoraphidium arcuatum, M. contortum,and
Tetrastrum elegans Playfair had higher biomasses during
dark hours (Tab. 3).
Discussion
Acta bot. bras. 22(4): 970-982. 2008.
979
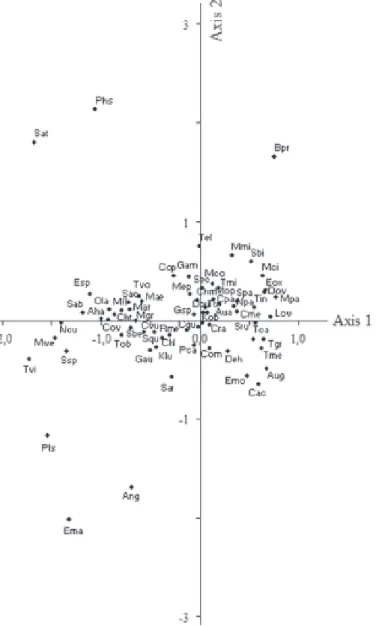
Figure 3. CCA ordination of the phytoplanktonic species found in the Mundaú reservoir, Northeastern Brazil. Abbreviations: Aha = Actinastrum hantzschii; Ang = Ankistrodesmus gracilis; Aug = Aulacoseira granulata; Aua = A.granulata var. angustissima; Bpr = Botryococcus protuberans;
Cac = Closteriopsisacicularis; Chl = Chroococcuslimneticus; Chm = C. minutus; Cht = C. turgidus; Cme = Cyclotellameneghiniana;
Com = Coelastrummicroporum; Cop = C. pseudomicroporum; Cov = Cryptomonasovata; Cpa = Closteriumparvulum; Cqu = Crucigenia quadrata; Cra = Cylindrospermopsisraciborskii; Cvu = Chlorellavulgaris; Deh = Dictyosphaeriumehrenbergianum; Dpu = D. pulchellum;
Dov = Diploneisovalis; Ema = Eunotiamajor; Emo = E. monodon; Eox = Euglenaoxyuris; Esp = Euglena sp.; Gam = Geitlerinemaamphibium;
Gau = Gomphonemaaugur; Gra = Golenkiniaradiata; Klu = Kirchneriellalunaris; Kob = K. obesa; Lov = Lepocinclisovum; Mae = Microcystis aeruginosa; Mar = Monoraphidiumarcuatum; Mci = M. circinale; Mco = M. contortum; Mep = Merismopediapunctata; Mfl = Microcystis flos-aquae; Mgr = Monoraphidiumgriffithii; MMi = Merismopediaminima; Mop = Monoraphidiumpusillum; Mpa = Microcystispanniformis;
Mwe = M. wesenbergii; Ncu = Naviculacuspidata; Npa = Nitzschiapalea; Ola = Oocystislacustris; Pca = Pseudanabaenacatenata; Phs = Phacus
sp.; Pls = Pleurosigma sp.; Pte = Pediastrum tetras; Rme = Raphidiopsismediterranea; Sab = Scenedesmusacuminatus var. bernardii; Sac = S. acuminatus; Sar = S. arcuatus; Sat = S. acutus; Sbe = S. bernardii; Sbi = S. bicaudatus; Sec = S. ecornis; Squ = S. quadricauda;
Spa = S. quadricauda var. parvus; Sps = Spirulina sp.; Sru = Synedrarumpens; Ssp = Scenedesmus sp.; Tca = Tetraedroncaudatum; Tel = Tetrastrum elegans; Tgr = Tetraedrongracile; Tin = T. incus; Tme = T. mediocris; Tmi = T. minima; Tob = Trachelomonas oblonga; Ttr = Tetraedron triangulare; Tvi = T. victoriae; Tvo = Trachelomonasvolvocina.
particularly phosphorus (Watson et al. 1997) and low
N:P ratio (Smith 1983). Such conditions are found in the Mundaú reservoir and explain the development of substantial cyanobacteria biomass in this system.
Nostocales, Oscillatoriales and Chroococcales all occur in the Mundaú reservoir. Nostocales species
Dantas, Moura, Bittencourt-Oliveira, Arruda Neto & Cavalcanti: Temporal variation of the phytoplankton...
980
heterocytes, results in a decreased availability of luminosity, thereby accelerating the succession process. The Nostocales nitrogen pool is then released for the Oscillatoriales by means of cell membrane disruption.
The above-mentioned conditions enable the occurrence of a considerable development of species that are able to fix nitrogen and tolerate low luminosity (Pádisák & Reynolds 1998; Dokuil & Teubner 2000).
Cylindrospermopsisraciborskii has been reported as an
opportunistic species (Istvánovics et al. 2000) able to
maintain perennial populations, particularly in tropical systems (Briand et al. 2002). Due to its similarity to the
ecology of Oscillatoriales, Pádisak & Reynolds (1998) moved this species to a new assemblage (denominated Sn), characterized by living in hot, de-stratified systems, while capable of tolerating low luminosity and low nitrogen concentrations. The strategies facilitating dominance of this taxa include: 1) proliferation at high temperatures; 2) first choosing NH3 and NO3 (Saker et al.
1999); 3) affinity and stocking of phosphorus (Istvánovics et al. 2000); 4) frequently reported as
herbivore resistant (Fabbro & Duivenvoorden 1996); and 5) the ability to regulate its position in the water column, mostly during thermally stratified periods (Pádisak 1997). We may therefore consider this species an R-strategist, which has developed under the favorable conditions in the reservoir investigated.
The most representative colony-forming taxa of cyanobacteria in the Mundaú reservoir belong to the
Microcystis genus. The blooming formation of species
from this genus is related to the occurrence of anoxia near the sediment (Reynolds 1984). Sediment anoxia is responsible for the non-stop release of phosphorus from the sediment, which favors the maintenance of
Microcystis blooms at the subsurface of the system
(Calijuri & Dos Santos 1996). Microcystis dominance in
tropical systems may be favored by changes in the mixture throughout the day (Reynolds et al. 1987).
Microcystis species are well known to be generally highly
toxic algae, responsible for a number of public health problems. The most worldwide-known incidents took place in the northeastern region of Brazil, where
Microcystis blooms killed fish and shrimp in the state of
Rio Grande do Norte (Chellappa et al. 2000) and led to
death over 70 patients in a dialysis clinic in Caruaru, Pernambuco (Jochimsen et al. 1998). However, blooms
of species from the Microcystis genus were massively
replaced by Cylindrospermopsis raciborskii, particularly
in the southeastern region of Brazil, as observed in the Juturnaíba reservoir, Rio de Janeiro (Marinho & Huszar 2002) and the Garças reservoir in São Paulo (Tucci & Sant’Anna 2003). This species has been well documented as the cause of blooms in the northeastern region (Bouvy
et al. 2000; Huszar et al. 2000), including the Mundaú
reservoir (Moura et al. 2007).
Chlorophyta were represented particularly by Chlorococcales, which are generally small in size while having a high surface/volume ratio. This favors the nutrient absorption, thereby allowing adaptive advantages, especially in oligotrophic waters (Negro et al. 2000).
Based on the phytosociological assemblages proposed by Reynolds (1997), the green algae found in the Mundaú reservoir, such as Chlorellavulgaris and Monoraphidium
contortum, are grouped within the X1 assemblages.
Therefore, they are found in shallow, mixed, stratified environments and are not sensitive to nutrient shortages. The importance of Bacillariophyta in eutrophic systems is enhanced by changes in nutrient availability and water transparency (Sommer 1988). S. rumpens and
C. meneghiniana (the taxa present in the reservoir
investigated) are typical of shallow, turbid, enriched systems (especially S. rumpens), but are generally
sensitive to nutrient depletion. Sommer (1988) states that diatoms are excellent competitors for reactive soluble phosphorus and this could explain the occurrence of higher densities of these algae in the dry seasons. Tilman & Kilham (1976) found that Cyclotella meneghiniana
has a greater dependency on phosphorus when compared to silicates. This corroborates our observations in the Mundaú reservoir, particularly in the dry season.
Cryptomonas ovata had the highest greater number
of individuals among the flagellates. This species belongs to the Y functional group (Reynolds 1997), which is usually found in eutrophic systems and is resistant to poor luminosity. A greater biomass of this taxon in the reservoir investigated occurred in the rainy season, when thermal stratification is absent. This finding is in agreement with Romo & Miracle (1995), who observed that the development of Cryptomonas populations come
about immediately following the occurrence of rains, as rain is responsible for the circulation of water throughout the water column and the re-suspension of nutrients trapped in the sediment.
The Canonical Correspondence Analysis revealed that the development of the phytoplankton community in the dry season was mainly influenced by the availability of phosphorus. The positive correlations between biotic variables and phosphorus products strongly suggest that bottom-up effects play a role in phytoplankton biomass control.
Acta bot. bras. 22(4): 970-982. 2008.
981
had biomasses with significant vertical differences between depths, with higher values at the subsurface, particularly for Cylindrospermopsis raciborskii. Although
the dominance of C. raciborskii persisted in the littoral
zone, a higher abundance of diatoms was observed, particularly Synedra rumpens and cocoid chlorophyta.
The algae biomass decrease in the rainy season was driven by events associated to thermal de-stratification and chemical stratification, especially dissolved oxygen and nitrogen. Phytoplankton development was influenced by an increase in allochtonous particulate nutrients, which gave rise to community reorganization events, thereby contributing to the establishment of
C. raciborskii and species from the Microcystis genus.
Water temperature and phosphorus were generally the abiotic variables with a greater influence over both spatial distribution (pelagic/littoral zones and depths) and temporal distributions (times of the day and seasons) of the phytoplankton community in the Mundaú reservoir in northeastern Brazil. In the present study, the demineralization of phosphorus during the dry season contributed toward the re-suspension of diatom frustules. In the rainy season, the circulation of the water column and increase in particulate elements, which were responsible for the low availability of resources, explained the development of the large biomass of Cryptomonas
ovata and Microcystis species. C.raciborskii was the
species that most stood out in the Mundaú reservoir for being predominant in both seasons. The establishment of cyanobacteria blooms, mainly made up of
C. raciborskii, was more pronounced in the dry season,
which certainly occurred due to the high availability of phosphorus, low NO3 levels, limited nitrogen, alkaline
pH and thermal stability of the system.
Acknowledgements
We are grateful for the grants from Programa de Pós Graduação em Botânica (PPGB) of the Universidade Federal Rural de Pernambuco (UFRPE) and from the Conselho Nacional de Desenvolvimento Científico (CNPq), Processes 130109/2004-5, 503850/2003-9 as well as the grants to ANM (300612/2005-20).
References
Ayres, M.; Ayres Júnior, M.; Ayres, D.L. & Dos Santos, A.A. 2003.
Software BioEstat, aplicações estatísticas nas áreas das ciências biomédicas. Versão 3.0. Belém, Sociedade Civil Mamirauá/ MCT/ CNPq.
Bouvy, M.; Molica, R.; De Oliveira, S.; Marinho, M. & Becker, B. 1999. Dynamics of a toxic cyanobacterial bloom (Cylindrospermopsis raciborskii) in a shallow reservoir in the
semi-arid region of northeast Brazil. Aquatic Microbial Ecology 20: 285-297.
Bouvy, M.; Falcão, D.; Marinho, M.; Pagano, M. & Moura, A. 2000. Occurrence of Cylindrospermopsis (Cyanobacteria) in 39
brazilian tropical reservoirs during the 1998 drought. Aquatic Microbial Ecology 23: 13-27.
Bouvy, M.; Molica, R.; Oliveira, S.; Marinho, M. & Beker, B. 2001. Effects of a cyanobacterial bloom (Cylindrospermopsis raciborskii) on bacterial and zooplankton communities in
Ingazeira reservoir (Northeast, Brazil). Aquatic Microbial Ecology 25: 215-227.
Briand, J.F.; Robillot, C.; Quiblier-Llobéras, C.; Humbert, J.F.; Couté, A. & Bernard, C. 2002. Environmental context of
Cylindrospermopsis raciborskii (Cyanobacteria) blooms in a
shallow pond in France. Water Research 36: 3183-3192. Briand, J.F.; Lebourlanger, C.; Humbert, J.; Bernard, C. & Dufour, P.
2004. Cylindrospermopsisraciborskii (Cyanobacteria) invasion
at mid-latitudes: selection, wide physiological tolerance, or glo-bal warming? Journal of Phycology 40: 231-238.
Calijuri, M.C. & Dos Santos, A.C.A. 1996. Short-term changes in the Barra Bonita reservoir (São Paulo, Brazil): emphasis on the phytoplankton communities. Hydrobiologia 330: 163-175.
Chellappa, N.T. & Costa, M.A.M. 2003. Dominant and co-existing epecies of Cyanobacteria from a eutrophicated reservoir of Rio Grande do Norte State, Brazil. Acta Oecologica 24: S3-S10. Chellappa, N.T.; Costa, M.A.M. & Marinho, I.R. 2000. Harmful
cyanobacterial blooms from semiarid freshwater ecosystems of North-East Brazil. Australian Society of Limnology38: 45-49. Dokuil, M.T. & Teubner, K. 2000. Cyanobacterial dominance in
lakes. Hydrobiologia 438: 1-12.
Edler, L. 1979. Recommendations for marine biological studies in the Baltic Sea: phytoplankton and chlorophyll. The Baltic Marine Biologists 5: 1-38.
Fabbro, L.D. & Duivenvoorden, L.J. 1996. Profile of a bloom of the cyanobacteria Cylindrospermopsis raciborskii (Wolozysnska) Seenaya and Subba Raju in the Fitzroy River in tropical center Queensland. Marine and Freshwater Research 47: 685-694.
Golterman, H.; Clymo, R.S. & Ohnstad, M.A.M. 1971. Methods for physical and chemical analysis of freshwaters. 2nd ed, Oxford, Blackwell Scientific Publications.
Hasle, G.R. 1978. The inverted-microscope methods. Pp. 88-96. In: A. Sournia (ed.). Phytoplankton manual. Paris, UNESCO.
Hecky, R. & Kling, H.J. 1987. Phytoplankton ecology of the great lakes in the rift valleys of central Africa. Archiv für Hydrobiologie Beihefte Ergebnisse der Limnologie 25: 197-228.
Huszar, V.L.M. & Caraco, N.F. 1998. The relationship between phytoplankton composition and physical-chemical variables: a comparison of taxonomic and morphological-functional descriptors in six temperate lakes. Freshwater Biology 40: 679-696.
Huszar, V.L.M. & Reynolds, C.S. 1997. Flood-plain lake (Lago Ba-tata, Pará, Brazil): responses to gradual environmental change.
Hydrobiologia 346: 169-181.
Huszar, V.L.M.; Silva, L.H.S.; Marinho, M.; Domingos, P. & Sant’Anna, C.L. 2000. Cyanoprokaryote assemblages in eight productive tropical Brazilian waters. Hydrobiologia 424: 67-77.
Istvánovics, V.; Shafik, H.M.; Préssing, M. & Juhos, S. 2000. Growth and phosphate uptake kinetics of the cyanobacterium
Cylindrospermopsisraciborskii (Cyanophyceae) in a throughflow cultures. Freshwater Biology 43: 257-275.
Jochimsen, E.M.; Carmichael, W.W.J.; Cardo, D.M.; Cookson, S.T.; Holmes, C.E.M.; Antunes, B.C.; Melo Filho, D.A.; Lyra, T.M.; Barreto, V.S.T.; Azevedo, S.M.F.O. & Jarvis, W.R. 1998. Liver failure and death after exposure to microcystins at a hemodialysis center in Brazil. New England Journal Medicine 338: 873-878.
Dantas, Moura, Bittencourt-Oliveira, Arruda Neto & Cavalcanti: Temporal variation of the phytoplankton...
982
Komárek, J. & Anagnostidis, K. 1999. Cyanoprokaryota. 1. Teil: Chroococcales. In: H. Ettl; G. Gärtner; H. Heynig & D. Mollenhauer (eds.). Süsswasserflora von Mitteleuropa. Stutgart, Gustav Fischer.
Komárek, J. & Anagnostidis, K. 2005. Cyanoprokaryota 2. Teil:
Oscillatoriales. Pp. 1-759. In:B. Bridel; G.L. Gastner & M.S. Krienitz (eds.). Süßwasserflora von Mitteleuropa. 19/2. London, Elsevier.
Lopes, M.R.M.; Bicudo, C.E.M. & Ferragut, C. 2005. Short term spatial and temporal variation of phytoplankton in a shallow tropical oligotrophic reservoir, southeast Brazil. Hydrobiologia 542: 235-247.
Mackereth, J.J.H.; Heron, J. & Talling, J.F. 1978. Water analysis: some revised methods for limnologists. Scientific Publication n° 36, London, Freshwater Biological Association.
Margalef, R. 1983. Limnologia. Barcelona, Omega, S.A. Marinho, M.M. & Huszar, V.L.M. 2002. Nutrient availability and
physical conditions as controlling factors of phytoplankton composition and biomass in a tropical reservoir (Southeastern Brazil). Archiv für Hydrobiologie 153: 443-468.
McCune, B. & Mefford, M.J. 1999. PC-ORD for Windows: multivariate analysis of ecological data. MjM Software, Oregon, Gleneden Beach.
Melo, S. & Huszar, V.L.M. 2000. Phytoplankton in an Amazonian flood-plain lake (Lago Batata, Brazil): diel variation and species strategies. Journal of Plankton Research 22: 63-76. Molica, R.J.R.; Oliveira, E.J.A.; Carvalho, P.V.V.C.; Costa, A.N.S.F.;
Cunha, M.C.C.; Melo, G.L. & Azevedo, S.M.F.O. 2005. Occurrence of saxitoxins and an anatoxin-a(s)-like anticholinesterase in a Brazilian drinking water supply. Harmful Algae 4: 743-753.
Moura, A.N.; Bittencourt-Oliveira, M.C.; Dantas, E.W. & Arruda Neto, J.D.T.2007.Phytoplanktonic Associations: A Tool to Understand Dominance Events in a Tropical Brazilian Reservoir.
Acta Botanica Brasilica21: 641-648.
Negro, A.I.; De Hoyos, C. & Veja, J. C. 2000. Phytoplankton structure and dynamics in Lake Sanabria and Valparaíso reservoir (NW Spain). Hydrobiologia 424: 25-37.
Padisák, J. 1997. Cylindrospermopsis raciborskii (Woloszynska) Seenayya et Subba Raju, an expanding, highly adaptative cyanobacterium: worldwide distribution and review of its ecology.
Algological Studies 107: 563-593.
Padisák, J. & Reynolds, C.S. 1998. Selection of phytoplankton assemblages in lake Balaton, Hungary, in response to eutrophication and restoration measures, with special reference to the cyanoprokariotes. Hydrobiologia 384: 41-53.
Ramirez, J.J. & Bicudo, C.E.M. 2002. Variation of climatic and physical co-determinants of phytoplankton community in four nictemeral sampling days in a shallow tropical reservoir, southeastern Brazil. Brazilian Journal of Biology 62: 1-14. Ramirez, J.J. & Bicudo, C.E.M. 2005. Diurnal and spatial (vertical) dynamics of nutrient (N, P, Si) in four sampling days (summer, fall, winter and spring) in a tropical shallow reservoir and their relationships with the phytoplankton community. Brazilian Journal of Biology 65: 141-157.
Reynolds, C.S. 1984. Phytoplankton periodicity; the interactions of form, function and environmental variability. Freshwater Biology 14: 111-142.
Reynolds, C.S. 1997. Vegetation processes in the pelagic: a model for ecosystem theory. Oldendorf, Ecology Institute. Reynolds, C.S. & Walsby, A.E. 1975. Water blooms. Biological
Reviews 50: 437-81.
Reynolds, C.S.; Olivier, R.L. & Walsby, A.E. 1987. Cyanobacterial dominance: the role of buoyancy regulation in dynamic lake environments. New Zeland Journal of Marine and Freshwater Research 21: 379-390.
Romo, S. & Miracle, M.R. 1995. Diversity of the phytoplankton assemblages of a polimitic hypertrophic lake. Archiv für Hydrobiologie 132: 363-384.
Round, F.E.; Crawford, R.M. & Mann, D.G 1990. The Diatoms. Biological & morphology of the genera. Cambridge, Cambridge University Press.
Saker, M.L.; Neilan, B.A. & Griffiths, D.J. 1999. Two morphological forms of Cylindrospermopsis raciborskii (Cyanobacteria) isolated from Solomon Dam, Palm Island, Queensland. Journal of Phycology 35: 599-606.
Sant’Anna, C.L. 1984. Chlorococcales (Chlorophyceae) do Estado de São Paulo, Brasil. Bibliotheca Phycologica 67: 1-348.
Shapiro, J. 1990. Current beliefs regarding dominance of blue-greens: the case for importance of CO2 and pH. Verhandlungen der
Internationalen Vereinigung für Theoretische und Angewandte Limnologie 24: 38-54.
Smith, V.H. 1983. Low nitrogen to phosphorus ratios favor dominance by blue-green algae in lake phytoplankton. Science 221: 669-671.
SRH (Secretaria de Recursos Hídricos de Pernambuco) 2000. Plano Estadual de Recursos Hídricos do Estado de Pernambuco
– Documento Síntese, Recife.
Strahler, A. 1986. Geografia Física. Barcelona, Omega, S.A. Straskraba, M. & Tundisi, J.G. 2000. Diretrizes para o
gerenciamento de lagos: gerenciamento da qualidade dos lagos. São Carlos, ILEC/IIE.
Strickland, J.D. & Parsons, T.R. 1965. A manual of sea water analysis.
Bulletin of the Fisheries Research Board of Canada 125: 1-185.
Sommer, U. 1988. Growth and survival strategies of plankton succession. Pp 57-106. In: U. Sommer (ed.). PlanktonEcology – Succession in Plankton Communities. Springer Series of
Contemporary Bioscience.
Tilman, D. & Kilham, S.S. 1976. Phosphate and silicate uptake and growth kinetics of the diatoms Asterionella formosa and
Cyclotella meneghiniana in batch and semi-continuous culture.
Journal of Phycology 12: 375-383.
Tucci, A. & Sant’Anna, C.L. 2003. Cylindrospermopsisraciborskii
(Woloszynska) Seenayya & Subba Raju (Cyanobacteria): varia-ção semanal e relações com fatores ambientais em um reserva-tório eutrófico, São Paulo, SP, Brasil. Revista Brasileira de Botânica 26: 97-112.
Valderrama, G.C. 1981. The simultaneous analysis of total nitrogen and total phosphorus in natural waters. Marine Chemistry 10: 109-122.
Watson, S.B.; McCauley, E. & Downing, J.A. 1997. Patterns in phytoplankton taxonomic composition across temperate lakes of differing nutrient status. Limnology and Oceanography 42: 487-495.