ABSTRACT: Objective: To verify the time trends of mortality rates, years of lost life (YLL), and years lived with disability (YLD) caused by cerebrovascular disease in Brazil between 1990 and 2015. Methods: The estimates from the Global Burden of Diseases 2015 were used to analyze the magnitude and trends of mortality rates and disability-adjusted life years (DALY) for cerebrovascular disease (ICD-10: I-60-69) in the 27 units of the Federation between 1990 and 2015. The states were analyzed by the social development index (SDI), based on average income per person, educational attainment at 15 years- old and total fertility rate. Results: Despite the increase in the absolute number of deaths due to cerebrovascular disease, the proportion of deaths below 70 years of age has been halved between 1990 and 2015. The acceleration of the reduction was higher among women; and increased from 1990 to 2005, when compared to the period from 2005 to 2015. The risk of death has been halved across the country, but states in the lower SDI tertile had less signiicant reductions (-1.23 and -1.84% a year) compared to the middle tertile (-1.94 and - 2.22%) and the upper tertile (-2.85 and -2.82%) for men and women, respectively. The years lived with disability also presented a reduction among states, but less expressively. Conclusion: Despite the reduction of age-adjusted mortality rates throughout the country, cerebrovascular disease still presents a high disease burden, especially in states with lower socioeconomic development.
Keywords: Social inequality. Stroke. Hypertension. Primary Prevention. Mortality.
Cerebrovascular disease in Brazil from
1990 to 2015: Global Burden of Disease 2015
Doença cerebrovascular no Brasil de 1990 a 2015:
Global Burden of Disease 2015
Paulo Andrade LotufoI,II, Alessandra Carvalho GoulartI, Valéria Maria de Azeredo PassosIII,IV,
Fabio Mitsuhiro SatakeIII, Maria de Fátima Marinho de SouzaV, Elizabeth Barbosa FrançaIII,
Antônio Luiz Pinho RibeiroIII, Isabela Judith Martins BensenõrI,II
ICenter for Clinical and Epidemiological Research of Universidade de São Paulo – São Paulo (SP), Brazil. IISchool of Medicine of Universidade de São Paulo – São Paulo (SP), Brazil.
IIISchool of Medicine of Universidade Federal de Minas Gerais – Belo Horizonte (MG), Brazil. IVSchool of Medicine of Minas Gerais – Belo Horizonte (MG), Brazil.
VMinistry of Health – Brasília (DF), Brazil.
Corresponding author: Paulo Andrade Lotufo. Universidade de São Paulo. Faculdade de Medicina. Divisão de Clínica Médica/ Hospital Universitário. Centro de Pesquisa Clínica e Epidemiológica. Avenida Lineu Prestes, 2.565, Butantã, CEP: 05508-000, São Paulo, SP, Brasil. E-mail: [email protected]
Conlict of interests: nothing to declare – Financial support: Bill & Melinda Gates Foundation (GBD Global) and Ministry of Health (GBD 2015 Brazil-states), through the National Health Fund (Process No. 25000192049/2014-14).
INTRODUCTION
Among chronic non-communicable diseases, those of the circulatory system are the main cause of mortality worldwide, including Brazil, which has one of the highest rates in South America1-3. Among cardiovascular diseases (CVD), cerebrovascular disease has
spe-ciic characteristics within the Brazilian reality, being one of the most neglected diseases in the country. It also has high incidence and mortality, which determines a slowed epidemio-logical transition compared to countries with similar socioeconomic development4,5. In the
1960s and 1970s, cerebrovascular mortality rates in the city of São Paulo were among the highest within Western cities and countries6,7. In the early 1980s, the reduction in
cerebrovas-cular mortality rates was irst noticed in the city and in the state of São Paulo7,8.
This reduc-tion was later observed throughout the country, with marked inequalities between regions. The poorest regions, with the highest mortality rates, presented the greatest reduction — despite still remaining with the highest rates9-12.
One of the main aspects of cerebrovascular mortality is that the reduction of the risk of death by the disease is much more unequal, according to social and economic indicators, in macro-regions, states or city districts than other chronic non-communicable diseases14-16.
In the city of São Paulo, between 1996 and 2011, the decline in death rates due to stroke was much more signiicant in aluent districts compared to less aluent districts16.
The initiative of the Global Burden of Disease (GBD) 2015 Study Group is an opportu-nity to verify the mortality and pattern of cerebrovascular disease in Brazil by states of the
RESUMO: Objetivo: Veriicar as tendências temporais das taxas de mortalidade, dos anos de vida perdidos (years of life lost — YLL) e dos anos de vida perdidos devido à incapacidade (years lost due to disability — YLD) motivadas pela doença cerebrovascular no Brasil entre 1990 e 2015. Métodos: Utilizou-se as informações do Global Burden of Diseases 2015 (GBD 2015) para analisar a magnitude e as tendências das taxas de mortalidade e dos anos de vida ajustados por incapacidade (DALY — disability-adjusted life years) nas 27 unidades da Federação, entre 1990 e 2015, pela doença cerebrovascular (CID-10: I-60-69). Os estados brasileiros foram analisados pelo índice de desenvolvimento social (IDS), composto por renda per capita, proporção de escolaridade formal aos 15 anos e taxa de fecundidade. Resultados: Apesar do aumento do número absoluto de mortes pela doença cerebrovascular, a proporção de mortes abaixo dos 70 anos de idade reduziu pela metade entre 1990 e 2015. A aceleração da queda foi maior entre as mulheres, e mais acentuada no período de 1990 e 2005 do que de 2005 a 2015. O risco de morte reduziu-se à metade em todo o país; porém, os estados no tercil inferior tiveram reduções menos expressivas para homens e mulheres (respectivamente, -1,23 e -1,84% ao ano), comparados aos no tercil médio (-1,94 e -2,22%) e no tercil superior (-2,85 e -2,82%). Os anos perdidos por incapacidade também apresentam redução entre os estados, mas de forma menos expressiva. Conclusão: Apesar da redução das taxas ajustadas por idade em todo o país, a doença cerebrovascular ainda apresenta alta carga de doença, principalmente nos estados com menor desenvolvimento socioeconômico.
Federation, including information on disabilities. In addition, it allows to test the hypothesis that cerebrovascular disease is directly related to the lower social and economic development.
METHODS
Descriptive study, with secondary data on the burden of disease estimated for Brazil by GBD 2015, coordinated by the Institute for Health Metrics and Evaluation (IHME)17. As the
GBD methodology includes updating procedures and conceptual principles since its irst publication, the burden of disease estimate was performed according to the IHME method applied in 2015. The GBD 2015 allowed the data, hitherto submitted by countries, to be bro-ken down by federal units — in Brazil, by states. Data analysis generated indicators of mor-tality and years of life lost (YLL) which, summed to the information on morbidity and the number of years lived with disability (YLDs) provided the measure of the global burden of disease: the disability-adjusted life years (DALYs), whose deinition is described in a metho-dological article18. The GBD 2015 created the socioeconomic development index (SDI) for
all evaluated places, by calculating per capita income, formal education at 15 years of age and fertility rate. For descriptive purposes, the 27 units of the Federation were divided into tertiles according to SDI: lower, middle, and upper.
DATA SOURCE
For Brazil, the main source of information used in the mortality analysis was the Mortality Information System (acronym in Portuguese - SIM) database of the Ministry of Health, adjusted by other national and international sources. Methods for correcting underreport-ing of mortality and ill-deined causes were used, as referred to in the 18th Chapter of the 10th Revision of the International Classiication of Diseases (ICD-10), “Symptoms, signs and abnormal indings of clinical and laboratory tests, not elsewhere classiied.” Previously pub-lished modeling was applied for the redistribution of diseases with less useful diagnoses, the “garbage codes” for target diseases19,20. A speciic software — DisMod-MR — was used
for data processing. It is a tool that generates consistent estimates of incidence, prevalence, duration of disease remission, and excess risk of death for each disease. It is available at: http://vizhub.healthdata.org/irank/arrow.php, accessed in May 2015. The ICD-10 referral codes for cerebrovascular disease were I-60 to I-69.
STATISTICAL ANALYSIS
mortality rates among Brazilian states, according to SDI, was investigated with non-para-metric tests in SPSS 23.0 software: Kruskal-Wallis; Jonckheere-Terpstra, and median test, all adapted for „n“ samples and with a stepwise step-down test.
ETHICAL ASPECTS
The study was waived by the Research Ethics Committee because it exclusively uses large national databases of secondary data of public domain, without nominal identiica-tion. The ethical principles contained in the Resolution of the National Health Council (CNS) n. 466 of December 12, 2012 were observed.
RESULTS
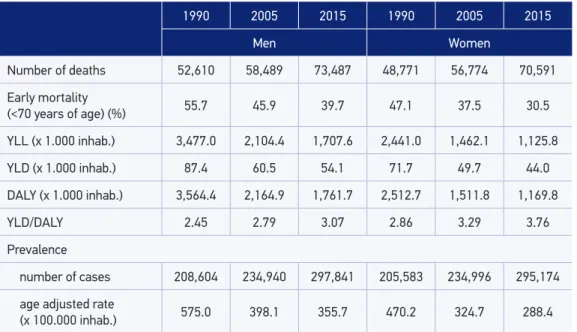
Table 1 shows the evolution of cerebrovascular disease burden in Brazil in 1990, 2005 and 2015. The number of deaths increased, but early mortality before the age of 70 years had a signiicant reduction for both sexes, mainly in women. Age-adjusted YLL also showed signiicant reduction for both sexes; the absolute values in 2015 were half those calculated
1990 2005 2015 1990 2005 2015
Men Women
Number of deaths 52,610 58,489 73,487 48,771 56,774 70,591
Early mortality
(<70 years of age) (%) 55.7 45.9 39.7 47.1 37.5 30.5
YLL (x 1.000 inhab.) 3,477.0 2,104.4 1,707.6 2,441.0 1,462.1 1,125.8
YLD (x 1.000 inhab.) 87.4 60.5 54.1 71.7 49.7 44.0
DALY (x 1.000 inhab.) 3,564.4 2,164.9 1,761.7 2,512.7 1,511.8 1,169.8
YLD/DALY 2.45 2.79 3.07 2.86 3.29 3.76
Prevalence
number of cases 208,604 234,940 297,841 205,583 234,996 295,174
age adjusted rate
(x 100.000 inhab.) 575.0 398.1 355.7 470.2 324.7 288.4
Table 1. Description of the burden of cerebrovascular disease in Brazil, by sex, in the years 1990,
2005, and 2015.
for 1990. The age-adjusted YLDs also showed a reduction, but the proportion of the YLD component of DALY showed a small increase among men, from 2.45% in 1990 to 3.07% in 2015, and among women, from 2.86% in 1990 to 3.07% in 2015. During this 25-year period, there was a drop in prevalence rates; however, the number of prevalent cases — that is, of people with cerebrovascular disease — has increased signiicantly.
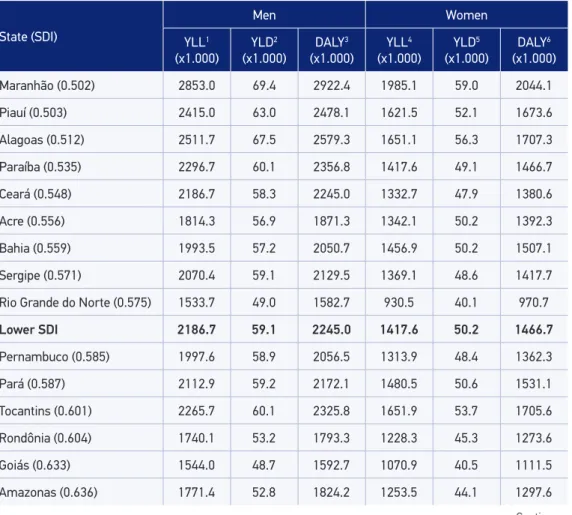
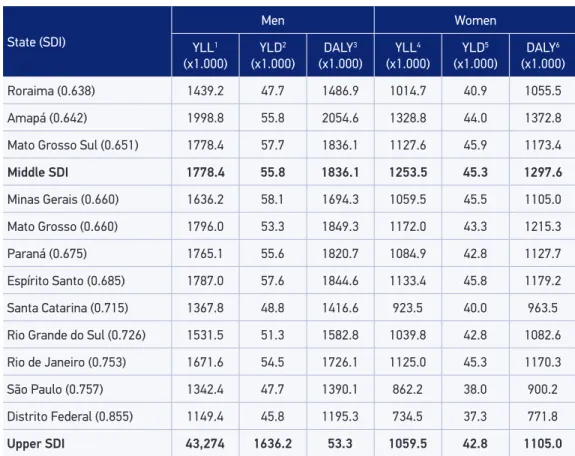
Table 2 presents YLLs, YLDs, and DALYs for cerebrovascular disease by state, divided into SDI tertiles, calculated for 2015. The diferences across tertiles were statistically signif-icant using comparative methods, showing a very strong association between cerebrovas-cular disease burden and social and economic indicators.
DALYs due to cerebrovascular disease also showed a signiicant change in 25 years of observation. Excess DALYs among men remained at approximately 44% in the irst 20 years, increasing to 51% in 2015 due to diferences in YLL — YLD remained 20% higher in male
Table 2.Description of years of life lost, years lived with disability and disability-adjusted life years
as a result of cerebrovascular disease in 2015 per unit of the Brazilian Federation.
State (SDI)
Men Women
YLL1 (x1.000)
YLD2 (x1.000)
DALY3 (x1.000)
YLL4 (x1.000)
YLD5 (x1.000)
DALY6 (x1.000)
Maranhão (0.502) 2853.0 69.4 2922.4 1985.1 59.0 2044.1
Piauí (0.503) 2415.0 63.0 2478.1 1621.5 52.1 1673.6
Alagoas (0.512) 2511.7 67.5 2579.3 1651.1 56.3 1707.3
Paraíba (0.535) 2296.7 60.1 2356.8 1417.6 49.1 1466.7
Ceará (0.548) 2186.7 58.3 2245.0 1332.7 47.9 1380.6
Acre (0.556) 1814.3 56.9 1871.3 1342.1 50.2 1392.3
Bahia (0.559) 1993.5 57.2 2050.7 1456.9 50.2 1507.1
Sergipe (0.571) 2070.4 59.1 2129.5 1369.1 48.6 1417.7
Rio Grande do Norte (0.575) 1533.7 49.0 1582.7 930.5 40.1 970.7
Lower SDI 2186.7 59.1 2245.0 1417.6 50.2 1466.7
Pernambuco (0.585) 1997.6 58.9 2056.5 1313.9 48.4 1362.3
Pará (0.587) 2112.9 59.2 2172.1 1480.5 50.6 1531.1
Tocantins (0.601) 2265.7 60.1 2325.8 1651.9 53.7 1705.6
Rondônia (0.604) 1740.1 53.2 1793.3 1228.3 45.3 1273.6
Goiás (0.633) 1544.0 48.7 1592.7 1070.9 40.5 1111.5
Amazonas (0.636) 1771.4 52.8 1824.2 1253.5 44.1 1297.6
State (SDI)
Men Women
YLL1 (x1.000)
YLD2 (x1.000)
DALY3 (x1.000)
YLL4 (x1.000)
YLD5 (x1.000)
DALY6 (x1.000)
Roraima (0.638) 1439.2 47.7 1486.9 1014.7 40.9 1055.5
Amapá (0.642) 1998.8 55.8 2054.6 1328.8 44.0 1372.8
Mato Grosso Sul (0.651) 1778.4 57.7 1836.1 1127.6 45.9 1173.4
Middle SDI 1778.4 55.8 1836.1 1253.5 45.3 1297.6
Minas Gerais (0.660) 1636.2 58.1 1694.3 1059.5 45.5 1105.0
Mato Grosso (0.660) 1796.0 53.3 1849.3 1172.0 43.3 1215.3
Paraná (0.675) 1765.1 55.6 1820.7 1084.9 42.8 1127.7
Espírito Santo (0.685) 1787.0 57.6 1844.6 1133.4 45.8 1179.2
Santa Catarina (0.715) 1367.8 48.8 1416.6 923.5 40.0 963.5
Rio Grande do Sul (0.726) 1531.5 51.3 1582.8 1039.8 42.8 1082.6
Rio de Janeiro (0.753) 1671.6 54.5 1726.1 1125.0 45.3 1170.3
São Paulo (0.757) 1342.4 47.7 1390.1 862.2 38.0 900.2
Distrito Federal (0.855) 1149.4 45.8 1195.3 734.5 37.3 771.8
Upper SDI 43,274 1636.2 53.3 1059.5 42.8 1105.0
1. Kruskal-Wallis (KW) Test: p = 0,03; Jonckheere-Terpstra (JT) Test: p < 0,001; median test: p = 0,04. 2. KW: p = 0,018; JT: p < 0,004; median: p = 0,06.
3. KW: p = 0,004; JT: p < 0,000; median: p = 0,004. 4. KW: p = 0,02; JT: p < 0,001; median: p = 0,01. 5. KW: p = 0,006; JT: p < 0,001; median: p = 0,004. 6. KW: p = 0,002; JT: p < 0,000; median: p = 0,001.
YLL: years of life lost; YLD: yearslived with disability; DALY: disability-adjusted life years;SDI: Social Development Index. Table 2. Continuation.
populatin than in female population. The evolution of YLL and YLD during this period is presented in Figure 1, revealing that there is a reduction of both indicators for both men and women, but that the proportion of YLD has increased discretely, especially among the female sex.
Figure 1. Temporal trend of age-adjusted mortality rates in Brazil between 1990 and 2015.
Men: annual reduction 1990-2005 = -2.89%; 2005-2015 = -1.68%. Women: annual reduction 1990-2005 = -2.8%; 2005-2015 = -1.96%.
215
195
175
155
135
115
95
75
1990 1995 2000 2005 2010 2015
181.3 195.2
155.6
126.5
107.8 106.9
1990 1995 2000 2005 2010 2015
0 160
120
100
80
60
40
20
126.4 139.7
108.9 90.4
77.4 74.3
140
Table 3. Age-adjusted cerebrovascular mortality rates (x 100,000 inhab.) in men among Brazilian states, classiied into three strata according to the Social Development Index.
State 1990 2005 2015 1990-2005 2005-2015 1990-2015
Maranhão 296.3 194.4 177.1 -2.81 -0.93 -2.06
Piauí 194.1 174.9 154.9 -0.69 -1.22 -0.90
Alagoas 240.2 170.8 155.6 -2.27 -0.93 -1.74
Paraíba 179.0 145.8 141.5 -1.36 -0.30 -0.94
Ceará 172.9 151.3 140.1 -0.89 -0.77 -0.84
Acre 152.1 118.6 113.0 -1.66 -0.49 -1.19
Bahia 169.2 134.4 124.6 -1.54 -0.76 -1.23
Sergipe 202.4 147.7 134.1 -2.10 -0.97 -1.65
Rio Grande do Norte 136.9 104.5 99.6 -1.80 -0.48 -1.27
Lower SDI 179.0 147.7 140.1 -1.66 -0.77 -1.23
Pernambuco 198.2 140.6 122.0 -2.29 -1.43 -1.94
Pará 189.7 150.3 135.0 -1.55 -1.08 -1.36
Tocantins 174.4 148.4 142.0 -1.08 -0.44 -0.82
Rondônia 212.6 135.1 113.2 -3.02 -1.76 -2.52
Goiás 182.5 104.4 96.5 -3.73 -0.78 -2.55
Amazonas 164.6 126.7 114.8 -1.74 -0.99 -1.44
Roraima 153.4 113.9 92.1 -1.99 -2.13 -2.04
State 1990 2005 2015 1990-2005 2005-2015 1990-2015
Amapá 138.8 135.9 126.3 -0.14 -0.73 -0.38
Mato Grosso 161.2 135.9 113.0 -2.24 -1.48 -1.94
Middle SDI 174.4 135.9 114.8 -1.99 -1.08 -1.94
Minas Gerais 197.8 116.6 98.6 -3.52 -1.68 -2.79
Mato Grosso do Sul 177.2 126.6 109.1 -1.14 -1.85 -1.42
Paraná 242.9 135.5 114.9 -3.89 -1.64 -2.99
Espírito Santo 240.7 145.6 113.9 -3.35 -2.46 -2.99
Santa Catarina 20.9 117.3 92.7 -3.85 -2.36 -3.25
Rio Grande do Sul 194.9 118.7 99.5 -3.31 -1.76 -2.69
Rio de Janeiro 223.6 125.0 100.0 -3.87 -2.23 -3.22
São Paulo 172.0 104.4 84.3 -3.33 -2.14 -2.85
Distrito Federal 144.2 107.0 78.9 -1.99 -3.05 -2.41
Upper SDI 194.9 118.7 99.5 -3.35 -2.14 -2.85
SDI: Social Development Index
Table 3. Continuation.
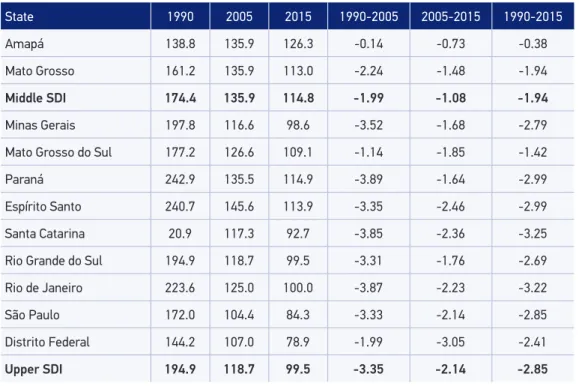
than in the period from 2005 to 2015. During 25 years of observation, the annual fall of risk of death in the upper tertile of the SDI was more than twice that of the lower tertile. The most signiicant reductions occurred in the states with the highest socioeconomic status: Santa Catarina, Rio de Janeiro, Espírito Santo, Paraná, and São Paulo. The lowest impact, in turn, was observed in less developed states: Paraíba, Piauí, Ceará, Tocantins and Amapá. Table 4 presents the same situation of the evolution of cerebrovascular mortality rates among women. The analysis of the three SDI strata found that the reduction in the risk of death was higher in women than in men, and also showed that the reduction was more accelerated in the upper stratum than in the lower stratum.
The units of the Federation with the highest decline in cerebrovascular mortality rates were Santa Catarina, Rio de Janeiro, Paraná, Espírito Santo, and Distrito Federal, unlike Acre, Piauí, Tocantins, Maranhão, and Amapá, states in which the lowest decrease of these rates occurred.
State 1990 2005 2015 1990-2005 2005-2015 1990-2015
Maranhão 161.6 159.8 126.8 -0.08 -2.31 -0.97
Piauí 145.8 132.8 108.0 -0.62 -2.07 -1.20
Alagoas 195.6 127.5 105.7 -2.86 -1.87 -2.46
Paraíba 153.0 106.4 91.1 -2.42 -1.55 -2.07
Ceará 132.1 108.2 89.9 -1.33 -1.86 -1.54
Acre 120.0 103.3 87.9 -1.00 -1.61 -1.24
Bahia 148.8 111.3 94.0 -1.93 -1.69 -1.84
Sergipe 148.1 103.8 91.0 -2.37 -1.31 -1.95
Rio Grande do Norte 105.5 74.0 64.1 -2.36 -1.44 -1.99
Lower SDI 148.1 108.2 91.1 -1.93 -1.69 -1.84
Pernambuco 160.1 102.3 84.0 -2.98 -1.97 -2.58
Pará 154.5 120.0 98.9 -1.69 -1.93 -1.78
Tocantins 132.0 122.8 103.4 -0.48 -1.73 -0.98
Rondônia 151.1 92.5 81.0 -3.28 -1.33 -2.50
Goiás 140.2 80.6 70.5 -3.69 -1.33 -2.75
Amazonas 137.0 101.8 86.4 -1.98 -1.64 -1.84
Roraima 121.7 86.3 69.9 -2.29 -2.11 -2.22
Amapá 108.0 93.1 91.2 -0.99 -0.21 -0.68
Mato Grosso 120.7 94.1 76.7 -2.79 -1.97 -2.46
Middle SDI 137.0 94.1 84.0 -2.29 -1.73 -2.22
Minas Gerais 134.8 83.4 68.8 -3.20 -1.93 -2.69
Mato Grosso do Sul 135.5 89.2 73.2 -1.66 -2.04 -1.81
Paraná 161.8 91.8 75.3 -3.78 -1.98 -3.06
Espírito Santo 160.3 97.9 75.9 -3.29 -2.54 -2.99
Santa Catarina 152.7 85.0 67.0 -3.91 -2.38 -3.30
Rio Grande do Sul 141.3 87.4 73.7 -3.21 -1.70 -2.60
Rio de Janeiro 153.9 85.9 70.1 -3.89 -2.03 -3.14
São Paulo 113.9 69.4 58.0 -3.30 -1.80 -2.70
Distrito Federal 110.9 73.5 54.8 -2.74 -2.94 -2.82
Upper SDI 141.3 85.9 70.1 -3.29 -2.03 -2.82
Table 4. Age-adjusted cerebrovascular mortality rates (x 100,000 inhab.) in women among Brazilian states, classiied into three strata according to the Social Development Index.
than in the state of São Paulo; but in 2015 this diference fell to an excess of 30% greater risk in women living in the state of Espírito Santo compared to those in the state of São Paulo.
DISCUSSION
The analysis of the indicators organized by the analytical logic applied by GBD 2015 showed that the burden of cerebrovascular disease presented signiicant changes between 1990 and 2015, such as reduction of the proportion of mortality below 70 years and reduced risk of death for both sexes, with a clear diference according to the SDI — a change also found for DALYs for men and women.
Unlike coronary disease, in which there are four major risk factors involved — dyslip-idemia, hypertension, smoking, and diabetes — cerebrovascular disease has hypertension as the main risk factor, not only for cases of parenchymal hemorrhage, but also for cere-bral ischemic events. For this reason, the identiication, treatment, and control of arterial hypertension should be considered as main determinants for reducing mortality: irst, for reducing the incidence of the disease; second, for altering the natural history of the disease, reducing lethality. However, in countries with historical series of mortality statistics that are more extensive, the reduction of mortality due to stroke precedes the introduction of antihypertensive drugs on a large scale21. Speciically in Brazil, there is another important
risk factor in the genesis of cerebrovascular disease: heart disease, with a strong potential for embolisms, such as those resulting from chagasic myocarditis22.
However, the greatest magnitude of cerebrovascular disease is not found in states with a high prevalence of Chagas Disease, such as Goiás, Minas Gerais, and Bahia. In fact, there is a direct relation of cerebrovascular disease with the worst indicators of social and economic development, as already observed in other evaluations of the disease in Brazil. Social dif-ferentiation would not only induce a higher incidence of cerebrovascular disease: even in conditions of appropriate medical care to the acute event, subsequent mortality is related to socioeconomic indicators, such as a lower level of formal education, which represented a risk factor for worse survival at long term, as demonstrated in the Stroke Mortality and Morbidity Study (EMMA) in São Paulo23.
Owing to an absolute determinant — poverty — or other, relative — social inequality — the data presented here do not allow conclusion. However, Vincens and Stafström estima-ted that social inequality would be an independent risk factor for cerebrovascular mortality, with an 18% reduction in mortality rates associated with the drop of 10 points on the Gini scale of social inequality15. In addition to the impact of both poverty and social inequality
on the magnitude of cerebrovascular disease, this study corroborates more localized assess-ments, showing that the reduction in cerebrovascular mortality was unequal among states, being always more incisive in the federative units with better socioeconomic indicators.
that the initial reduction in cerebrovascular mortality rates in Brazil — very high in relation to other countries6,7 — was accelerated because it required simple actions — both in
reduc-ing risk factors and in medical care.
The reduction not only of the YLLs, but also of the YLDs, during the period 1990 to 2015 (Table 2), enables us to observe reduction for both lethality and disease incidence. This hypothesis is based on information from Joinville, Santa Catarina, where there was a reduction in the lethality concomitant with the reduction in inci-dence — a much greater number of cases of hemorrhage than of cerebral ischemia24,25.
However, when the National Health Survey 2013 evaluated the prevalence of cerebro-vascular disease, there was an inverse relationship with the level of formal education, an association that increased when the presence of motor sequelae due to this disease was analyzed separately26.
Finally, in another evaluation of GBD 2015, arterial hypertension, the most relevant risk factor for cerebrovascular disease, was identiied as the main factor in terms of all-cause mortality and morbidity27. In addition, in the cohort of Bambuí, in the state of Minas Gerais,
the incidence of hypertension was signiicantly higher among the poor and those with less formal education, independently of factors related to ethnicity and/or genetic ancestry28.
Thus, actions directly linked to the detection, treatment, and control of arterial hyperten-sion are shown as the way to reduce the magnitude and regional diferences of cerebrovas-cular disease, as it has already occurred in other countries29.
However, the reduction in cerebrovascular mortality was more efective in states where the risk of death was relatively lower — precisely those with better socioeconomic indi-cators. This is not surprising as it was almost universally observed by Julian Hart in 1971, who described as „the inverse care law“ — that is, the beneits apply irst to those who least need to be beneited30.
Studies based on oicial mortality statistics always present limitations inherent in the process of obtaining primary information. In the case of Brazil, the historical diferences in coverage of the mortality system and the unequal proportion of ill-deined causes of death are limiting factors that have recently been corrected with the improvement of the entire system31. If corrections did not capture real regional diferences, they could distort relative
trends between regions.
Reprocessing by IHME to include these constraints, which are still in the initial testing phase, will lead to improvement in subsequent years. In particular, for cerebrovascular disease, problems of classiicatory origin prevent discrimination of the most common types: paren-chymal hemorrhage and ischemic event of any origin — atherosclerotic, embolism of car-diac or other artery origin, and injury of small vessels. This is due to the exaggerated use of the I-64 code („stroke, not speciied as hemorrhagic or ischemic“)32,33. It was not possible
to adequately compare mortality by cerebrovascular and cardiac causes in the states from the analysis of the impact of the Family Health Strategy Programs34 and Popular Pharmacy
Program35. These two actions could potentially explain the efects on mortality reduction
CONCLUSIONS
Over a 25-year period, the description of the cerebrovascular disease, without distinction of clinical presentation, showed a signiicant reduction in mortality for men and women, mainly in the period from 1990 to 2005 compared to 2005 to 2015. Despite the reduction across the country of age-adjusted rates, the states with the best social and economic indica-tors were more favored than those with the worst indicaindica-tors and the highest mortality rates.
ACKNOWLEGMENT
We are grateful for the support received from the Global Burden of Disease 2015 Study Group.
1. GBD 2015 Mortality and Causes of Death Collaborators. Global, regional, and national life expectancy, all-cause mortality, and cause-speciic mortality for 249 causes of death, 1980-2015: a systematic analysis for the Global Burden of Disease Study 2015. Lancet 2016; 388(10053): 1459-544.
2. Duncan BB, Chor D, Aquino EM, Bensenor IM, Mill JG, Schmidt MI, et al. Chronic non-communicable diseases in Brazil: priorities for disease management and research. Rev Saúde Pública 2012;46 (Suppl. 1):126-34.
3. Ribeiro AL, Duncan BB, Brant LC, Lotufo PA, Mill JG, Barreto SM. Cardiovascular Health in Brazil: Trends and Perspectives. Circulation 2016; 133(4): 422-33. 4. Lotufo PA. Stroke is still a neglected disease in Brazil.
São Paulo Med J 2015; 133(6): 457-9.
5. Lotufo PA, Bensenor IM. Stroke mortality in Brasil: on example of delayed epidemiological cardiovascular transition. Int J Stroke 2009; 4(1): 40-1.
6. Pufer RR, Griith GW. Caracteristicas de la mortalidad urbana. Washington, D.C.: Organisacion Panamericana de Salud; 1968.
7. Lolio CA, Laurenti R, Souza JMP. Decline in cardiovascular disease mortality in the city of São Paulo, 1970 to 1983. Rev Saúde Pública 1986; 20: 454-64.
8. Lotufo PA, de Lolio CA. Trends of mortality from cerebrovascular disease in the State of São Paulo: 1970 to 1989. Arq Neuropsiquiatr 1993; 51(4): 441-6. 9. De Souza MF, Alencar AP, Malta DC, Moura L,
Mansur AP. Serial temporal analysis of ischemic
heart disease and stroke death risk in ive regions of Brazil form 1981 to 2001. Arq Bras Cardiol 2006; 87: 735-40.
10. Garritano CR, Luz PM, Pires ML, Barbosa MT, Batista KM. Analysis of the mortality trend due to cerebrovascular accident in Brazil in the XXI century. Arq Bras Cardiol. 2012;98(6):519-27.
11. Lotufo PA, Goulart AC, Fernandes TG, Benseñor IM. A reappraisal of stroke mortality trends in Brazil (1979-2009). Int J Stroke 2013; 8(3): 155-63. 12. Passos VM, Ishitani LH, Franco GC, Lana GC, Abreu
DM, Marinho MF, et al. Consistent declining trends in stroke mortality in Brazil: mission accomplished? Arq Neuropsiquiatr 2016 May; 74(5): 376-81. 13. Ishitani LH, Franco GC, Perpétuo IH, França E.
Socioeconomic inequalities and premature mortality due to cardiovascular diseases in Brazil. Rev Saúde Pública 2006; 40(4): 684-91.
14. Malta DC, Bernal RT, de Souza MF, Szwarcwald CL, Lima MG, Barros MB. Social inequalities in the prevalence of self-reported chronic non-communicable diseases in Brazil: national health survey 2013. Int J Equity Health 2016 Nov 17; 15(1): 153.
15. Vincens N, Stafström M. Income Inequality, Economic Growth and Stroke Mortality in Brazil: Longitudinal and Regional Analysis 2002-2009. PLoS One 2015 Sep 9; 10(9): e0137332.
16. Fernandes TG, Bando DH, Alencar AP, Benseñor IM, Lotufo PA. Income inequalities and stroke mortality trends in Sao Paulo, Brazil, 1996-2011. Int J Stroke 2015; 10 (Suppl. A100):34-7.
17. Wang H, Naghavi M, Allen C, Barber RM, Bhutta ZA, Carter A, et al. Global, regional, and national life expectancy, all-cause mortality, and cause-specific mortality for 249 causes of death, 1980–2015: a systematic analysis for the Global Burden of Disease Study 2015. Lancet 2016; 388: 1459-544.
18. Marinho F, Passos VM, França, E. Novo século, novos desaios: mudança no peril da carga de doença no Brasil de 1990 a 2010. Epidemiol Serv Saúde 2016 Dec; 25(4):713-24.
19. Foreman KJ, Lozano R, Lopez AD, Murray CJ. Modeling causes of death: an integrated approach using CODEm. Popul Health Metr 2012 Jan; 10: 1.
20. Naghavi M, Makela S, Foreman K, O’Brien J, Pourmalek F, Lozano R. Algorithms for enhancing public health utility of national causes-of-death data. Popul Health Metr 2010 May; 8: 9.
21. Ostfeld A. A review of stroke epidemiology. Epidemiol Rev 1980; 2: 136-52.
22. Nunes MC, Kreuser LJ, Ribeiro AL, Sousa GR, Costa HS, Botoni FA, et al. Prevalence and risk factors of embolic cerebrovascular events associated with Chagas heart disease. Glob Heart 2015; 10(3): 151-7. 23. Goulart AC. EMMA Study: a Brazilian
community-based cohort study of stroke mortality and morbidity. Sao Paulo Med J 2016 Nov-Dec; 134(6): 543-54. 24. Cabral NL, Cougo-Pinto PT, Magalhaes PS, Longo
AL, Moro CH, Amaral CH, et al. Trends of Stroke Incidence from 1995 to 2013 in Joinville, Brazil. Neuroepidemiology 2016; 46(4): 273-81.
25. Cabral NL, Gonçalves ARR, Longo AL, Moro CH, Costa G, Amaral CH, et al. Trends in stroke incidence, mortality and case fatality rates in Joinville, Brazil: 1995–2006. J Neurol Neurosurg Psychiatry 2009; 80(7): 749-54. 26. Bensenor IM, Goulart AC, Szwarcwald CL, Vieira
ML, Malta DC, Lotufo PA. Prevalence of stroke and associated disability in Brazil: National Health Survey–2013. Arq Neuropsiquiatr 2015; 73(9): 746-50. 27. GBD 2015 Risk Factors Collaborators. Global, regional, and national comparative risk assessment
of 79 behavioural, environmental and occupational, and metabolic risks or clusters of risks, 1990-2015: a systematic analysis for the Global Burden of Disease Study 2015. Lancet 2016; 388(10053): 1659-724. 28. Lima-Costa MF, Mambrini JV, Leite ML, Peixoto SV,
Firmo JO, Loyola Filho AI, et al. Socioeconomic Position, But Not African Genomic Ancestry, Is Associated with Blood Pressure in the Bambui-Epigen (Brazil) Cohort Study of Aging. Hypertension 2016; 67(2): 349-55. 29. Lackland DT, Roccella EJ, Deutsch AF, Fornage M,
George MG, Howard G, et al. Factors inluencing the decline in stroke mortality: a statement from the American Heart Association/American Stroke Association. Stroke 2014; 45(1): 315-53.
30. JT Hart. The inverse care law. Lancet 1971; 1: 405-12. 31. França E, Teixeira R, Ishitani L, Duncan BB, Cortez-Escalante JJ, Morais Neto OL, et al. Ill-deined causes of death in Brazil: a redistribution method based on the investigation of such causes. Rev Saúde Pública 2014; 48(4): 671-81.
32. Lotufo PA, Benseñor IM. Trends of stroke subtypes mortality in Sao Paulo, Brazil (1996-2003). Arq Neuropsiquiatr 2005; 63(4): 951-5.
33. Abreu DMX, Drumond EF, França EB, Ishitani LH, Malta CH, Machado CJ. Análise comparativa de classiicações de causas evitáveis de morte em capitais brasileiras: o caso das doenças cerebrovasculares. Rev Bras Estud Popul 2010; 27(2): 447-55.
34. Rasella D, Harhay MO, Pamponet ML, Aquino R, Barreto ML. Impact of primary health care on mortality from heart and cerebrovascular diseases in Brazil: a nationwide analysis of longitudinal data. BMJ 2014 Jul 3; 349: g4014. 35. Mengue SS, Bertoldi AD, Ramos LR, Farias MR, Oliveira MA, Tavares NU, et al. Access to and use of high blood pressure medications in Brazil. Rev Saúde Pública 2016 Dec; 50(Suppl. 2): 8s.
Received on: 02/09/2017