AbstrAct: Objective: To assess the quality of mortality information by analyzing the frequency of garbage codes (GC) registered as underlying cause-of-death in Belo Horizonte, Minas Gerais, Brazil. Methods: Data of deaths of residents from 2011 to 2013 were selected. GC causes were classiied as proposed by the Global Burden of Disease Study (GBD) 2015. They were grouped into GCs from ICD-10 Chapter XVIII and GCs excluding codes of Chapter XVIII. Proportions of GC were calculated by sex, age, and place of occurrence. Results: In Belo Horizonte, 30.5% of the total of 44,123 deaths were GC. Higher proportion of these codes was observed in children (1 to 4 years) and in people aged over 60 years. The following leading GCs observed were: other ill-deined and unspeciied causes of death (code R99), unspeciied pneumonia ( J18.9), unspeciied stroke (hemorrhagic or ischemic) (I64), and unspeciied septicemia (A41.9). The proportions of GC were 28.7% and 36.9% in deaths that occurred in hospitals and at home, respectively. An important diference occurred in the GC group from Chapter XVIII of ICD-10: 1.7% occurred in hospitals and 16.9% at home. Conclusion: The high proportions of GC in mortality statistics in Belo Horizonte demonstrated its importance for assessing the quality of information on causes of death.
Keywords: Data accuracy. Mortality. Cause of death.
Quality of mortality statistics’
information: garbage codes as causes
of death in Belo Horizonte, 2011-2013
Qualidade da informação das estatísticas de mortalidade: códigos
garbage
declarados como
causas de morte em Belo Horizonte, 2011-2013
Lenice Harumi IshitaniI,II, Renato Azeredo TeixeiraII, Daisy Maria Xavier AbreuIII, Lucia Maria Miana Mattos PaixãoI, Elisabeth Barboza FrançaIV
IEpidemiology and Information Management, Belo Horizonte Municipal Health Department – Belo Horizonte (MG), Brazil. IIResearch Group in Epidemiology and Health Evaluation, Universidade Federal de Minas Gerais – Belo Horizonte (MG), Brazil. IIIPublic Health Education Center, School of Medicine, Universidade Federal de Minas Gerais – Belo Horizonte (MG), Brazil. IVGraduate Program in Public Health, School of Medicine, Universidade Federal de Minas Gerais – Belo Horizonte (MG), Brazil. Corresponding author: Elisabeth Barboza França. Faculdade de Medicina. Universidade Federal de Minas Gerais. Avenida Alfredo
Balena, 190, sala 731, Santa Eigênia, CEP: 30130-100, Belo Horizonte, MG, Brasil. E-mail: [email protected]
Conlict of interests: nothing to declare – Financial support: Bill & Melinda Gates Foundation (GBD Global) and Ministry of Health (GBD 2015 Brazil-states), through the National Health Fund (Process No. 25000192049/2014-14).
Quality of mortality statistics information: garbage codes as causes of death in belo horizonte, 2011-2013
INTRODUCTION
Knowledge of the health proile of the population is fundamental for the evaluation and planning of health interventions. However, this diagnosis will only relect the present sce-nario if based on high-quality information1. In Brazil, an important source of data for this
diagnosis is the Mortality Information System (Sistema de Informação sobre Mortalidade; SIM). Implemented in the country in 1975, it became a computerized system in 1979. Since then, the use of this feature has gained strength and investments have been made to improve its quality over time2.
Traditionally, the quality of information on causes of death has been assessed since 1996 by the proportion of ill-defined causes from Chapter XVIII of the International Statistical Classification of Diseases and Related Health Problems (ICD), tenth
revi-sion (ICD-10)3,4. However, studies have indicated a tendency in considering other
ill-defined causes and incomplete diagnoses from other chapters of ICD-10, defined in conjunction with those in Chapter XVIII as garbage codes (GCs). Despite still unde-serving attention by health services and professionals, the importance of this group of causes has been highlighted in order to advance the discussion on the quality of the information5,6.
The definition of GC was introduced in the Global Burden of Disease Study 1990, published in 19967. It consists of diagnoses that should not be considered as an
underly-ing cause of death, as were not considered very useful in public health5, because they do
not allow for adequate identification of actions for prevention and control of diseases
rEsumO: Objetivo: Avaliar a qualidade da informação sobre causas de óbito, identiicando a frequência de códigos garbage (CG) em Belo Horizonte, Minas Gerais. Métodos: Foram selecionados óbitos de residentes, ocorridos de 2011 a 2013. As causas de óbito foram classiicadas como CG,segundo a lista do estudo Global Burden of Disease (GBD) 2015. Esses códigosforam agrupados em: CG do capítulo XVIII da CID-10 e CG de outros capítulos da CID-10. Foram calculadas as proporções de CG por sexo, faixa etária e local de ocorrência. Resultados: Em Belo Horizonte ocorreram 44.123 óbitos no período analisado, dos quais 30,5% tiveram sua causa classiicada como CG. Maiores proporções desses códigos foram observadas em crianças de 1 a 4 anos e em maiores de 60 anos. Os principais CG foram: outras causas mal deinidas e as não especiicadas de mortalidade (R99), pneumonia não especiicada ( J18.9), acidente vascular cerebral não especiicado como hemorrágico ou isquêmico (I64) e septicemias (A41.9). Em 28,7% dos óbitos ocorridos em hospitais, a causa básica do óbito foi por CG, sendo essa proporção maior para óbitos domiciliares (36,9%). Maior diferença foi observada para os CG do capítulo XVIII da CID-10: 1,7% em hospitais e 16,9% para óbitos no domicílio. Conclusão: A magnitude dos CG nas estatísticas de mortalidade enfatiza sua importância na avaliação da qualidade da informação sobre causas de óbito.
and health disorders1. For example, causes such as septicemia, malignant neoplasia
with-out specific localization, cerebral palsy, heart failure, and renal failure do not define the disease that caused the death and, according to the GBD method, should be redistrib-uted to specific causes, according to algorithms defined in the study5,8.
GCs therefore consist of ICD codes for underlying causes of death with ill-defined or incomplete diagnoses that do not indicate the specific cause of death. Thus, a high proportion of GCs compromises the quality of information on causes of death, which may hinder the identification of priorities and the adequate planning of actions to be taken.
Considering the importance of this group of causes in the SIM data analysis, a study was carried out in the city of Belo Horizonte aimed at identifying the frequency of GCs and their distribution in health facilities to propose appropriate interventions and consequent improvement of the information on causes of death.
METHODS
From the SIM/DATASUS database, deaths of residents of Belo Horizonte were selected in the 2011–2013 triennium, in order to reduce random variations due to small numbers. To compare GC proportions, deaths were also selected in other capitals of the country.
The classiication of causes as GCs was carried out as proposed by the GBD 2015 study6. In the Brazilian Portuguese version of this study, the authors decided not to
trans-late the term “garbage”, since it is already widely adopted in the literature and because the translation to the Portuguese word lixo results in some distortion in the meaning of the term, as some GCs are only nonspeciic – such as cerebrovascular disease, unspeci-ied as ischemic or hemorrhagic. In contrast, a death due to septicemia in a young adult represents a GC with a diferent qualiication, as septicemia cannot be considered the underlying cause of this death.
The causes of death classiied as garbage were analyzed according to three and four char-acters – 3C and 4C, respectively – of ICD-10. The GCs were grouped into two categories:
1. GC-R codes: GC from Chapter XVIII of ICD-10 and
2. GC-non-R codes: GC from chapters other than Chapter XVIII.
Quality of mortality statistics information: garbage codes as causes of death in belo horizonte, 2011-2013
V88.6, V88.7, V88.8, V88.9, V89.0, V89.1, V89.2, V89.3, V89.4, V89.9), and external causes classiied as events of undetermined intent (Y10-Y34).
In order to evaluate the relative weight of GCs in Belo Horizonte and in the other cap-itals of the country, GC proportions were calculated and disaggregated into two groups: GC-R codes and GC-non-R codes. The proportions were calculated for the sum of GC deaths and also for the total number of deaths from all causes during the analyzed period (2011–2013).
The deaths which occurred in Belo Horizonte were analyzed by sex, age – aged under 1 year, 1–4, 5–14, 15–29, 30–59, and 60 years or over – and the place of occurrence.
This study did not require submission to the Research Ethics Committee, as secondary data available on the Internet were used, and the data did not contain any identifying infor-mation of the research subjects.
RESULTS
Table 1 shows that of the total of 44,123 deaths reported in Belo Horizonte in the period, 30.5% (n = 13,438) corresponded to GCs, being mostly GC-non-R codes – 25.0% of total causes. Only a few other capitals had a higher GC proportion than Belo Horizonte in the period: Fortaleza and Salvador, in the Northeast; Rio de Janeiro, in the Southeast; and the capitals of the Northern region, except for Manaus and Palmas. The capitals with the lowest proportions of GCs were those of the Southern region, in addition to Vitória and Palmas. In the country, 28.3% of the total deaths that occurred in the capitals had a GC as the underlying cause of death, with 25.2% being GC-non-R codes and 3.1% GC-R codes. In all capitals, GC-R codes were respon-sible for the lower GC percentage. It is noteworthy that Manaus and Macapá, both from the North region, presented higher proportions of GC-R codes: 11.8 and 7.8%, respectively. In addition to this, Manaus presented the third lowest proportion of GC-non-R codes (18.5%).
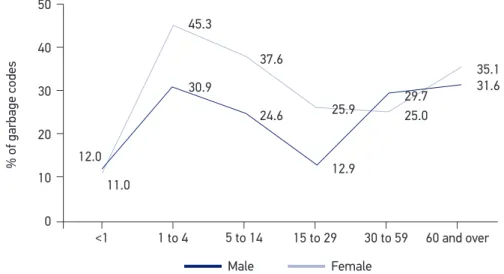
Regarding age, a higher proportion of GCs were observed in Belo Horizonte among children aged 1–4 years and among the elderly. In males, this proportion was higher in the age group from 30 to 59 years; in females, the age group of 1–4 years prevailed. With the exception of the age groups of under 1 year and 30–59 years, the proportion of GCs was higher in females, with 45.3% in the age group of 1–4 years (Figure 1).
Capital Total deaths GC*-total GC**-non-R GC***-R
N % N % n %
Porto Velho 6,480 2,104 32.5 1,771 27.3 333 5.1
Rio Branco 4,955 1,618 32.7 1,331 26.9 287 5.8
Manaus 27,688 8,401 30.3 5,134 18.5 3,267 11.8
Boa Vista 3,469 1,144 33.0 998 28.8 146 4.2
Belém 25,480 8,117 31.9 6,866 26.9 1,251 4.9
Macapá 5,100 1,733 34.0 1,337 26.2 396 7.8
Palmas 2,404 514 21.4 471 19.6 43 1.8
São Luís 16,461 4,216 25.6 3,986 24.2 230 1.4
Teresina 13,892 3,955 28.5 3,838 27.6 117 0.8
Fortaleza 43,539 14,112 32.4 11,668 26.8 2,444 5.6
Natal 14,521 4,032 27.8 3,748 25.8 284 2.0
João Pessoa 14,174 4,123 29.1 3,871 27.3 252 1.8
Recife 32,317 9,660 29.9 9,414 29.1 246 0.8
Maceió 18,171 5,206 28.7 4,983 27.4 223 1.2
Aracaju 9,596 2,766 28.8 2,426 25.3 340 3.5
Salvador 46,884 14,726 31.4 13,113 28.0 1,613 3.4
Belo Horizonte 44,123 13,438 30.5 11,028 25.0 2,410 5.5
Vitória 5,850 1,132 19.4 1,048 17.9 84 1.4
Rio de Janeiro 158,140 58,043 36.7 50,488 31.9 7,555 4.8
São Paulo 216,044 51,787 24.0 48,960 22.7 2,827 1.3
Curitiba 30,239 5,652 18.7 5,418 17.9 234 0.8
Florianópolis 6,174 1,286 20.8 1,229 19.9 57 0.9
Porto Alegre 34,173 6,298 18.4 5,448 15.9 850 2.5
Campo Grande 13,806 3,474 25.2 3,327 24.1 147 1.1
Cuiabá 9,743 2,312 23.7 2,163 22.2 149 1.5
Goiânia 24,895 6,448 25.9 6,055 24.3 393 1.6
Brasília 33,969 7,747 22.8 7,452 21.9 295 0.9
Brasil (capitais) 862,287 244,044 28.3 217,571 25.2 26,473 3.1
Table 1. Total deaths and deaths due to garbage codes in Belo Horizonte and other capitals. Brazil, 2011–2013.
Source: SIM/DATASUS.
Quality of mortality statistics information: garbage codes as causes of death in belo horizonte, 2011-2013
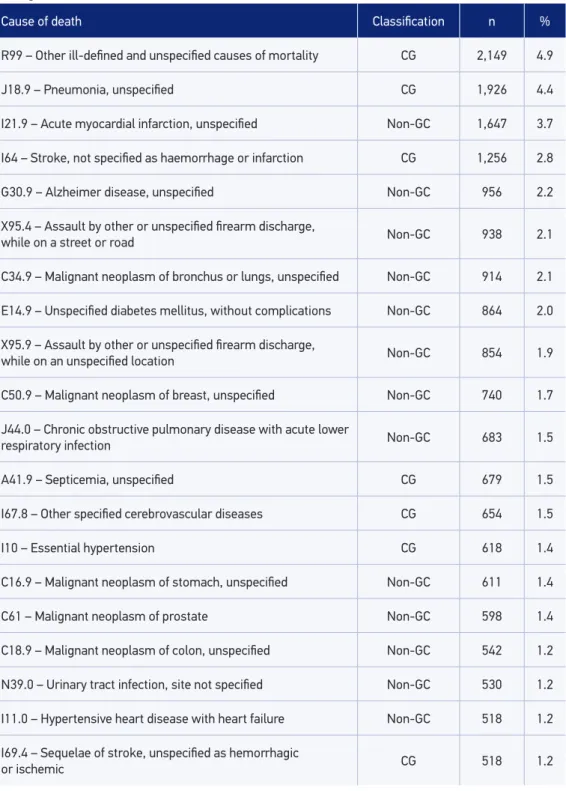
hypertension (I10), and sequelae of stroke UNS as hemorrhagic or ischemic (I69.4). It should be noted that the first two causes are in greater proportions, responsible for 9.3% of the total deaths.
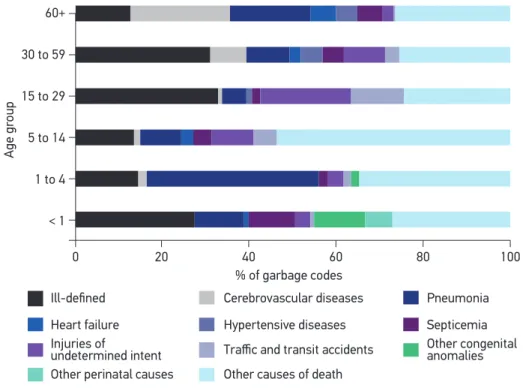
Figure 2 shows the main GC groups according to age groups. Ill-deined causes, pneu-monias and septicemia stood out as the main GCs in all ages. Age groups that presented the highest proportions of GCs for ill-deined causes, exceeding 30%, were those aged 15–29 and 30–59 years. Unspeciied pneumonia was highest in the age group of 1–4 years and in the elderly. Septicemia was higher in children younger than 1 year, in which UNS congenital anomalies still stand out. In the age groups of 5–14 and 15–29 years, the high proportion of events of undetermined intent and traic accidents with type of vehicle unspeciied or victim’s mode of transport unknown are also noteworthy. From the age of 30 years onwards, unspeciied cerebrovascular diseases stand out, as well as heart fail-ure in the over 60s.
The majority (74.4%) of the deaths occurred in health facilities (68.4% in hospitals) and 17.6% at home. For deaths in hospitals, the proportion of GCs (total) was 28.7%. In other health care facilities, home and other locations, this proportion was higher, around 36%. In relation to the GC-R codes group, this proportion was 16.9% for deaths occurring at home and only 1.7% for hospital cases (Table 3). Of the total GC-R codes (n = 2,410), 54.5% occurred at home. However, in the GC-non-R codes group (n = 11,028), 74.1% occurred in hospitals (data not shown).
Regarding health facilities in Belo Horizonte, it was verified that among the 21 hos-pitals with the highest number of GC deaths, 5 had a higher proportion than the aver-age of the municipality (30.5% of GCs). It was observed that GC-non-R codes were the most reported, and specialized hospitals for trauma and cancer care, as well as one university hospital, were those with the lowest GC proportion (data not shown).
Source: SIM/DATASUS.
Figure 1. Proportions of garbage codes by gender and age. Belo Horizonte, 2011–2013.
% of garbage codes
50
40
30
20
10
0 12.0
11.0
45.3
30.9
37.6
24.6 25.9
12.9
29.7 25.0
35.1 31.6
1 to 4
<1 5 to 14 15 to 29 30 to 59 60 and over
Cause of death Classiication n %
R99 – Other ill-deined and unspeciied causes of mortality CG 2,149 4.9
J18.9 – Pneumonia, unspeciied CG 1,926 4.4
I21.9 – Acute myocardial infarction, unspeciied Non-GC 1,647 3.7
I64 – Stroke, not speciied as haemorrhage or infarction CG 1,256 2.8
G30.9 – Alzheimer disease, unspeciied Non-GC 956 2.2
X95.4 – Assault by other or unspeciied irearm discharge,
while on a street or road Non-GC 938 2.1
C34.9 – Malignant neoplasm of bronchus or lungs, unspeciied Non-GC 914 2.1
E14.9 – Unspeciied diabetes mellitus, without complications Non-GC 864 2.0
X95.9 – Assault by other or unspeciied irearm discharge,
while on an unspeciied location Non-GC 854 1.9
C50.9 – Malignant neoplasm of breast, unspeciied Non-GC 740 1.7
J44.0 – Chronic obstructive pulmonary disease with acute lower
respiratory infection Non-GC 683 1.5
A41.9 – Septicemia, unspeciied CG 679 1.5
I67.8 – Other speciied cerebrovascular diseases CG 654 1.5
I10 – Essential hypertension CG 618 1.4
C16.9 – Malignant neoplasm of stomach, unspeciied Non-GC 611 1.4
C61 – Malignant neoplasm of prostate Non-GC 598 1.4
C18.9 – Malignant neoplasm of colon, unspeciied Non-GC 542 1.2
N39.0 – Urinary tract infection, site not speciied Non-GC 530 1.2
I11.0 – Hypertensive heart disease with heart failure Non-GC 518 1.2
I69.4 – Sequelae of stroke, unspeciied as hemorrhagic
or ischemic CG 518 1.2
Table 2. Number and percentage of leading causes of death according to its classiication as a garbage code or not. Belo Horizonte, 2011–2013.
QUaliTY oF moRTaliTY sTaTisTiCs iNFoRmaTioN: GaRBaGe Codes as CaUses oF deaTH iN Belo HoRiZoNTe, 2011-2013
Cause/place
of occurrence
Hospital Other health
institutions Home
Street/
Road Other Total
n % n % n % n % n % n %
Specii c cause 21,505 71.3 1,642 62.1 4,896 63.1 1,651 82.8 987 64.2 30,685 69.5
Garbage code 8,677 28.7 1,001 37.9 2,864 36.9 342 17.2 550 35.8 13,438 30.5
GC-R codes 509 1.7 245 9.3 1,313 16.9 91 4.6 249 16.2 2,410 5.5
GC-non-R
codes 8,168 27.1 756 28.6 1,551 20.0 251 12.6 301 19.6 11,028 25.0
Total 30,182 100.0 2,643 100.0 7,760 100.0 1,993 100.0 1,537 100.0 44,123 100.0
Table 3. Number and proportions of deaths according to classii cation as a garbage code or not by place of occurrence. Belo Horizonte, 2011-2013.
Source: SIM/DATASUS. GC: garbage code. Source: SIM/DATASUS.
Figure 2. Proportions of top garbage codes, by age group. Belo Horizonte, 2011–2013.
Age gr
oup
60+
30 to 59
15 to 29
5 to 14
1 to 4
< 1
% of garbage codes
0 20 40 60 80 100
Injuries of
undetermined intent Heart failure
Ill-defined
Other perinatal causes
Cerebrovascular diseases
Hypertensive diseases
Traffic and transit accidents
Other causes of death
Pneumonia
DISCUSSION
This study emphasizes the importance of evaluating the quality of information on mor-tality by focusing on GCs in the city of Belo Horizonte. This analysis is an important strat-egy to encourage the improvement of the quality of information1, as it signals to health
ser-vices the main problems related to illing in causes of death on the Death Certiicate (DC). In Brazil and macro-regions, a reduction in deaths due to ill-deined causes has been observed9,10.
However, with the exception of Manaus, which presented a proportion greater than 10% in the period, it was found that despite the small percentage of ill-deined causes – GC-R codes corre-sponding to Chapter XVIII of ICD-10 – other GCs stood out as important causes of death, show-ing that only an analysis of the percentage of ill-deined causes is not enough to evaluate the qual-ity of information on causes of death. Kanso et al.11, using the GC deinition of the GBD 2000
study, also found a greater proportion of these causes in relation to the codes in Chapter XVIII. Interestingly, with this approach, capitals that initially presented a better quality of information show another proile when the proportion of total GC is presented, indicating the necessity to advance the discussion on the quality of the DC, which also should consider the GC-non-R codes.
Belo Horizonte is considered to be a capital with high-quality information on mortality, due to the percentage of approximately 5% of ill-deined causes (GC-R codes). This pro-portion was obtained due to the eforts made by the municipal health department through investigation of deaths by the surveillance team and the training of physicians in the ade-quate illing in of the DC, among other activities. However, when analyzing this quality through the GC approach, it is observed that the municipality is among the capitals with the highest GC percentage, which indicate the need to improve actions related to the improve-ment of the quality of this information.
In relation to the age groups, Naghavi et al.5 also observed a higher proportion of GCs
in the ages of 1 and 14 years, with a reduction in this proportion in adulthood and with an increase in the more advanced age groups. The high proportion of GCs found in Belo Horizonte in the age group of 1–4 years may be related to the lower number of deaths. As for the age group of 60 years and over, Ngo et al.12 and Costa & Marcopito9 also found
a higher proportion of ill-deined deaths at higher ages. Such indings may be due to the greater occurrence of comorbidities in the elderly, which make it diicult to establish the cor-rect underlying cause that led to death13.
The lower proportion of ill-deined deaths in men of productive age compared with women may be related to the higher occurrence of external causes among them. These deaths are certiied by coroners after autopsy reports and the circumstances of the injuries are investigated in police reports by the municipal health department, leading to a speciic diagnosis of the cause of death14.
Quality of mortality statistics information: garbage codes as causes of death in belo horizonte, 2011-2013
Regarding the ill-deined causes of the GC-R code group, the Ministry of Health has implemented the investigation of all these deaths as a strategy for quality improvement15.
Although, in these cases, the municipality searches for information by surveying outpatient medical records and hospital information systems, the underlying cause obtained often remains as a GC. Some GCs from Chapter XX of the ICD-10 (external causes) remain of undetermined intent even after investigation by health services. In the classiication of exter-nal causes, the consultation of the autopsy reports, police reports, press reports, and the linkage of the SIM database with that of traic accidents involving casualties (Reds-BH10) is often not enough to select a speciic underlying cause of death. This happens, for exam-ple, in hit-and-run or collisions in which one of the vehicles involved has evaded.
Other GCs are not usually investigated. Among these, GC I64 or I67.8 includes hemor-rhagic or ischemic cerebrovascular diseases, which have diferent procedures in their treatment and prevention. Likewise, septicemia and heart failure, when declared as underlying causes of death, do not elucidate the several diagnoses that may have triggered the sequence of events that led to death. Speciic information is likely to be contained in health care records, such as imaging for cerebrovascular diseases16, as the diagnosis of the underlying disease is necessary
for appropriate treatment13. Thus, it is important to sensitize the attending physician to the
adequate information of the speciic cause of death during the illing in of the DC.
The diferent proile found in the proportion of GCs according to place of occurrence, with lower proportion in hospitals, was already expected, considering the greater ease of diagnosis after hospitalization17. Despite this, the proportion of GCs in hospitals remains
high. This inding also occurs when the lower percentage of GCs is veriied in specialized hospitals – such as trauma and cancer centers and university hospitals. There was also a lower proportion of GC in a reference hospital for trauma in the state, as the deaths due to accidents and violence are declared by the Brazilian forensic medicine institute, Instituto Medico Legal (IML), in which an active search with systematic investigation is carried out by the municipal health department. Therefore, the underlying cause could be deined, for the majority of deaths occurring in hospitals, taking into account that this should correspond to the diagnostic hypothesis that guided the treatment13.
The fact that 54.5% of the deaths due to ill-deined causes of the GC-R codes group occurred at home shows the diiculty in deining a diagnosis in situations where death does not occur in health care facilities. This inding may be aggravated by the absence of the Death Veriication Service (Serviço de Veriicação de Óbitos; SVO) in Belo Horizonte. In contrast, the higher percent-age of GC-non-R codes, especially in hospitals, may be due to the process of improving the ill-ing in of the DC by physicians. Guidelines and clariications given to health professionals by the municipal health department seem to have resulted in the reduction of causes from Chapter XVIII of ICD-10 (R00-R99) reported as the underlying cause of death. There may have been, however, a displacement to a non-speciic cause from another chapter.
is not feasible, due to its high cost18. It would be important, however, to develop studies to
evaluate the speciic causes of these deaths, especially in children, given the availability of vaccines for some etiologies. These studies would also be relevant in the case of adults and elderly individuals, where pneumonia may not often be the underlying cause of death. I67.8 is considered a valid code for cerebral ischemia, according to ICD-10, and should have its inclusion reconsidered in the GC list.
Essential hypertension is considered in the GBD study as a risk factor and is clas-sified as a GC because of its low utility when it is declared as the underlying cause of death, since it may be related to different categories of disease, such as ischemic heart disease, ischemic cerebrovascular disease, hemorrhagic cerebrovascular disease, and
chronic kidney disease, among others16. Thus, when the physician declares only
essen-tial hypertension in the DC, it is selected as the underlying cause, and information on associated diseases is lost.
In general, the results of this study indicate the need to make eforts in the investigation of GC deaths, both GC-R codes and GC-non-R codes. This procedure would make it possible to elucidate the underlying cause of death and a consequent enhancement of SIM19. It would also
allow the calculation of correction factors for more adequate estimates of the risk of mortality due to speciic causes. It is also important to emphasize the importance of adequate coding for the selection of the correct underlying cause and, above all, the need to reinforce the training of physicians to correctly ill in the DC, and to ensure greater access for patients to care and diagnosis, necessary to ensure high-quality information on causes of death.
CONCLUSION
The results of this study indicate the magnitude of GCs in the municipality’s mor-tality statistics, pointing out the importance of adequate strategies to qualify the infor-mation on causes of death, which include both the investigation of these deaths and the training of physicians to adequately fill in the DC. It is necessary to invest in the awareness of the health professionals about the importance of the DC for health sta-tistics that can subsidize the development of actions and programs for prevention and treatment of avoidable diseases.
1. Mathers CD, Fat DM, Inoue M, Rao C, Lopez AD. Counting the dead and what they died from: an assessment of the global status of cause of death data. Bull World Health Organ 2005 Mar; 83(3): 171-7.
2. França E, Teixeira R, Ishitani L, Duncan BB, Cortez-Escalante JJ, Morais Neto OL, et al. Causas mal deinidas de óbito no Brasil: método de redistribuição baseado na investigação do óbito. Rev Saúde Pública 2014; 48(4): 671-81.
Quality of mortality statistics information: garbage codes as causes of death in belo horizonte, 2011-2013
3. Rede Interagencial de Informação para a Saúde. Indicadores básicos para a saúde no Brasil: conceitos e aplicações. 2ª ed. Brasília: Organização Pan-Americana da Saúde; 2008. 4. Laurenti R, Mello-Jorge MHP, Gotlieb SLD.
A coniabilidade dos dados de mortalidade e morbidade por doenças crônicas não-transmissíveis. Ciênc Saúde Coletiva 2004; 9(4): 909-20.
5. Naghavi M, Makela S, Foreman K, O’Brien J, Pourmalek F, Lozano R. Algorithms for enhancing public health utility of national causes-of-death data Population Health Metrics 2010; 8: 9.
6. GBD 2015 Mortality and Causes of Death Collaborators. Global, regional, and national life expectancy, all-cause mortality, and cause speciic mortality for 249 causes of death, 1980–2015: a systematic analysis for the Global Burden of Disease Study 2015. Lancet 2016; 388: 1459-544. 7. Murray CJL, Lopez AD. The global burden of disease: a comprehensive assessment of mortality and disability from diseases, injuries, and risk factors in 1990 and projected to 2020. Cambridge, MA: Harvard School of Public Health/World Health Organization/World Bank; 1996.
8. Ahern RM, Lozano R, Naghavi M, Foreman K, Gakidou E, Murray CJ. Improving the public health utility of global cardiovascular mortality data: the rise of ischemic heart disease. Popul Health Metr 2011; 9: 8. 9. Costa MR, Marcopito LF. Mortalidade por causas mal
deinidas, Brasil, 1979-2002, e um modelo preditivo para idade. Cad Saúde Pública 2008; 24(5): 1001-12. 10. Martins Junior DF, Costa TM, Lordelo MS, Felzemburg
RDM. Tendência dos óbitos por causas mal deinidas na região Nordeste do Brasil, 1979-2009. Rev Assoc Med Bras 2011; 57(3): 338-46.
11. Kanso S, Romero DE, Leite IC, Moraes EN. Diferenciais geográficos, socioeconômicos e demográficos da qualidade da informação da causa básica de morte dos idosos no Brasil. Cad Saúde Pública 2011; 27(7): 1323-39.
12. Ngo AD, Rao C, Hoa NP, Adair T, Chuc NTK. Mortality patterns in Vietnam, 2006: Findings from a national verbal autopsy survey. BMC Research Notes 2010; 3(1): 78.
13. Mello Jorge MHP, Laurenti R, Lima-Costa MF, Gotlieb SLD, Chiavegatto Filho ADP. A mortalidade de idosos no Brasil: a questão das causas mal deinidas. Epidemiol Serv Saúde 2008; 17(4): 271-81.
14. Matos SG, Proietti FA, Barata RCB. Coniabilidade da informação sobre mortalidade por violência em Belo Horizonte, MG. Rev Saúde Pública 2007; 41(1): 76-84. Disponível em: http://www.scielo.br/pdf/rsp/ v41n1/12.pdf (Accessed on: December 12, 2016). 15. Brasil. Ministério da Saúde. Secretaria de Vigilância
em Saúde. Departamento de Análise de Situação em Saúde. Manual para investigação do óbito com causa mal deinida. Brasília: Ministério da Saúde; 2009. 16. Truelsen T, Krarup LH, Iversen HK, Mensah GA,
Feigin VL, Sposato LA, et al. Causes of Death Data in the Global Burden of Disease Estimates for Ischemic and Hemorrhagic Stroke. Neuroepidemiology 2015; 45(3): 152-60.
17. Abreu DMX, Sakurai E, Campos LN. A evolução da mortalidade por causas mal deinidas na população idosa em quatro capitais brasileiras, 1996-2007. Rev Bras Est Pop 2010; 27(1): 75-88.
18. Rodrigues JC, Silva Filho LVF, Bush A. Diagnóstico etiológico das pneumonias – uma visão crítica. J Pediatr 2002; 78(2): s129-40.
19. Mello Jorge MHP, Gotlieb SLD, Laurenti R. O sistema de informações sobre mortalidade: problemas e propostas para o seu enfrentamento. Mortes por causas naturais. Rev Bras Epidemiol 2002; 5(2): 197-211.
Received on: 01/10/2017