DOI: http://dx.doi.org/10.5007/1980-0037.2014v16n2p182
original article
RBCDH
1 Universidade Estadual Paulista. Instituto de Biociências. Depar-tamento de Educação Física, Rio Claro, SP. Brasil.
Received: 03 May 2013 Accepted: 22 August 2013
Physical itness in children with probable
developmental coordination disorder and
normal body mass index
Aptidão física em crianças com provável transtorno do
desenvolvimento da coordenação e índice de massa
corporal normal
Cynthia Yukiko Hiraga1
Paulo Ricardo Higassiaraguti Rocha1
Marcela de Castro Ferracioli1
Daniel Traina Gama1
Ana Maria Pellegrini1
Abstract– Changes in body mass index (BMI) due to various factors, such as a low level of physical activity, are oten associated with poor physical itness in children with prob-able developmental coordination disorder (pDCD). his study examined whether children
with pDCD would show poorer performance in terms of physical itness when compared
with their typically developing (TD) peers. hirty two children with pDCD and normal BMI and other 32 children with TD and normal BMI, matched by gender, age and BMI, performed the sit and reach, standing long jump, curl-up, modiied pull-up and 9-min run tests. he children in the pDCD group showed lower explosive power, muscle strength and
endurance, and cardiorespiratory itness than children in the TD group. Overall, children with pDCD had lower levels of physical itness, even with normal BMI.
Key words: Children; Developmental coordination disorder; Physical Fitness.
Developmental coordination disorder (DCD) is a clinical condition with unknown etiology characterized by low motor competence. One concept used in clinical practice to diagnose a child with DCD is that low motor competence cannot be associated with any neurological impairment or
mental deicit1. According to the American Psychiatric Association1, a small
portion of childrenshow diiculty performing simple daily motor actions
at home and/or at school. Children with such a disorder, which becomes apparent during the course of development, have low motor competence when compared with children of the same age and gender who have typical motor development. In the last decade, much of the research eforts related to DCD have focused on neural, cognitive, physical, and psychosocial aspects, to elucidate both the underlying mechanisms and the impact of
this disorder on the daily lives of these children2.
Recently, a number of studies have shown that children with DCD show poor performance in health-related physical itness components. In particular, their physical itness performance is substantially lower than that of their typically developing (TD) counterparts in the components
explosive power, muscle strength and endurance3-7, and cardiorespiratory
itness4,6,8-10. However, performance diferences in physical itness
compo-nents between children with DCD and TD children were not conirmed
in a sample with very young children at four to six years of age6, and the
distinction is still ambiguous for the lexibility component11.
he reduced performance in physical itness components observed in children with DCD is frequently associated with various factors. According to previous studies, these factors include a lack of engagement in physical
activity12, inaccurate perception of their competence to perform physical
activities13,14, and high levels of body mass index (BMI)15,16. Although the
relationship between physical activity, BMI, and physical itness is
rela-tively well established in the literature for the general population17, such a
relationship is not yet well understood in children with DCD. In previous studies, children were selected for comparison regardless of BMI, which may jeopardize the analysis of data, as the presence of overweight or obese children in any of the groups tends to skew the results related to physical
itness components5-7. A question of interest, therefore, is whether a normal
Developmental coordination disorder and health Hiraga et al.
METHODOLOGICAL PROCEDURES
Sample
he present study included 64 girls and boys recruited from three public schools in São Paulo state who were aged between 7 to 10 years and had an age-appropriate normal BMI. Data from children who were overweight or obese were not included in this study. hirty-two children identiied with motor diiculties in the Movement Assessment Battery for Children 2 (MABC-2)18 composed the ‘probable’ DCD (
pDCD) group, and other 32
children matched by gender and age without motor diiculties composed the TD group (Table 1). he participants were selected for this study based on the results of MABC-2 and anthropometric measures taken previously to the assessment of physical itness test battery.
We adopted the pDCD designation because our means of identifying children’s motor competence was through results of a ield test administered by trained researcher assistants, not by a diagnostic protocol administered by a physician19. Furthermore, our procedure did not consider all criteria
described in the Diagnostic and Statistical Manual of Mental Disorders1
for DCD. We were not able to determine, for instance, whether children’s motor diiculties were afecting their activities of daily living (Criterion B). Given the complexity of establishing the impact of motor diiculties on the activities of daily living, the procedure of selecting children adopted in the present study is typical of research in this area5,19,20. Although the MABC-2
is not a gold standard test to diagnose children with and without DCD, it provides a reasonable view of basic motor abilities functioning of each child. All procedures for testing protocols were performed at the children’s school, in an appropriate room, administered by members of the laboratory who received training to administer the protocols. he parents or guardians of each child gave written informed consent prior to participation in the study. All procedures adopted in the study were approved by a University Ethics Com-mittee (Universidade Estadual Paulista, Campus Rio Claro) by number 8386.
Anthropometric assessment
BMI was calculated using the weight and height of each participant. hree measurements were made for weight and height, using the median of the three measures to calculate the BMI. he following formula was used for the calculation of BMI: Weight/Height². According to standard cut-of points for BMI in children, taking into account diference in gender, the participants were identiied as having a normal BMI or being overweight or obese21. Only the data for participants identiied as having a normal BMI
were included for the data analysis in the present study.
Motor assessment
he MABC-2 was used to assess motor coordination18. his battery consists of
Ater the application of the test battery, the raw data for each participant were converted into scores according to the instructions in the MABC-2 manual. According to the instructions, normalization of the total battery score as a percentile established that when a child received a score equal to or less than the 5th percentile, he or she was diagnosed with signiicant motor
coordination diiculties; when a child received a score equal to or less than the 15th percentile, he or she was strongly considered at risk of having motor
diiculties; when a child received a score greater than the 15th percentile, he
or she was identiied as having no motor diiculties. For the purpose of the present study, children scoring equal to or below the 15th percentile on the
MABC-2 comprised the pDCD group. Children scoring equal to or above the 25th percentile on the MABC-2 formed the TD group. he duration of
the motor assessment for each child was approximately 25 minutes, and all procedures were in accordance with the guidelines suggested by the authors18.
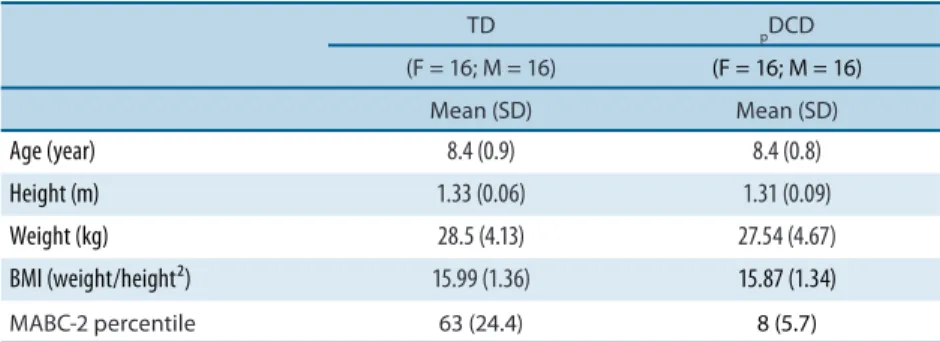
Table 1. Mean and standard deviation (in parenthesis) of age, height, weight, BMI (body mass index) and total percentile of MABC-2 (Movement Assessment Battery for Children-2) of TD (typically developing) and pDCD (probable developmental coordination disorder) groups.
TD pDCD
(F = 16; M = 16) (F = 16; M = 16)
Mean (SD) Mean (SD)
Age (year) 8.4 (0.9) 8.4 (0.8)
Height (m) 1.33 (0.06) 1.31 (0.09)
Weight (kg) 28.5 (4.13) 27.54 (4.67)
BMI (weight/height²) 15.99 (1.36) 15.87 (1.34)
MABC-2 percentile 63 (24.4) 8 (5.7)
Physical itness assessment
All participants were submitted to ive health-related physical itness tests according to standard protocols. he selection of the test protocols to examine physical itness in the present study was based on the work of Guedes and Guedes22 who established percentile scores for a sample of Brazilian children.
Developmental coordination disorder and health Hiraga et al.
was recorded. Muscle strength and endurance of the upper body was inves-tigated using the modiied pull-up test in which the maximum number of correct repetitions in one attempt was recorded. his test required a wooden frame to support a metal bar in a horizontal position at a particular height, just reachable to each participant while lying on his/her back on a lat and comfortable surface. Each repetition consisted of a movement where the body is raised up by lexing the arms until the chin is lined up with the horizontal bar, and then the body is lowered back by extending the arms to the starting position. Cardiorespiratory itness was assessed using the 9-min run test in which the children were required to run or walk, but not to stop, for nine minutes around a sports court. he travelled distance covered within nine minutes was registered for further analysis. he tests were conducted in groups of ive children with approximately 40 minutes of duration.
Statistical treatment
he Statistica 8.0 sotware was used for the statistical analyses. he efect size (ES) was calculated using the G*Power sotware23. For d = .20, the ES
is small; for d = .50, the ES is moderate; and for d = .80, the ES is great. he normality of data was veriied using the Shapiro-Wilk test. he compari-son of physical itness between children with pDCD and TD with normal BMI for age was done using the Student’s t test for parametric data and the Mann-Whitney test for nonparametric data. Alpha level was set at .05.
RESULTS
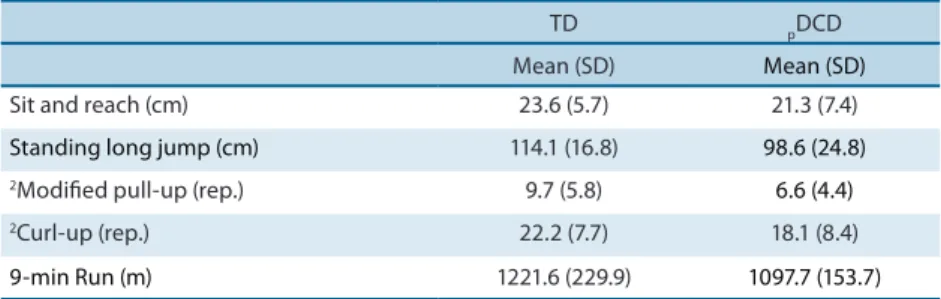
he results from the Student’s t test indicated that the performance of the
pDCD group was signiicantly lower than that of the TD group for the
stand-ing long jump test, t(62) = 2.9, p < .01, d = .78, and the 9-min run test, t(62) = 2.5, p < .05, d = .63. With respect to the sit and reach test, there was no signiicant diference in the performance between pDCD and TD groups, t(62) = 1.41, p > .05, d = .32 (Table 2). he results from the Mann-Whitney test indicated that the performance of pDCD group was signiicantly lower than that of the TD group for the modiied pull-up test, Z(64) = 2.2, p = .02, d = .66 and the curl-up test, Z = 2,21, p < .05, d = .53. ES values for each variable with statistical diference were considered moderate.
Table 2. Mean and standard deviation (in parenthesis) for physical itness tests of the TD (typically developing) and pDCD (probable developmental coordination disorder) groups.
TD pDCD
Mean (SD) Mean (SD)
Sit and reach (cm) 23.6 (5.7) 21.3 (7.4)
Standing long jump (cm) 114.1 (16.8) 98.6 (24.8)
2Modiied pull-up (rep.) 9.7 (5.8) 6.6 (4.4)
2Curl-up (rep.) 22.2 (7.7) 18.1 (8.4)
9-min Run (m) 1221.6 (229.9) 1097.7 (153.7)
he present study investigated physical itness in children with pDCD and TD children. he strength of the current study is that it includes only chil-dren with a normal BMI for their age in both groups. BMI was controlled to distinguish the possible efect of being overweight or obese on physical itness, especially for the pDCD group. he results of the present study in-dicated that children with pDCD showed signiicantly poorer performance on physical itness tests than their TD peers in the components of cardi-orespiratory itness, muscle strength and endurance, and explosive power. Overall, the results of the present study are similar to a number of previous studies that did not match the groups in terms of normal BMI for age5,7,24.
A number of studies, especially those using ield-based protocols, such as the Legér 20-m shuttle run5,7,13,19,24, the 6-m run6,24,25 and the 800-m run5,
have consistently found that cardiorespiratory itness in children with
pDCD is lower than that in TD children. Among the variables accounting
for the poor cardiorespiratory itness of these children are the perceptions of the subjects’ own abilities in which children with pDCD do not feel physically as adequate compared with TD children14. Low levels of physical
activity also contribute for poor cardiorespiratory itness. Silman et al.20,
for example, measured the levels of activity of children with DCD with an accelerometer for seven days and found that these children were less active compared with their TD counterparts. Overweight/obesity and elevated body fat are also variables that mediate the diferences in cardiorespiratory itness between the groups15. Evidence from ield-based protocols of poor
cardiorespiratory itness in children with DCD has recently gained support from the results of laboratory-based protocols. For example, results from studies using the incremental treadmill protocol showed that the VO2 peak was approximately 20% lower in the DCD group compared with control group9,26. Children with DCD were more likely to give up of the task without
reaching their best performance9 than their TD peers, and consequently
their cardiorespiratory itness is underestimated.
One of the few studies that did not ind evidence of poor cardiorespi-ratory itness in children with DCD was a study conducted by Tsiotra et al.7 using the Legér 20-m shuttle run. According to these authors, Greek
children in general demonstrate lower aerobic itness compared with chil-dren from other countries, which may have made it diicult to distinguish a statistical diference between the DCD and TD groups. According to the authors, Greek children in general exhibit lower levels of cardiorespiratory itness compared with samples from other countries. Furthermore, an ex-amination on the results of Schott et al.6 also showed no diference between
Developmental coordination disorder and health Hiraga et al.
the Legér 20-m shuttle run or covering the greatest distance by running for 6 minutes might leave children with DCD at a disadvantage because of their own coordination problems. Cairney et al.10 showed evidence that
children with DCD exerted similar efort to their peers without DCD in individual cycle ergometer testing, despite signiicant diferences in VO2. Consistent with the literature, the children with pDCD in the present study also showed lower physical itness in the components of muscle strength and endurance and explosive power5-7,24,25. Physical itness tests
commonly used for assessment of these components are the Curl-up, Push-up, Standing broad jump and Medicine ball chest pass tests. It is possible that similarly to the performance on cardiorespiratory itness laboratory tests, children with pDCD might give up without trying their best in these tests. However, the Curl-up, Modiied push-up and Standing long jump tests used in the present study require a greater demand for neuromuscular coordination compared with that of cardiorespiratory it-ness tests. he poor performance of these children in the tests involving the components of explosive power of the lower limbs and muscle strength and endurance of the abdominal and upper limbs occurs as a function of their own motor coordination diiculties. he type of tasks used to assess these components exhibits a degree of complexity that requires interlimb and intralimb coordination. In particular, the tests of the Standing long jump, Curl-up and Modiied push-up used in the present study require the subject to generate and sustain adequate muscle force contraction in a timing-speciic manner for each task. Additionally, the results indicated no diference in the performance of the lexibility test between pDCD and TD groups, which is consistent with some previous studies6,7. Such similarity
is due, in part, to the fact that the test used to assesses lexibility does not require complex neuromuscular coordination, thereby leaving the pDCD group equal with their TD peers7.
Whether the source of the poor performance of children with pDCD in this set of tasks is related or not to neuromuscular coordination is a matter that requires further investigation. In addition, diiculties in neuromus-cular coordination might be related to deicits in force control. here is evidence that children with DCD show some deicits in the production of force and explosive power27 as well as in force control28. Of interest to this
study is the fact that an equivalent BMI for children of both groups did not reveal the deiciencies of the pDCD group, giving support to the view that the performance of physical itness tests in the pDCD group might also be determined by the neuromuscular coordination demands of the tasks. Diferences in lexibility observed in previous studies3, 29 are explained by
the heterogeneous proile of children with DCD, showing great variability in lexibility or rigidity.
pDCD compared to their TD peers. It is recommended that studies involving
comparisons between DCD and TD groups match children by age, gender and BMI (speciically, children who are overweight). In previous studies, children with DCD have consistently shown an elevated BMI compared with their TD peers15,16,30. It is possible that the presence of children who are
overweight or obese may enhance or diminish the diferences between the groups, depending on the presence of these children in one or both groups. he predominance of overweight or obese children in one group may aggravate the poor performance of these children not only in physical itness tasks but in other tasks as well, such as those associated with global motor coordination.
CONCLUSIONS
he present study examined physical itness in children with pDCD com-pared to their TD peers. We controlled for BMI by including only children with a normal BMI and excluding those who were overweight or obese. We may therefore conclude that, even when matched for normal BMI, age, and gender, children with pDCD continue to demonstrate poor physical itness for the components explosive power, muscle strength and endurance, and cardiorespiratory itness, but not for lexibility.
REFERENCES
1. DSM-IV. Manual Diagnóstico e Estatístico de Transtornos Mentais. Porto Alegre:
Artmed; 2002.
2. Mandich AD, Polatajko HJ, Rodger S. Rites of passage: Understanding participation of children with developmental coordination disorder. Hum Mov Sci 2003;22(4-5):583-95.
3. Cantell M, Crawford SG, Doyle-Baker PK. Physical itness and health indices in
children, adolescents and adults with high or low motor competence. Hum Mov Sci 2008;27(2):344-62.
4. Haga M. Physical Fitness in Children With High Motor Competence Is Diferent
From hat in Children With Low Motor Competence. Phys her 2009;89(10):1089-97.
5. Li YC, Wu SK, Cairney J, Hsieh CY. Motor coordination and health-related physical itness of children with developmental coordination disorder: A three-year follow-up study. Res Dev Disabil 2011;32(6):2993-3002.
6. Schott N, Alof V, Hultsch D, Meermann D. Physical itness in children with
devel-opmental coordination disorder. Res Q Exercise Sport 2007;78(5):438-50.
7. Tsiotra GD, Nevill AM, Lane AM, Koutedakis Y. Physical Fitness and
Developmen-tal Coordination Disorder in Greek Children. Pediatr Exerc Sci 2009;21(2):186-95.
8. Cairney J, Hay J, Mandigo J, Wade T, Faught BE, Flouris A. Developmental
coor-dination disorder and reported enjoyment of physical education in children. Eur Phys Educ Rev 2007;13(1):81-98.
9. Chia LC, Gueli KJ, Licari MK. A comparison of the oxygen cost of locomotion in
children with and without developmental coordination disorder. Dev Med Child Neurol 2010;52(3):251-5.
10. Cairney J, Hay J, Veldhuizen S, Faught B. Comparison of VO2 maximum obtained
Developmental coordination disorder and health Hiraga et al.
Corresponding author
Cynthia Yukiko Hiraga
Endereço: Avenida 24A, 1515, Bela Vista,
CEP: 13506-900 - Rio Claro, SP, Brasil. E-mail: [email protected]
11. Rivilis I, Hay J, Cairney J, Klentrou P, Liu JA, Faught BE. Physical activity and it-ness in children with developmental coordination disorder: A systematic review. Res Dev Disabil 2011;32(3):894-910.
12. Cairney J, Hay JA, Veldhuizen S, Missiuna C, Faught BE. Developmental
coor-dination disorder, sex, and activity deicit over time: a longitudinal analysis of participation trajectories in children with and without coordination diiculties. Dev Med Child Neurol 2010;52(3):e67-72.
13. Cairney J, Hay JA, Faught BE, Flouris A, Klentrou P. Developmental coordination
disorder and cardiorespiratory itness in children. Pediatr Exerc Sci 2007;19(1):20-8.
14. Cairney J, Hay JA, Wade TJ, Faught BE, Flouris A. Developmental coordination
disorder and aerobic itness: Is it all in their heads or is measurement still the problem? Am J Hum Biol 2006;18(1):66-70.
15. Cairney J, Hay JA, Faught BE, Hawes R. Developmental coordination disorder
and overweight and obesity in children aged 9-14 y. Int J Obes 2005;29(4):369-72.
16. Zhu YC, Wu SK, Cairney J. Obesity and motor coordination ability in Taiwanese
children with and without developmental coordination disorder. Res Dev Disabil 2011;32(2):801-7.
17. Niederer I, Kriemler S, Zahner L, Burgi F, Ebenegger V, Marques P, et al. BMI
group-related diferences in physical itness and physical activity in preschool-age children: a cross-sectional analysis. Res Q Exercise Sport 2012;83(1):12-9.
18. Henderson SE, Sugden DA, Barnett AL. he Movement Assessment Battery for
Children. London: he Psychological Corporation; 2007.
19. Rivilis I, Liu J, Cairney J, Hay JA, Klentrou P, Faught BE. A prospective cohort study comparing workload in children with and without developmental coordination disorder. Res Dev Disabil 2012;33(2):442-8.
20. Silman A, Cairney J, Hay J, Klentrou P, Faught BE. Role of physical activity and perceived adequacy on peak aerobic power in children with developmental coor-dination disorder. Hum Mov Sci 2011;30(3):672-81.
21. Cole TJ, Bellizzi MC, Flegal KM, Dietz WH. Establishing a standard
deini-tion for child overweight and obesity worldwide: internadeini-tional survey. Bmj 2000;320(7244):1240-3.
22. Guedes DP, Guedes JERP. Manual Prático para Avaliação em Educação Física.
Barueri: Manole; 2006.
23. Faul F, Erdfelder E, Lang AG, Buchner A. G*Power 3: a lexible statistical power
analysis program for the social, behavioral, and biomedical sciences. Behav Res Methods 2007;39(2):175-91.
24. Haga M. Physical itness in children with movement diiculties. Physiotherapy
2008;94(3):253-9.
25. Vedul-Kjelsas V, Sigmundsson H, Stensdotter AK, Haga M. he relationship
be-tween motor competence, physical itness and self-perception in children. Child Care health Dev 2011;38(3):394-402.
26. Wu SK, Lin HH, Li YC, Tsai CL, Cairney J. Cardiopulmonary itness and
endur-ance in children with developmental coordination disorder. Res Dev Disabil 2010;31(2):345-9.
27. Raynor AJ. Strength, power, and coactivation in children with developmental
coordination disorder. Dev Med Child Neurol 2001;43(10):676-84.
28. Jucaite A, Fernell E, Forssberg H, Hadders-Algra M. Deicient coordination of
associated postural adjustments during a liting task in children with neurodevel-opmental disorders. Dev Med Child Neurol 2003;45(11):731-42.
29. Hands B, Larkin D, Parker H, Straker L, Perry M. he relationship among physical
activity, motor competence and health-related itness in 14-year-old adolescents. Scand J Med Sci Sports 2009;19(5):655-63.
30. Cairney J, Hay J, Veldhuizen S, Faught B. Assessment of body composition using