Original article (short paper)
Blood lactate minimum of rats during swimming
test using three incremental stages
Mariana de Souza Sena
Universidade Federal de Mato Grosso, Cuiabá, MT, Brazil
Roberto Carlos Vieira Junior
Universidade do Estado de Mato Grosso, Cáceres, MT, Brazil
Cássio Charnoski Rubim
Universidade Federal de Mato Grosso, Cuiabá, MT, Brazil
Thiago da Rosa Lima
Centro Universitário de Várzea Grande, Várzea Grande, MT, Brazil
Joice Cristina dos Santos Trombeta
Universidade Estadual de Mato Grosso, Diamantino, MT, Brazil
Alesandro Garcia
Universidade Estadual de Maringá, Maringá, PR, Brazil
Jonato Prestes Ramires Alsamir Tibana
Universidade Católica de Brasília, Distrito Federal, Brazil
Fabrício Azevedo Voltarelli
Universidade Federal de Mato Grosso, Cuiabá, MT, Brazil
Abstract––The purpose of this study was to determine the lactate minimum intensity (LMI) by swimming LACmintest
using three incremental stages (LACmintest3) and to evaluate its sensitivity to changes in aerobic itness (AF). Twenty Wistar rats performed: LACmintest3 (1): induction of hyperlactacidemia and incremental phase (4%, 5% and 6.5%
of bw); Constant loads tests on (2) and above (3) the LMI. Half of the animals were subjected to training with the individual LMI and the tests were performed again. The mean exercise load in LACmintest3 was 5.04 ± 0.13% bw at 5.08
± 0.55 mmol L-1 blood lactate minimum (BLM). There was a stabilize and disproportionate increase of blood lactate in
tests 2 and 3, respectively. After the training period, the mean BLM was lower in the trained animals. The LACmintest3
seems to be a good indicator of LMI and responsive to changes in AF in rats subjected to swim training.
Keywords: minimum blood lactate test, three incremental stages, rats, swimming
Resumo––“Lactato sanguíneo mínimo de ratos durante teste de natação usando três etapas incrementais.” O objetivo
deste estudo foi determinar a intensidade no lactato mínimo (ILM) pelo LACminteste usando três estágios incrementais (LACminteste3) e avaliar sua sensibilidade às alterações do condicionamento aeróbio (CA). Vinte ratos realizaram: LACminteste3 (1): indução da hiperlactacidemia e fase incremental (4%, 5% e 6,5% do pc); Testes de cargas constantes
equivalentes (2) e acima (3) da ILM. Metade dos animais foi submetida ao treinamento físico na ILM individual e os testes foram efetuados novamente. A sobrecarga média no LACmintest3 foi 5,04 ± 0,13% pc à 5,08 ± 0,55 mmol L
-1 de
lactato sanguíneo mínimo (LSM). Houve estabilização e aumento desproporcional do lactato sanguíneo nos testes 2 e 3, respectivamente. Após o período de treinamento, o LSM médio foi menor no grupo treinado. O LACminteste3 parece
ser um bom indicador da ILM e responsivo às mudanças no CA em ratos treinados por natação.
Palavras-chave: teste do lactato sanguíneo mínimo, três estágios incrementais, ratos, natação
Resumen––“Lactato sanguíneo mínimo de ratas durante la prueba de natación con tres pasos incrementales.” Determinar
Introduction
The lactate minimum test (LACmintest), which consists of an effort to induce hyperlactatemia followed by an incremental test,
have been shown to be reproducible (Dotan et al., 2011; Morel
& Zagatto, 2008), and reliable (Ribeiro, Balikian, Malachias, & Baldissera, 2003; Smith, Balmer, Coleman, Bird, & Davison, 2002) for estimating maximal lactate steady state (MLSS) in -tensity, which is considered as the gold standard procedure in
the aerobic endurance evaluation.
Blood lactate concentrations measured during the incremen-tal phase of the LACmintest test have a U-shaped proile, which is the lactate minimum intensity (LMI), corresponding to the low-est lactate value (minimum point); this is considered to be the highest workload, at which a dynamic balance occurs between
lactate production and removal. The minimum lactate point, called blood lactate minimum (BLM), in the lactate-exercise
intensity relationship for LMI determination can be obtained
visually (Simões, Campbell, Kokubun, Denadai, & Baldissera, 1999) or by mathematical adjustment (Myagi, Leite, & Zagatto, 2013; Ribeiro, Gonçalves, Kater, Lima, & Gobatto, 2009).
In humans, it was reported that the method of hyperlactac-idemia induction does not affect the LMI (Smith et al., 2002).
On the other hand, Zagatto et al. (2014) veriied that the mode
of induction of hiperlactacidemia signiicantly affects the pH, blood lactate, the [HCO3] and, consequently, the LMI, as well as the physiological parameters related to it. Thus, these indings conirm the hypothesis that LMI could be affected by the induc
-tion exercise mode, mainly by pronounced acidosis, and that the hyperlactacidemia induction mode must be chosen carefully.
In rats, Araújo, Papoti, Manchado, Mello and Gobatto (2007)
evaluated 4 different induction protocols of hyperlactacidem-ia, and observed that the induction method performed from two swimming sessions at 13% bw (1st = 30s; 2nd = up to
exhaustion [tlim]), separated by 30 seconds of interval, was the
one that has been more successful (91%) for identifying MLSS
in sedentary rats. Beck, Araújo and Gobatto (2012), who also
used rats during LACmintest swimming, observed similar results
to those by Araújo et al. (2007) and proved the effectiveness
of the method.
LACmintest require different blood samples and this feature
makes the test more costly inancially, and it requires access to
the tail end of the animal several times to obtain blood; this is an
important limitation. Accordingly, Sotero, Campbell, Pardono,
Puga, and Simões(2007), in a study with humans, investigated different methods of determining the LMI in adults with reduced
evaluar su sensibilidad a los cambios en condiciones aerobias (CA). Veinte ratas realizaron: LACmintest3 (1): inducción de hiperlactacidemia y fase incremental (4 %, 5% y 6,5 % de pc); pruebas de cargas constantes equivalente (2) y arriba (3)
de la ILM. Mitad de los animales fueron sometidos a entrenamiento físico con la persona carga equivalente a la ILM y las pruebas se realizaron nuevamente. La carga media en LACmintest3 fue 5,04 ± 0,13 % pc a 5,08 ± 0,55 mmol L-1 de lactato
mínimo en la sangre (LMS). Se observó una estabilización y desproporcionado aumento de lactato sanguíneo en las pruebas
2 y 3, respectivamente. Después del período de entrenamiento físico, la media fue menor en el grupo entrenado. LACmintest3
resultó ser un buen indicador de la ILM y sensible a los cambios que se producen en el CA en ratas entrenadas por nadar.
Palabras claves: Prueba de lactato sanguíneo mínimo, tres etapas graduales, las ratas, natación
blood collections and found no differences between the
inten-sities obtained in these tests and in the MLSS test.
Based on these results, the authors replicated the study with adolescents, in which it was possible to identify the velocity corresponding to LMI with only three incremental stages, thus validating the protocol for humans (Sotero et al., 2011).
However, there are no studies in the literature that determined
the LMI of rats during swimming exercise using only three
incremental stages and its potential to predict the MLSS.
Thus, the present study aimed to: 1) determine the LMI by LACmintest composed of three incremental stages (LACmintest3); 2) verify the capability of the LACmintest3 to predict MLSS in rats; and 3) assess the sensitivity of LACmintest3 to changes in
aerobic itness of rats subjected to 8 weeks of physical training. Our initial hypothesis is that it is possible to determine the LMI using LACmintest3 and that this test is sensitive to changes in aerobic
itness of rats subjected to swimming exercise training for 8 weeks.
Methods
Animals
Twenty male Wistar rats (90 days of age at the beginning
of the experiment), from the Central Animal House of Federal University of Mato Grosso, Cuiabá, MT, Brazil, were used.
The animals were kept in collective cages (5 animals per
cage) under standardized conditions (22± 2C, 12-hour light/
dark cycle, with water ad libitum and food (commercial rodent chow Presence®) on the premises of the Animal Laboratory
Experimentation and Exercise of NAFIMES /FEF/UFMT. The
study was conducted in accordance with the ethical principles
of animal experimentation according to the Brazilian College of Animal Experimentation (COBEA) and approved by the Animal
Research Ethics Committee (CEPA) of the Federal University
of Mato Grosso (Protocol number 23108.002938/13-0).
Adaptation to water environment and exercise
All animals were adapted to the water environment and exercise load before the tests. Adaptation consisted of placing the animals
in contact with the water depth (45 cm deep) at a temperature of
32 ± 1 ° C, for 3 weeks, 5 days per week. In the irst two weeks of adaptation, the rats swam for 60 minutes without overload. In week
in order to familiarize them with the apparatus (lead inserted in sealed bags with Velcro® (Velcro Industries Inc., Manchester, NH,
USA) and tied to the chest with the aid of a rubber band). After the period of adaptation, the rats were subjected to the following exercises, allowing an interval of 48 h between each test.
Lactate minimum test using three incremental stages (LACmintest3)
The LACmintest3 consisted of two sessions of swimming at 13% bw to induce hyperlactacidemia, (1st = 30s; = 2nd until exhaus
-tion [tlim]) separated by 30s intervals (Araújo et al., 2007); the blood lactate peak concentration (mmol L-1) was collected after
9 minutes of rest (Voltarelli et al., 2002). The incremental phase of LACmintest3 began with the load of 4% bw, then 5% bw and
6.5% bw, and the load was changed every 5 minutes of exercise.
In every rest and load change, blood samples (25 µl) were collected from the tail end of the animal, for
determin-ing the concentration of lactate (YSL ® Model 2700 Select Biochemistry Analyzer, Yellow Springs, OH, USA). The blood lactate curve versus workload was obtained by polynomial it of
2nd degree (Excel® Microsoft Corporation, New York, NY, USA).
The function analysis generated the lowest concentration value of blood lactate (BLM) and corresponding workload, indicating the LMI of each animal (Voltarelli et al., 2002, 2004, 2007).
Swimming test with constant load at LMI
Tests of 20 minutes of swimming, where animals bore constant load (individual) at LMI obtained by LACminteste3,
was performed. Before beginning the test (rest) and every 5 minutes of exercise, blood samples (25 ml) were collected to determine blood lactate by means of the electrochemical
analysis equipment (YSL ® Model 2700 Select Biochemistry Analyzer, Yellow Springs, OH, USA).
Swimming test with constant load above LMI
For this test, animals swam with constant load (individual) above LMI obtained by LACmintest3 for 20 minutes. This test
was conducted to determine if the intensity of exercise greater
than LMI would cause disproportionate increase in blood lactate of the animals (Gobatto et al., 2001; Voltarelli et al., 2002). The test procedures were the same as performed in the preceding
item, but using constant load of 1.5% bw above LMI.
Physical training
After the tests, half of the animals underwent swimming
physical training in proper swimming pool with water at 32 ± 1º C for 60 minutes, 5 days per week for 8 weeks and bearing indi -vidual overloads at LMI obtained by LACmintest3; adjustments of
loads (% bw) were performed three times per week. The animals underwent training in the morning (beginning at 9h00min). Thus,
two experimental groups were formed as follows:
• Sedentary group (S, n = 10) rats kept sedentary
through-out the experimental period;
• Trained Group (T, n = 10): rats subjected to swim -ming physical training with load at LMI obtained by LACmintest3.
Animals (S and T groups) were weighed at the beginning of each week (group T with two additional weighing, one in
middle and one at the end of the week for load adjustment; % bw) and the food intake of each group (g of feed / 100 g body
weight) were calculated weekly (24 hours of ingestion per cage)
and expressed in grams.
At the end of the experimental period, the LACmintest3 and
tests with constant load were again performed.
Prior to testing, the rats belonging to S group were readapted
to the water environment and swimming exercise, which was
to put them in contact with the deep water (45 cm depth) at the
temperature of 32 ± 1 º C for 4 days. In the irst three days of readaptation, the rats swam for 30 minutes without overload. On
the 4th day, the rats bore load corresponding to 5% of the bw for
10 minutes in order to re-familiarize them with the apparatus.
After readaptation to the water environment of the S group, LACmintest3, as well as constant ixed load tests, were again performed with the S (n = 8) and T (n = 9) groups. The reduced sampling in S and T groups occurred during this period of rehabili-tation and during LACmintest3 after physical training, respectively.
Importantly, the protocols of adaptation to the water and
swimming exercise were performed in a speciic glass pool containing 14 bays (MBS®, São Paulo-SP, Brazil).
Statistical analysis
The results were expressed as mean ± standard deviation (SD) and analyzed by Student’s t test in order to check the
difference between the mean concentration of LA and exercise
load during LACmintest3 and constant load tests performed
after the end of the experimental period between the S and T
groups (Student t-test unpaired). Analyses were performed using
Microsoft Excel®Microsoft Corporation, New York, NY, USA)
and p values < .05 indicated signiicance.
Results
Tests performed in the physical pre-training period of swimming
LACmintest3
The concentrations of blood lactate and loads equivalent of a
single rat is given as an example, during the LACminteste3 as
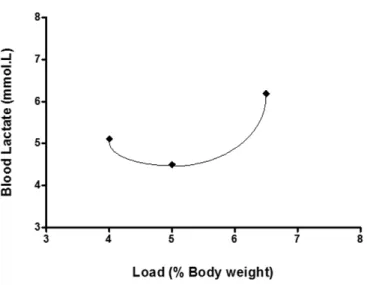
Figure 1. Blood lactate concentration curve versus workload of one rat during the LACminteste3obtained by polynomial it of 2nd degree. The equation y= 0.6947x2 – 6.862x + 21.443 enabled the calculation
of the BLM concentration and its workload (% bw).
For all animals (n = 20), the LMI was 5.04±0.13% bw and
the BLM equals to 5.08±0.55 mmol.L-1.
Swim test with constant load
Figure 2A indicates stabilization of the concentration of blood lactate of a single rat (same as rat in Figure 1) from 10
minutes of exercise; the mean stabilization (taking into account the 10 minutes, 15 and 20) was 4.90 ± 0.11 mmol L-1; Figure
2B shows a disproportionate blood lactate increase with respect to time (for 20 minutes) during the same test with rat carrying out constant load above LMI.
Taking into account the 10, 15 and 20 minutes, the mean concentration of blood lactate (n = 20) was 5.47 ± 0.60 mmol L-1,
similar to the mean BLM obtained in LACmintest3 (p value < .01).
In the test where rats were subjected to the exercise load of 1.5% bw above the LMI, the mean blood lactate concentrations
of rats that completed the test were 0.92 ± 0.04; 3.17 ± 0.20; 4.80 ± 0.34; 6.11 ± 0.37; 7.51 ± 0.35 mmol L-1 for the periods of
0, 5, 10, 15 and 20 minutes, respectively. It is worth mentioning that only 5 rats inished the test.
Figure 2. Blood lactate concentration vs exercise time of one rat (same as rat in Figure 1) during constant load test bore load (individual) at LMI (A) and; carrying out constant load above LMI obtained by LACminteste3 (B).
Tests performed after 8 weeks of swimming exercise training
LACmintest3
Figure 3 shows the concentrations of blood lactate of one rat during the LACmintest3 after physical training for 8 weeks
(same as rat in Figure 1).
The LMI of this animal was obtained on load of 5.11% bw
at 3.98 mmol.L-1 of BLM.
For all animals belonging to T group (n = 9), the LMI was
5.06±0.12% bw at 4.16±0.23 mmol.L-1 of BLM.
Figure 4 shows the concentrations of blood lactate versus workload of only one rat during LACmintest3 belonging to the
S group at the end of the experimental period. The LMI was
5.17% bw at 5.29 mmol.L-1 of BLM.
For all animals belonging to S group (n = 8), the LMI was
5.00±0.15% bw and BLM at 6.21±1.03 mmol.L-1 for that rats
Table 1 shows the mean concentration of BLM and exer -cise loads equivalent to LMI for animals that completed the LACmintest3 after the experimental period in both groups.
Table 1. Means values of BLM concentrations (mmol.L-1) and exer
-cise loads (mmol.L-1) obtained by LACmin
test3 after the experimental period in both groups (S group n = 5 and T group n = 9) (mean±SD; values with p < .05 indicate signiicance; Student t-test unpaired).
S group (n = 5) T group (n = 9) p-value
LMI 5.00±0.15 5.06±0.12 .43
BLM
concentration 6.21±1.03 4.16±0.23 .01
Swimming test with constant load at LMI
Figure 5 shows blood lactate levels of only one rat (same as
Figure 3), after physical training of 8 weeks, during swimming
test with constant load at LMI; Blood lactate stabilization was
observed from 10 minutes of exercise in the mean value of 3.86 ± 0.06 mmol L-1 (taking into account the 10, 15 and 20
minutes). The same occurred with the animal (as in Figure 4) that remained sedentary for 8 weeks (6.01 ± 0.27 mmol L-1).
Figure 5. Blood lactate concentration vs exercise time of one rat after physical training and one rat that remained sedentary (8 weeks) during
constant load test bore load (individual) at LMI obtained by LACminteste3.
The mean concentration of stabilization (10, 15 and 20 minutes) of T group (n = 9) was obtained at 4.12 ± 0.38 mmol L-1 of blood lactate. With regard to S group (n = 5), the mean
value was 6.62 ± 0.88 mmol L-1 (p < .01 compared to T).
Swimming test with constant load above LMI
Figure 6 shows a disproportionate increase in the blood lactate concentration with respect to time (over 20 minutes)
of only one rat (same as Figure 3) after physical training for 8
weeks and one (the only rat that completed the test) kept inactive
as an example. It is important to state that no stabilization of the blood lactate was observed in any of the animal evaluated.
Figure 6. Blood lactate concentration vs exercise time of one rat after
physical training (same as Figure 3 and 5) and one (the only rat that
completed the test) remained sedentary (8 weeks) during constant load
test carrying out load above LMI obtained by post-training LACmintest3.
Figure 3. Blood lactate concentration curve versus workload of one rat (T group) during the post-training LACmintest3. The equation y=
1.0387x2 – 10.618x + 31.113 enabled the calculation of the BLM con
-centration and its workload (% bw).
Figure 4. Blood lactate concentration curve versus workload of one rat (S group) during the post-training LACmintest3. The equation y=
1.408x2 – 14.572x + 42.99 enabled the calculation of the BLM con
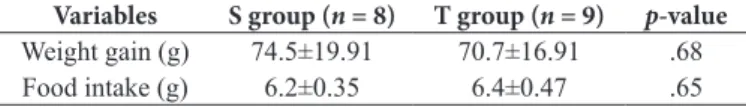
Table 2 shows the values of weight gain and the food intake
of rats belonging to S and T groups during the experimental period. There was no statistical difference.
Table 2. Body weight gain (g) and individual food intake (g of feed /
100 g body weight) of rats (S and T groups) during the experimental period (mean±SD; values with p < .05 indicate signiicance; Student t-test unpaired).
Variables S group (n = 8) T group (n = 9) p-value
Weight gain (g) 74.5±19.91 70.7±16.91 .68 Food intake (g) 6.2±0.35 6.4±0.47 .65
Discussion
To the best of our knowledge, this is the irst study to
investigate the effects of LACmintest with three incremental stages (LACmintest3) in rats subjected to swimming exercise for determining LMI. Our results showed that LACmintest3 was
sen-sitive to changes in aerobic itness of rats subjected to 8 weeks of physical training with regard to blood lactate concentration.
Figure 1 shows, as a way of example, the LMI of only one
rat obtained with a load of 4.50% bw at 4.94 mmol.L-1 of BLM,
thus indicating the possibility of obtaining the curve for
calcu-lating these values with the use of only three incremental stages.
The mean loads equivalent to LMI and concentrations of BLM for all rats (n = 20) were 5.04 ± 0.13% bw and 5.08 ±
0.55 mmol L-1, respectively. The LMI obtained was similar to
others observed in previous investigations (Voltarelli et al., 2002; Voltarelli et al. 2004). Despite the similarity in relation to
the exercise loads, BLM levels obtained from previous studies
were higher than those achieved in this study, supporting the hypothesis that BLM values can be protocol-dependent, since the method of induction of hyperlactacidemia in the works of Voltarelli et al. (2002, 2004) was by jumping into water (30s
jumps in water followed by 30 seconds of rest, to complete a total of 6 minutes) with load equivalent to 50% bw.
It is known that different protocols for the induction of
hi-perlactacidemia alter the values of BLM. Araujo et al. (2007) observed greater success in induction protocols that promoted a lower concentration of BLM, mainly in the protocol that
consisted of two swimming sessions with 13% bw (the irst for 30s and the second up to the point of exhaustion) separated by 30 s of rest (91% success), being exactly the protocol employed in the present study.
Although we did not observe similar values of BLM, as aforesaid, our results were similar in relation to LMI obtained in studies of Voltarelli et al. (2002, 2004), which was performed with 6 incremental stages in the LACmintest; this conirms the
eficiency of LACmintest3 in obtaining the LMI with only 3 points
of collection in incremental phase of the test. In the present
study, it was not possible to perform conventional LACminteste for comparison with LACmintest3, being this a limitation.
In order to prove the eficiency of the protocol proposed by
us in predicting the MLSS, two swimming tests of 20 minutes with individual constant load were performed, one at the LMI obtained by LACmintest3 because, theoretically, this corresponds
to MLSS intensity (Sotero et al., 2007; Voltarelli et al. 2002, 2004) and one with individual constant load above the LMI obtained by LACmintest3 (Gobatto et al., 2001; Voltarelli et al.,
2002).
Figure 2A denotes stabilization in the mean concentration
of blood lactate (4.90 ± 0.11 mmol L-1) of only one rat, as
example, from 10 minutes of exercise (taking into account the 10 minutes, 15 and 20). The mean values of blood lactate demonstrated stabilization (5.47 ± 0.60 mmol L-1) for all
ani-mals; this value is similar (p < .01) to the mean BLM obtained in the LACmintest3, thus conirming again the eficiency of the test to determine the LMI.
On the other hand, with respect to the test with the exercise load above (+1.5% bw) the LMI, we observed disproportion-ately increased of blood lactate (Figure 2B), which occurs as a result of an imbalance between production and removal of such
substrate. This imbalance leads to fatigue in the animal, which explains, in part, the fact that only 5 rats were able to complete the test. These results agree with those obtained in other studies
(Gobatto et al., 2001; Voltarelli et al., 2002, 2004) and conirmed
the eficiency of LACmintest3 in obtaining the LMI as well as its
capability in predicting the MLSS.
Several studies have suggested the use of LMI for
improving cardiorespiratory itness and physical performance,
whether in humans (Kinderman et al., 1979; Sjodin & Jacobs,
1981) or rats (Gobatto et al., 2001; Voltarelli et al., 2002, 2004). For this reason, this study also assessed the effect of physical
training on aerobic capacity of rats subjected to LACmintest3.
Figure 3 shows the concentration of BLM (3.98 mmol
L-1) and LMI (5.11% bw) of only one rat, as example, during
post-training LACmintest3. The LMI of this animal before
phys-ical training was obtained at the load of 4.94% bw at a higher BLM concentration (4.50 mmol L-1) (Figure 1). The opposite
was observed in relation to the rat maintained in sedentary sit-uation (Figure 4); the LMI of this animal was initially achieved
at a concentration of BLM equal to 4.88 mmol.L-1 and load of
5.34% bw, and after 8 weeks of inactivity the LMI obtained was
5.17% bw at 5.29 mmol L-1 of BLM. This occurrence indicated
that sedentary lifestyle undermined the aerobic capacity of this animal and that the LACmintest3 was able to identify these
differences successfully.
Table 1 shows the mean values of BLM and LMI of all rats that were able to complete the post-training LACmintest3 (Groups
S and T). When compared the mean BLM, we found a lower
value obtained by T (p = .01), which conirms the improvement
in aerobic itness of these animals as well as decrease in aerobic
capacity and consequent worsening of the physical performance
in the S group.
In the study performed by Voltarelli et al. (2004), the val -ues of BLM determined by LACmintest were also sensitive to changes in aerobic physical conditioning of animals induced
by training, with decreases in the concentrations (7.39 ± 0.39, 6.38 ± 0.12 and 5.89 ± 0.14 mmol L-1) observed in sedentary
condition, 4th and 8th weeks of training, respectively.
There was no difference between the mean values of LMI by the S and T groups in the post-training LACmintest3 (Table 1).
intensities of exercise (4.93 ± 0.07, 5.42 ± 0.01 and 5.98 ± 0.02% bw) in the sedentary situation, 4 and 8 weeks of training, re -spectively) at LMI after applying LACmintest with 6 incremental
stages. We suggest that this may be due in part to the non-load adjustment on a week-by-week basis, or at least in the irst half
of the training period as it was done in the work of Voltarelli et al. (2004). In order to accomplish such adjustment, it would be necessary to perform LACmintest3 each week, which would be impractical for us due to the costs generated by collections and
determination of blood lactate concentrations. However, this
fact should be taken into consideration in future studies, since it can determine the outcome, especially in relation to LMI and
not for what seemed, in relation to the concentrations of BLM. Another explanation for the lack of alteration of LMI in
the present study, after 8 weeks of exercise training, may be explained by the question of the nature of the monotonous character of the same, since Araújo et al. (2013a), in an unprec -edented manner, observed that the monotonous training did not
affect aerobic performance (exercise load) (corroborating our
results), decreased anaerobic capacity and also increased the
concentration of the enzyme creatine kinase (CK) of the animals.
Moreover, the continuous training (and monotonous), in another
study (Araújo et al., 2013b), only performed at intensities below the LMI (80% and 90%) (unlike the present study), increased
exercise load at the end of training and, importantly, without altering markers of oxidative stress and muscle damage (CK). It is noteworthy that the same study (Araújo et al., 2013b), an
increase stabilization in the exercise load was related to the absolute amount and not the relative (% body weight). Thus,
the absolute load method seems to be more reliable in indicating
adaptations to overload and this is suggested for future studies.
Corroborating again our results as regards the
non-mod-iication of the training load (LMI) after physical training, Araújo et al. (2012) observed that even after performing linear periodization (including taper period) there was an increase training load only when the trained animals were compared with
the sedentary, denoting dificulty of achieving improvement in aerobic performance of animals subjected to physical training in swimming, independently of the method used.
Tests with constant workload performed after the trial period
conirmed the results above. Figure 5 shows that the trained an -imal showed lower stabilization of the blood lactate mean value
(3.86 ± 0.06 mmol L-1) if compared to sedentary ones (6.01 ±
0.27 mmol L-1). From the mean values of stabilization, the same
occurred (T: 4.12 ± 0.38, S: 6.62 ± 0.88, p < .01).
In the test conducted with a constant load above LMI, the results obtained in both groups showed a disproportionate
in-crease in the blood lactate for all animals.
Figure 6 demonstrates disproportionate increase in the blood
lactate concentration of only one rat (as Figure 3) after 8 weeks
of physical training, and also one (the one ending the test) rat
kept inactive, as example, conirming the difference in blood lactate concentrations between the groups.
The testing of constant load at LMI applied to both groups
conirmed the effectiveness of training in reducing blood lactate concentrations in the T group. In the work of Voltarelli et al.
(2004), constant load tests carried out conirmed the increase in
exercise intensity (4.93 ± 0.09, 5.42 ± 0.01 and 5.98 ± 0.02% bw in sedentary situations, 4 and 8 weeks of training, respectively)
and decreased concentrations of stabilization of blood lactate
(6.66 ± 0.37, 6.10 ± 0.05 and 5.51 ± 0.15 mmol L-1 in sedentary
conditions, 4 and 8 weeks of training, respectively) (stabilization after 15 minutes) in the course of 8 weeks physical training.
As general results, there was no difference in weight gain
and food intake between the two groups (Table 2). This control
was important for evaluating the health of the animals, since they gained weight and ingested food uniformly, regardless of
the group evaluated.
Another important question that can help to explain our
results referents to no changes of LMI is the body density of the animals, because it is particularly important in longitudinal studies in which the intervention or ageing process can modify
the animal’s body composition. During the forced swimming exercise, animals swim by vertical propulsion, and loads may be attached to their body to make it more dificult for them to stay on the surface of the water. Despite the acceptance of this test, this methodology may lack precision if it ignores the animal’s body density (BD), once is evident that less dense animals have an intrinsic advantage in facilitating loatability, and therefore less dense animals require less effort to stay aloat than more dense animals.
In this sense, dos Reis et al. (2011) veriied that older rats presented higher density, which requires more effort to sustain higher water surface, and, therefore, it is possible to under-estimate the aerobic endurance (determined, in this case, by LMI as well as BLM) of older rats compared with younger (at
the beginning of the experiment) rats. Further studies using
LACmintest3 and body density are necessary in order to better
clarify this appointment.
Presenting lower demand for time, cost and fewer incisions in the tail of the animal, the LACmintest3 test used here as a new proposal proved to be a good indicator of LMI in rats, since
the results obtained were conirmed by conducting tests of constant loads and, therefore, appeared to predict the MLSS.
Even, the LACmintest3 was sensitive to changes in the aerobic
itness of rats subjected to physical training for 8 weeks with
LMI obtained in the test, at least with regard to the observed changes in the concentrations of BLM and blood lactate dur-ing the test with constant loads and thus, we recommend its
application in rats submitted to swimming exercise not only
in eutrophic animals (healthy) but also in animals suffering from diseases such as diabetes mellitus, heart failure, among
others, as the reduction from six to three blood samples would be positive in these models.
References
Araujo, G.G., Papoti, M., Manchado-Gobatto, F.B., & Mello, M.A.R. (2013a). Monitoring chronic Physical stress using biomarkers,
performance protocols and mathematical functions to identify
Physiological adaptations in rats. Laboratory Animals, 47, 36-42.
Araujo, G.G., Papoti, M., Delbin, M.A., & Gobatto, C.A. (2013b).
anaerobic threshold in rats. European Journal of Applied Physiology, 113, 1859-1870.
Araujo, G.G., Papoti, M., Reis, I.G.M., Mello, M.A.R., & Gobatto, C.A. (2012). Physiological responses during linear periodized training in rats. European Journal of Applied Physiology, 112, 839-852.
Araujo, G.G., Papoti, M., Manchado, F.B., Mello, M.A.R., & Gobatto, C.A. (2007). Protocols for hyperlactatemia induction in the lactate minimum test adapted to swimming rats. Comparative Biochemistry and Physiology, 148, 888-892.
Bacon, L., & Kern, M. (1999). Evaluating a test protocol for predicting
maximum lactate steady state. Journal of Sports Medicine and
Physical Fitness, 39, 300-308.
Baldari, C., & Guidetti, L. (2000). A simple method for individual anaerobic threshold as a predictor of max lactate steady state.
Medicine & Science in Sports & Exercise, 32, 1798-1802.
Beck, W.R., Araújo, G.G., & Gobatto, C.A. (2012). Methods of exercise
intensity and lactatemia determination of lactate minimum test in
rats. Comparative Biochemistry and Physiology, 8, 113-116.
Beneke, R., Hutler, M., & Leithauser, R.M. (2000). Maximal lactate steady state independent of performance. Medicine & Science in Sports & Exercise, 32, 1135–1139.
Brooks, G.A. (2009). Cell-cell and intracelular lactate shuttles. The Journal of Physiology, 587, 5591-5600.
Carvalho, J.F., Masuda, M.O., & Pompeu, F.A.M.S. (2005). Method
for diagnosis and control of aerobic training in rats based on
lac-tate threshold. Comparative Biochemistry and Physiology, 140,
409–413.
Dotan, R., Zigel, L., Rotstein, A., Greenberg, T., Benyamini, Y., & Falk,
B. (2011). Reliability and validity of the lactate-minimum
test. A revisit. Journal of Sports M e d i c i n e a n d P h y s i c a l Fitness, 51, 42 – 49.
Ferreira, J.C.B, Rolim, N.P.L., Bartholomeu, J.B., Gobatto, C.A., Kokubun, E., & Brum PC. (2007). Maximal lactate steady state in running mice: Effect of exercise training. Clinical and Experimental Pharmacology and Physiology, 34, 760–765.
Gobatto, C.A., Kokubun, E, Sibuya, C.Y., & Mello, M.A.R. (1991). Efeitos da desnutrição protéico-calórica e do treinamento físico na
produção de ácido lático em ratos machos adultos após testes de
cargas progressivas. Resultados preliminares. Ciência e Cultura, 43, 725-726.
Gobatto, C.A., Mello, M.A.R., Sibuya, C.Y, Azevedo, J.R.M., Santos, L.A., & Kokubun, E. (2001). Maximal lactate steady state in rats
submitted to swimming exercise. Comparative Biochemistry and
Physiology, 130, 21–27.
Gondim, F.J., Zoppi, C.C., Silva, L.P., & Macedo, D.V. (2007). Determination of the anaerobic threshold and maximal lactate
steady state speed in equines using the lactate minimum speed
pro-tocol. Comparative Biochemistry and Physiology, 146, 375–380.
Green, H.J., Hughson, R.L., Orr, G.W., & Ranney, D.A. (1983).
Anaerobic threshold, blood lactate, and muscle metabolites in
progressive exercise. Journal of Applied Physiology (Respiratory, Environmental and Exercise Physiology), 54, 1032-1038.
Heck, H., Mader, A., Hess, G., Mucke, S., Muller, R., & Hollmann, W. (1985). Justification of the 4-mmol/L lactate threshold.
International Journal of Sports Medicine,6, 117–130.
Jones, A.M., & Carter, H. (2000). The effect of endurance training
on parameters of aerobic itness. Sports Medicine, 29, 373-376.
Jones, A.M., & Dousty, J.H. (1998). The validity of the lactate mini
-mum test for determination of the maximal lactate steady state and physiological correlates to 8 km running performance. Medicine & Science in Sports & Exercise, 30, 1304–1313.
Kindermann, W., Simon, G., & Keul, J. (1979). The signiicance of
the aerobicanaerobic transition for the determination of work load
intensities during endurance training. European Journal of Applied Physiology, 42, 25-34.
Mader, A., & Heck, H. (1986). A theory of the metabolic origin of anaer
-obic threshold. International Journal of Sports Medicine,7, 45-65.
Manchado, F.B., Gobatto, C.A., Voltarelli, F.A., & Mello, M.A.R. (2006). Nonexhaustive test for aerobic capacity determination in swimming rats. Applied Physiology, Nutrition, and Metabolism, 31, 731–736.
Myagi, W.E., Leite, J.V.M., & Zagatto, A.M. (2013). Inluence of the
selection from incremental stages on lactate minimum intensity: a
pilot study. Revista Brasileira de Cineantropometria e Desempenho Humano, 15, 715–725.
Morel, É.A., & Zagatto, A.M. (2008), Adaptação dos testes de lactato
mínimo, potência crítica e limiar anaeróbio para avaliação da
tran-sição anaeróbia-anaeróbia em protocolo especíico para o tênis de mesa. Revista Brasileira de Medicina do Esporte, 14, 518 – 522.
Palmer, A.S., Potteiger, J.A., Nau, K.L., & Tong, R.J. (1999). A 1-day maximal lactate steady state assessment protocol for trained run
-ners. Medicine & Science in Sports & Exercise, 31, 1336-1341.
Pilis, W., Zarzeczny, R., Langfort, J, Kaciuba-Uscilko, H., Nazar, k., & Wojtyna, J. (1993). Anaerobic threshold in rats. Comparative Biochemistry and Physiology, 106, 285–289.
Reis, I.G.M., Araujo, G.G., & Gobatto, C.A. (2011). Maximal lactate
steady state in swimming rats by a body density-related method
of workload quantiication. Comparative Exercise Physiology, 7,
179-184.
Ribeiro, L., Balikian, P., Malachias, P., & Baldiserra, V. (2003). Stage length, spline function and lactate minimum swimming speed. The Journal of Sports Medicine and Physical Fitness, 43, 312–318.
Ribeiro, L.F., Gonçalves, C.G., Kater, D.P., Lima, M.C., & Gobatto, C.A. (2009). Inluence of recovery manipulation after hyperlacte
-mia induction on the lactate minimum intensity. European Journal of Applied Physiology, 105, 159-165.
Simões, H.G., Campbell, C.S.G., Kokubun, E., Denadai, B.S., & Baldissera, V. (1999). Blood glucose responses for individual an
-aerobic threshold and for lactate minimum in trac tests. European Journal of Applied Physiology, 80, 34-40.
Sjodin, B., & Jacobs, I. (1981). Onset of blood lactate accumulation and marathon running performance. International Journal of Sports Medicine, 2, 23-26.
Smith, M.F., Balmer, J., Coleman, D.A., Bird, S.R., & Davison, R.C. (2002). Method of lactate elevation does not affect the determi
-nation of the lactate minimum. Medicine & Science in Sports & Exercise, 34, 1744-1749.
Sotero, R.C., Campbell, C.S.G., Pardono, E., Puga, G.M., & Simões, H.G. (2007). Polynomial adjustment as a new technique for
determination of lactate minimum velocity with reduced blood
sampling. Revista Brasileira de Cineantropometria & Desempenho Humano, 9, 327-332.
de corredores adolescentes em teste de pista de três estágios
incre-mentais. Revista Brasileira de Medicina do Esporte, 17, 119-122.
Tegtbur, U., Busse, M.W., & Braumann, K.M. (1993). Estimation of
an individual equilibrium between lactate production and
catab-olism during exercise. Medicine & Science in Sports & Exercise, 25, 620-627.
Voltarelli, F.A., Gobatto, C.A., & Mello, M.A.R. (2002). Determination of anaerobic threshold in rats using the lactate minimum test.
Brazilian Journal of Medical and Biological Research, 35,
1389-1394.
Voltarelli, F.A., Gobatto, C.A., & Mello, M.A.R. (2007). Determinação da transição metabólica através do teste do lactato mínimo em ratos desnutridos. Revista da Educação Física, 18, 33-39.
Voltarelli, F.A., Mello, M.A.R., & Gobatto, C.A. (2004). Limiar anaer -óbio determinado pelo teste do lactato mínimo em ratos: Efeito dos
estoques de glicogênio muscular e do treinamento físico. Revista Portuguesa de Ciências do Desporto, 4, 16-25.
Zagatto, A.M., Padulo, J,, Müller, P.T.G., Miyagi, W.E., Malta, E.S., & Papoti, M. (2014). Hyperlactemia induction modes affect the lactate minimum power and physiological responses in cycling.
Journal of Strength Condition Research, 28, 2927-2936.
Authors’ note
Corresponding author
Fabrício Azevedo Voltarelli, Ph.D.
Federal University of Mato Grosso
Fernando Corrêa da Costa Avenue, 2367, District: Boa Esperança Postal Code: 78060-900
Cuiabá, MT, Brazil
Manuscript received on September 18, 2014 Manuscript accepted on August 19, 2015