i
UNIVERSIDADE DE LISBOA
FACULDADE DE CIÊNCIAS
DEPARTAMENTO DE BIOLOGIA ANIMAL
Porphyrins analysis in biological fluids: development and
application of different methodologies
Joana Filipa Cabral Vargas Fernandes
Mestrado em Biologia Humana e Ambiente
Dissertação orientada por:
Professora Doutora Ana Marreilha dos Santos, Faculdade de Farmácia da Universidade de Lisboa
Professora Doutora Maria Teresa Rebelo, Faculdade de Ciências da Universidade de Lisboa
ii
“Nothing in life is to be feared, it is only to be understood. Now is the time to understand more, so that we may fear less.”
iii Acknowledgments
À Prof. Doutora Ana Paula Marreilha dos Santos, agradeço em primeiro lugar por me ter aceite como sua aluna de mestrado, permitindo que pudesse trabalhar numa área que sempre me entusiasmou, a Toxicologia, e num projeto onde pude aprender bastante, e que me deu certamente bases para a minha vida profissional. Agradeço a sua disponibilidade e paciência, e todo o esforço feito para cumprir prazos, sem, no entanto, descuidar a qualidade e rigor do trabalho.
À Prof. Doutora Maria Teresa Rebelo, agradeço pela revisão minuciosa da tese, em particular das referências bibliográficas. Agradeço também todo o acompanhamento e preocupação
demonstrada, mesmo que à distância, ao longo deste ano.
À Prof. Doutora Vanda Andrade, obrigada por todo o apoio indispensável para o desenvolvimento desta tese. Por toda a ajuda no laboratório, especialmente nos momentos mais difíceis (quando não apareciam picos onde era suposto).
À Faculdade de Ciências da Universidade de Lisboa, por me ter proporcionado uma formação de rigor e excelência, tanto na licenciatura como no mestrado. À Faculdade de Farmácia da
Universidade de Lisboa, por me ter acolhido como aluna de mestrado neste último ano. A todos os professores, funcionários e alunos com os quais me cruzei nestas duas faculdades, ao longo da minha formação académica.
À Prof. Doutora Deodália Dias, por ser a nossa coordenadora de mestrado, estando sempre disponível, com um sorriso, para nos ajudar e aconselhar.
À Prof. Maria Luísa Mateus, agradeço todo o acompanhamento ao longo deste projecto. Pelas dicas e conselhos sábios e indispensáveis para o sucesso desta tese, e por toda a simpatia e
disponibilidade demonstradas.
À Daniela Serrazina e Madalena Cota, obrigada por me terem passado o testemunho, e por me terem recebido com toda a simpatia e boa disposição no “vosso” laboratório. Obrigada por todas as dúvidas esclarecidas e por todo o apoio.
Ao Doutor Vasco Branco, colega de gabinete e de bancada, agradeço pela simpatia e pelo bom ambiente de trabalho criado.
À minha família, que sempre me apoiou, tanto a nível académico como pessoal. Obrigada à minha mãe, por me lembrar da importância de investir no nosso conhecimento e formação, e por me mostrar todos os dias, que é possível conjugar a vida profissional com a vida familiar. Obrigada ao meu pai por me ter transmitido ao longo de toda a vida a importância da disciplina e da integridade para atingir os nossos objectivos com sucesso. Ao meu irmão, por ouvir os meus desabafos e
desvaneios e por toda a cumplicidade que nos une. À minha avó, ao meu avô e outros familiares com quem partilho estas etapas, e que também me ajudaram a chegar aqui.
Aos meus colegas de mestrado em Biologia Humana e Ambiente, pela partilha de
conhecimentos e experiência, e pelo espírito de entre ajuda demonstrado ao longo deste percurso. Aos meus grandes companheiros, Fadhil e Inês obrigada por todos os conselhos e “puxões-de-orelhas”, sempre entre gargalhadas e boa disposição. Por todos os jantares e aventuras que ainda estão para vir.
iv Ao Irias, pela revisão dos textos, e por toda a paciência e compreensão ao longo deste último ano.
À Mimi, por ser a minha companheira de noitadas, sempre atenta e sempre presente.
A todos os outros, que ao longo desta etapa, sempre me apoiaram e que de uma forma ou outra me ajudaram a cumprir mais um objetivo. Sem vocês certamente que teria sido muito mais difícil.
v Resumo
A exposição a metais pesados, tais como o chumbo, arsénio e manganês, constitui uma potencial ameaça para a saúde humana. A persistência destes metais no meio ambiente, juntamente com o seu uso intensivo pelas sociedades modernas, tem ao longo dos anos vindo a aumentar
significativamente. Esta exposição pode ocorrer através do ar, alimentos ou água contaminada, e varia com o tipo de metal e com o nível de exposição a que estamos sujeitos. A toxicidade dos metais pesados reside essencialmente na formação de espécies reactivas de oxigénio, que desempenham um papel determinante para o desenvolvimento de efeitos adversos, tais como efeitos neurotóxicos e cancerígenos. O desenvolvimento de biomarcadores, que possibilitem a detecção de exposições continuadas, e/ou elevadas a metais pesados, e que possam assinalar atempadamente o aparecimento de efeitos adversos na fase inicial, enquanto o efeito tóxico for ainda reversível, é essencial para a saúde humana. Alguns metais interferem em pontos-chave da via metabólica da síntese do heme, alterando a excreção de porfirinas e de ácido delta-aminolevulínico (ALA) na urina; e promovem a oxidação das porfirinas reduzidas (porfirinogénios), que irão acumular-se em tecidos alvo, causando efeitos tóxicos no organismo. Concentrações urinárias de ALA superiores a 15 mg/L urina, podem provocar danos cerebrais em trabalhadores expostos, alucinações e convulsões. Neste sentido, o perfil de porfirinas e a concentração de ALA na urina são considerados biomarcadores de exposição e efeito para metais pesados.
As porfirinas são compostos macrocíclicos, que desempenham um papel preponderante no metabolismo dos organismos vivos, participando em processos como a fotossíntese e transporte de oxigénio. No organismo, uroporfirina (uro), heptaporfirina (hepta), hexaporfirina (hexa),
pentaporfirina (penta) e coproporfirina (copro) são produzidas em excesso, e por isso excretadas normalmente pela urina e fezes, em determinadas concentrações. No entanto, a excreção de porfirinas urinárias pode ser anormalmente elevada devido a vários factores: doenças como as porfirias, ingestão de determinados fármacos, e exposição ambiental a químicos, em particular metais pesados.
Considerando as características estruturais e químicas das porfirinas é possível desenvolver métodos que permitam a sua extracção dos fluidos biológicos, e a sua posterior identificação e quantificação, possibilitando obter o perfil de porfirinas de cada indivíduo. A detecção de porfirinas através de métodos espectrofotométricos é eficaz e frequentemente utilizada, uma vez que estas apresentam um espectro característico com bandas na região do visível (400 a 750 nm), correspondentes à banda de Soret e bandas Q. Posteriormente, através de cromatografia líquida de alta eficiência (HPLC), foram desenvolvidos métodos altamente sensíveis que permitem a separação e identificação das várias porfirinas e a determinação da sua concentração em amostras biológicas. Novos e mais eficientes métodos que permitam uma melhor extracção e quantificação das porfirinas em diferentes fluidos biológicos, são necessários. O desenvolvimento de condições e meios de conservação eficazes, sem exporem as porfirinas a ambientes que interfiram com a sua fluorescência e absorvência, são igualmente necessários. Estes métodos serão uteis para melhorar o diagnóstico diferencial das porfirias, e aumentar a sensibilidade e especificidade das porfirinas como biomarcadores.
Este trabalho teve como objectivos determinar as melhores condições de preservação de porfirinas em amostras de urina e avaliar vários métodos de extracção e quantificação de porfirinas, tendo em vista a obtenção de resultados mais rigorosos. Também, através da análise do perfil de porfirinas e do nível de ALA na urina de cada indivíduo, propomos biomarcadores de exposição e efeito, em subpopulações expostas em diferentes contextos de exposição a metais.
vi Amostras de urina de voluntários saudáveis, foram recolhidas e guardadas nas mesmas
condições de temperatura (4º, -20º e -80 ºC), armazenamento (em alíquotas ou pool) e sem ou com conservantes (Na2CO3 ou HCl) ao longo de 90 dias. O perfil urinário de porfirinas determinado por
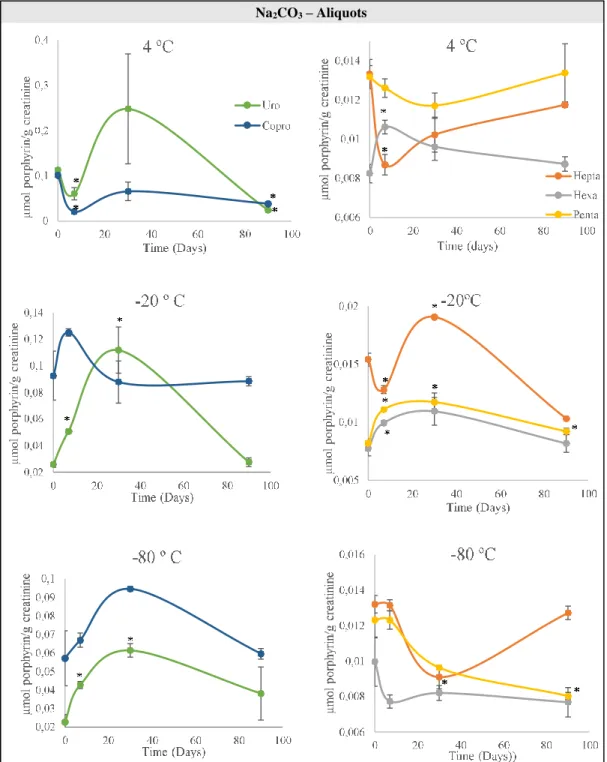
HPLC, de cada amostra armazenada na respectiva condição, foi obtido no dia de recolha (dia 0), ao fim de uma semana (dia 7), ao fim de um mês (dia 30) e três meses depois (dia 90). Ao comparar as concentrações de porfirinas nas mesmas amostras em diferentes condições de conservação, é possível identificar quando houve perdas/ganhos de concentração de uro, hepta, hexa, penta e copro, em relação ao dia 0. As condições que não revelem diferenças significativas (p>0.05) são consideradas condições óptimas de conservação. Copro conseguiu manter-se estável a -20ºC e hepta a -80 ºC durante 90 dias, sem a adição de conservantes às amostras de urina. Na presença de Na2CO3, a copro
permaneceu estável a -20 ºC e -80ºC e a hexa a -80 ºC, ao longo de 90 dias. Quando se utilizou HCl, a fracção uro manteve-se estável a -80ºC durante 90 dias. As amostras conservadas com Na2CO3 e HCl
apresentaram concentrações mais estáveis ao longo do tempo do que amostras sem conservante. As amostras armazenadas em alíquotas apresentaram menos diferenças significativas de concentração em comparação com as denominadas de pools de urina.
O método de Soulsby (1974) permite quantificar a concentração total de copro em urina, enquanto que o método de Elder (2001) permite quantificar a concentração de porfirinas totais, ambos através de espectrofotometria UV-Vis. A principal diferença entre os métodos, é que o método Soulsby utiliza éter e vários passos de extracção, enquanto o método Elder apenas acidifica a urina com HCl, não havendo qualquer extração. De forma a estudar cada método, utilizámos padrões de copro I e copro III e uro I para obter os respectivos espectros em UV-Vis, quando aplicados em matriz de água e urina. Também analisámos uma mistura equimolar constituída pelos 3 padrões. Analisámos 55 amostras de urina de indivíduos saudáveis, pelos métodos de Soulsby, Elder e HPLC como forma de comparar os diferentes métodos e inferir sobre a qualidade de resultados. O método de Soulsby falhou na extracção e quantificação de uro I, mas foi bem-sucedido para a copro I e III. O método de Elder permitiu quantificar os padrões de copro e uro, individualmente e sob a forma de mistura de padrões. Os métodos de Soulsby e HPLC apresentaram uma relação linear, ainda que fraca
(R2=0,268), para a determinação de copro total na urina. Quando comparados, os métodos de Elder e
HPLC para a análise de porfirinas totais, estes também apresentaram uma fraca relação linear entre si (R2= 0,086).
Na última parte do trabalho, foram voluntariamente cedidas amostras de urina de 63 indivíduos de uma amostra de população portuguesa, divididos em vários grupos de acordo com o nível e forma de exposição a metais pesados: pessoas que vivem numa cidade de uma ilha portuguesa (Grupo I), pessoas que vivem numa grande área urbana (Grupo L), mineiros (Grupo M), pessoas que vivem numa área rural (Grupo A), técnicos hospitalares de Raios-X (Grupo R), pessoas que vivem numa área urbana não-industrializada (Grupo S), pessoas que vivem numa área urbana industrializada (Grupo V) e fumadores (Grupo F). Determinámos o perfil urinário de porfirinas por HPLC e os níveis de ALA na urina por um método colorimétrico. Estes valores foram combinados usando análise discriminante para criar um modelo capaz de identificar se um individuo tem um contexto de exposição igual a uma área/grupo específico. Estes biomarcadores foram posteriormente integrados em procedimentos preditivos recorrendo a ferramentas estatísticas. Aplicaram-se 3 procedimentos preditivos: o primeiro combinando todos os grupos com excepção do grupo I; o segundo, combinando apenas os grupos expostos ambientalmente (Grupo L, A, S e V), e o terceiro considerando apenas os grupos expostos activamente (Grupo M, R e S). Pela combinação dos biomarcadores determinados, o primeiro procedimento, apenas conseguiu classificar correctamente 76,8% dos individuos. No segundo
vii procedimento, já foi possível classificar correctamente 96,8% dos indivíduos expostos ambientalmente nos diferentes contextos, em áreas urbanas industrializadas e não-industrializadas, numa área rural e numa grande área urbana, de Portugal. No terceiro procedimento, a discriminação de indivíduos expostos activamente a metais pesados de forma ocupacional (mineiros ou técnicos de Raios-X) ou estilo de vida (fumadores), foi alcançada com uma classificação de 100%.
Do nosso estudo podemos concluir que para garantir a conservação de todas as porfirinas, especialmente as copro e uro, é necessário adicionar um conservante. Enquanto o Na2CO3, aumenta o
pH do meio e conserva os analitos sob a forma de porfirinogénios, o HCl, acidifica a urina e promove a conversão de porfirinogénios a porfirinas. Sugerimos ainda que as amostras sejam armazenadas em alíquotas para garantir uma maior estabilidade das porfirinas urinárias. Este trabalho veio confirmar que a uro não é solúvel em éter, e por isso os métodos espectrofotométricos que o utilizem na extração não o conseguem quantificar. No entanto, estes métodos já são eficazes para análises de copro. As porfirinas totais conseguem ser detectadas em urina acidificada com HCl por espectrofotometria UV-Vis, e estimadas quantitativamente. O método de preferência deve ser HPLC, uma vez que permite a separação de cada porfirina e a sua quantificação individual, mas os métodos espectrofotométricos podem ser utilizados para uma análise rápida e preliminar. A combinação dos perfis de porfirinas com os níveis de ALA na urina pode ser utilizada como biomarcador de exposição e efeito de metais pesados, na amostra de população estudada, uma vez que os resultados dos procedimentos preditivos foram satisfatórios. A aplicação destes biomarcadores pode ser uma ferramenta útil para prever o tipo de exposição e a magnitude dos efeitos tóxicos provocados pelos metais em populações expostas, sendo por isso necessário continuar a investir no estudo das porfirinas e nas suas aplicações em Toxicologia Preditiva.
Palavras-chave:
Porfirinas; Conservação de amostras de urina; Análise de porfirinas na urina; Metais pesados; Biomarcadores.
viii Abstract
Throughout our lives we are simultaneously exposed to single or multiple sources of metal mixtures in environmental or occupational contexts. Lead (Pb), Arsenic (As) and Manganese (Mn) are classified as human carcinogens and may also cause neurotoxic effects. These metals induce
porphyrins and delta-aminolevulinic acid (ALA) accumulation, that results from the interference at specific points of the heme synthetic pathway. For this, porphyrins and ALA can be used as biomarkers of exposure and effect, contributing to prevent the risk of neurotoxicity in human populations. The aim of this work was to determine the best preservation conditions of urinary porphyrins and the most accurate method of extraction and quantification of specific and total
porphyrins. We also intended to provide biomarkers for heavy metals, through the characterization of urinary porphyrins profiles and urinary levels of ALA, in a Portuguese sub-population sample. We experienced various storage conditions (aliquots or pools subjected to freeze-thaw cycles), different temperatures (4ºC, -20 ºC and -80 ºC), and two different preservatives, over time. The addition of a preservative, like HCl or Na2CO3,to urine aliquots preserved at -80ºC succeeded to stabilize
uroporphyrin (uro) and coproporphyrin (copro) for at least 90 days. Through the analysis of copro (I and III) and uro (I) standards we conclude that spectrophotometric methods, that use ether to extract the porphyrins from urine, are not effective for uro determination, while copro, uro and total porphyrin can be detected in acidified urine by spectrophotometry, without extraction. However, HPLC should be the method of choice, once the various porphyrins are able to be separated and individually quantified through this method. We combined the urinary porphyrin profiles and ALA levels of 63 subjects, using discriminant analysis, to create a model aiming to identify whether an individual is in an exposure context according with a specific area/group. It was possible to correctly classify 96,8% of individuals environmentally exposed to metals in an urban, rural and industrial context, and 100% of the individuals actively exposed to metals (workers or smokers). The investigation of porphyrins and their precursors seems to provide tools for the development of Occupational Toxicology, highlighting predictive biomarkers of effect, and consequently the improvement of public health.
Keywords:
ix Initial Statement
Some results of this thesis were presented in a communication in poster, in an international congress: Andrade, V., Mateus, M.L., Mateus, M.C., Fernandes, J.V., Batoreú, M.C. and Marreilha dos Santos, A.P. (2017). Assessment of occupational multiple metal exposures through urinary porphyrin profile. 3rd International Conference on Urine OMICS, Faculty of Sciences and Techcnology, New University
x General Index Acknowledgments ... III Resumo ... V Abstract ... VIII Initial Statement ... IX List of Figures ... XIV List of Tables ... XVII List of abbreviations ... XX List of chemical formulas ... XXII
Chapter 1 - General Introduction ... 1
1.1 Porphyrins ... 2
1.2 Porphyrias ... 4
1.3 Changes in urinary porphyrins excretions ... 6
1.4 Heavy metals ... 7
1.4.1 Environmental exposure to heavy metals ... 7
1.4.1.1 Heavy Metals in urban environments ... 8
1.4.2 Occupational exposure to heavy metals ... 8
1.4.2.1Mine workers ... 9
1.4.3 Heavy metals in cigarette smoke ... 10
1.4.4 Sources and toxicity of Pb, As and Mn ... 11
1.4.4.1Pb ... 11 1.4.4.2As ... 11 1.4.4.3Mn ... 12 1.5 Biomarkers ... 12 1.5.1 Biomarkers of Pb, As and Mn ... 13 1.5.1.1 Pb ... 13 1.5.1.2As ... 14 1.5.1.3Mn ... 14
1.5.2 Porphyrins as biomarkers of metal exposure and effect ... 14
1.5.3 ALA as biomarker of metal exposure and effect ... 16
1.6 Urine as biological sample for determination of biomarkers ... 16
xi
Chapter 2 - Aim ... 20
2.1 Objectives... 22
Chapter 3 – Study of urinary porphyrins preservation in different conditions over time ... 24
3.1 Background ... 25
3.2 Material and Methods ... 26
3.2.1 Chemicals ... 26
3.2.2 Experimental design ... 26
3.2.3 Preservation of urine samples ... 27
3.2.4 Urinary Porphyrin Profile ... 28
3.2.5 Statistical Analysis ... 28
3.3 Results ... 29
3.3.1 Study of porphyrins stability in urinary samples…... 29
3.3.2 Percent differences in uro- and coproporphyrin concentrations over time ... 35
3.3.3 Differences of percentages in uro- and coproporphyrin concentrations over time comparing the added preservatives ... 36
3.4 Discussion ... 37
3.4.1 Study of porphyrins stability in urinary samples ... 37
3.4.2 Percent differences in uro- and coproporphyrin concentrations over time ... 39
3.4.3. Differences of percentages in uro- and coproporphyrin concentrations over time comparing the added preservatives ... 39
Chapter 4 – Insights into methodologies of porphyrin determination ... 41
4.1 Background ... 42
4.2 Material and Methods ... 43
4.2.1 Chemicals ... 43
4.2.2 Simplified method by Soulsby and Smith for the quantitative determination of urinary coproporphyrin ... 43
4.2.3 Semiquantitative determination of total porphyrins by Deacon and Elder method ... 43
4.2.4 Total porphyrins in urine by HPLC ... 44
4.2.5 Statistical Analysis ... 44
4.3 Results ... 45
4.3.1 Study of copro- and uroporphyrin standards by UV-Vis spectrometry ... 45
xii
4.3.1.2 Coproporphyrin III ... 46
4.3.1.3 Uroporphyrin I ... 47
4.3.2 Determination of the molar extiction coefficient under experimental conditions ... 47
4.3.3 Comparison between the two different spectrophotometric methods for determination of porphyrins in urine ... 48
4.3.3.1 Coproporphyrin I ... 49
4.3.3.2 Coproporphyrin III ... 50
4.3.3.3 Uroporphyrin I ... 51
4.3.3.4 Standards mixture in water matrix ... 52
4.3.3.5 Standards mixture in urine matrix ... 53
4.3.4 Comparison between Soulsby and HPLC methods for coproporphyrin quantification .. 54
4.3.5 Comparison between Elder and HPLC methods for total porphyrin quantification ... 55
4.4 Discussion ... 56
4.4.1 Study of copro- and uroporphyrin standards by UV-Vis spectrometry ... 56
4.4.2 Determination of the molar extinction coefficient under experimental conditions ... 57
4.4.3 Comparison between the two different spectrophotometric methods for determination of porphyrins in urine ... 57
4.4.3.1 Standards mixture in water matrix ... 57
4.4.3.2 Standards mixture in urine matrix ... 58
4.4.4 Comparison between Soulsby and HPLC methods for coproporphyrin quantification ... 58
4.4.5 Comparison between Elder and HPLC methods for total porphyrin quantification ... 59
Chapter 5 – Multi-biomarker approach to assess exposure to heavy metals in a sample of Portuguese population ... 60
5.1 Background ... 61
5.2 Material and Methods ... 61
5.2.1 Chemicals ... 61
5.2.2 Biological samples... 62
5.2.3 Urinary Porphyrin Profile ... 62
5.2.4 Analysis of Pb in urine ... 62
5.2.5 ALA analysis in urine ... 63
xiii
5.2.7 Combination of biomarkers ... 64
5.3 Results ... 64
5.3.1Biomarkers in urine ... 64
5.3.1.1 Urinary porphyrin profile ... 64
5.3.1.2 ALA levels in urine ... 69
5.3.2 Combination of Biomarkers ... 69
5.3.2.1 Assessment of the exposure ... 69
5.3.2.2 Evaluation of the procedures ... 72
5.3.3 Determination of urinary Pb in x-rays workers ... 76
5.4 Discussion ... 76
5.4.1Biomarkers in urine ... 77
5.4.1.1 Urinary porphyrin profile ... 77
5.4.1.2 ALA levels in urine ... 78
5.4.2 Combination of Biomarkers ... 79
5.4.3 Determination of urinary Pb in x-rays workers ... 80
Chapter 6 – Concluding remarks and future perspectives... 82
6.1 Concluding remarks ... 83
6.2 Future Perspectives ... 84
References ... 86
xiv List of figures
Chapter 1
Figure 1.1 Porphyrin structure ... 2 Figure 1.2 Ultraviolet-Visible (UV-Vis) spectrum characteristic of porphyrins, with representation of the Soret and Q bands, between 350-750 nm ... 3 Figure 1.3 Heme biosynthetic pathway. ... 4 Chapter 3
Figure 3.1 Experimental design of the study of porphyrins preservation in urine samples. Each pool and aliquots were analysed on days 0, 7, 30 and 90. ... 27 Figure 3.2 Stability of Uro-, Hepta-, Hexa-, Penta- and Coproporphyrin over time (on days 0, 7, 30 and 90) in urine aliquots preserved at different temperatures (4º, -20º and -80º C), without addition of preservative ... 29 Figure 3.3 Stability of Uro-, Hepta-, Hexa-, Penta- and Coproporphyrin over time (on days 0, 7, 30 and 90) in a pool of urine preserved at different temperatures (4º, -20º and -80º C), without addition of preservative ... 30 Figure 3.4 Stability of Uro-, Hepta-, Hexa-, Penta- and Coproporphyrin over time (on days 0, 7, 30 and 90) in urine aliquots preserved with Na2CO3 at different temperatures (4º, -20º and -80º C) ... 31
Figure 3.5 Stability of Uro-, Hepta-, Hexa-, Penta- and Coproporphyrin over time (on days 0, 7, 30 and 90) in a pool of urine preserved with Na2CO3 at different temperatures (4º, -20º and -80º C) ... 32
Figure 3.6 Stability of Uro-, Hepta-, Hexa-, Penta- and Coproporphyrin over time (on days 0, 7, 30 and 90) in urine aliquots preserved with HCl at different temperatures (4º, -20º and -80º C) ... .33 Figure 3.7 Stability of Uro-, Hepta-, Hexa-, Penta- and Coproporphyrin over time (on days 0, 7, 30 and 90) in a pool of urine preserved with HCl at different temperatures (4º, -20º and -80º C) ... 34 Chapter 4
Figure 4.1 Absorption spectrum of acidified urine showing the procedure for the measurement of corrected absorbance (A) of the porphyrin peak ... 44 Figure 4.2 Linearity of coproporphyrin I standards (60, 90, 150 and 180 µg/L) in a water matrix at 400 nm: a) without extraction method; b) with Soulsby’ extraction method; UV-Vis spectrum of coproporphyrin I (180 µg/L) in a water matrix: c) without extraction method; d) with Soulsby’
extraction method. ... 45 Figure 4.3 Linearity of coproporphyrin III standards (90, 275, 375 and 475 µg/L) in a water matrix at 401 nm a) without extraction method b) with Soulsby’ extraction method; c) UV-Vis spectrum of
xv coproporphyrin III (375 µg/L) in a water matrix without extraction method d) UV-Vis spectrum of
coproporphyrin III (475 µg/L) in a water matrix with Soulsby’ extraction method. ... 46
Figure 4.4 Linearity of uroporphyrin I standards (180, 150, 90 and 60 µg/L) in a water matrix at 401 nm: a) without extraction method; b) with Soulsby’ extraction method; UV-Vis spectrum of uroporphyrin I (180 µg/L) in a water matrix: c) without extraction method; d) with Soulsby’ extraction method ... 47
Figure 4.5 UV-Vis spectra of coproporphyrin I (6 mg/L) in a urine matrix: a) with Soulsby’ extraction method; b) with Elder method ... 49
Figure 4.6 UV-Vis spectra of coproporphyrin III (9.5 mg/L) in a urine matrix: a) with Soulsby’ extraction method; b) with Elder method ... 50
Figure 4.7 UV-Vis spectra of uroporphyrin I (9.5 mg/L) in a urine matrix: a) with Soulsby’ extraction method; b) with Elder method. ... 51
Figure 4.8 UV-Vis spectra of a standards equimolar mixture (230 µg porphyrins/L) in a water matrix a) without an extraction method; b) with Soulsby’ extraction method; c) with Elder method. ... 52
Figure 4.9 UV-Vis spectra of a standards equimolar mixture (230 µg porphyrins/L) in a urine matrix a) with Soulsby’ extraction method b) with Elder method. ... 53
Figure 4.10 Comparison of urine coproporphyrin concentrations (N=63) determined by the Soulsby ‘method (x) and by HPLC (y). ... 54
Figure 4.11 Comparison of total porphyrin concentration (N=55) determined by the Elder method (x) and by HPLC (y) ... 55
Chapter 5 Figure 5.1 Urinary levels of uroporphyrin in each group (I, L, M, R, A, S, V and F) ... 64
Figure 5.2 Urinary levels of heptaporphyrin in each group (I, L, M, R, A, S, V and F) ... 65
Figure 5.3 Urinary levels of heptaporphyrin in each group (I, L, M, R, A, S, V and F) ... 65
Figure 5.4 Urinary levels of pentaporphyrin in each group (I, L, M, R, A, S, V and F) ... 66
Figure 5.5 Urinary levels of coproporphyrin in each group (I, L, M, R, A, S, V and F) ... 67
Figure 5.6 Comparison between the urinary porphyrin profiles (levels of uro, hepta, hexa, penta and copro) of all the analysed groups (I, L, M, R, A, S, v and F) ... 68
Figure 5.7 Urinary concentrations of ALA in each group (I, L, M, R, A, S, V and F) ... 69
Figure 5.8 Procedure proposed for individual assessment of the type of exposure in several exposed groups (L, M, R, A, S, V and F) through the determination of the urinary (U) porphyrin profile (the levels of Uro-, Hepta-, Hexa-, Penta-and Coproporphyrins) and levels of ALA. ... 70
xvi Figure 5.9 Procedure proposed for individual assessment of the type of environmental exposure in several exposed groups (L, A, S and V) through the determination of the urinary (U) porphyrin profile (the levels of Uro-, Hepta-, Hexa-, Penta-and Coproporphyrins) and levels of ALA. ... 71 Figure 5.10 Procedure proposed for individual assessment of the type of exposure in several exposed groups (M, R and F) through the determination of the urinary (U) porphyrin profile (the levels of Uro-, Hepta-, Hexa-, Penta-and Coproporphyrins) and levels of ALA ... 72 Figure 5.11 Graphical representation of each subject’s classification according to the type of exposure (L, M, R, A, S, V and F groups) applying their urinary (U) porphyrin profile and levels of ALA
through discriminant analysis. ... 73 Figure 5.12 Graphical representation of each subject’s classification according to the type of
environmental exposure (L, A, S and V groups), applying their urinary (U) porphyrin profile and levels of ALA through discriminant analysis. ... 74 Figure 5.13 Graphical representation of each subject’s classification according to the type of active exposure (M, R and F groups), applying their urinary (U) porphyrin profile and levels of ALA through discriminant analysis ... 75
xvii
List of Tables
Chapter 1
Table 1.1 Normal concentrations of porphyrins in urine for human subjects ... 3 Table 1.2 Clinical classification of porphyrias: mode of genetic transmission, enzyme deficiency, tissues involved, clinical manifestations and patterns of overproduction of porphyrins and heme precursors in urine ... 5 Table 1.3 Various causes and conditions related to changes in urinary porphyrin excretion ... 7 Chapter 3
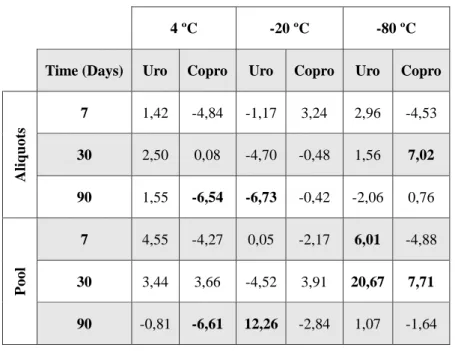
Table 3.1 Differences in percentage (%) of concentrations of uro- and coproporphyrin over time (on days 7,30 and 90) compared with the initial concentration (t=0), in urine aliquots and in urine pool, without preservative. ... 35 Table 3.2 Differences in percentage (%) of concentrations of uro- and coproporphyrin over time (on days 7,30 and 90) compared with the initial concentration (t=0), in urine aliquots and in urine pool, with Na2CO3 ... 36
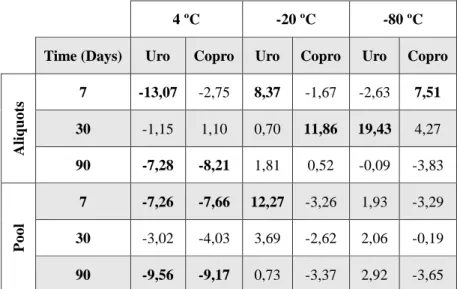
Table 3.3 Differences in percentage (%) of concentrations of uro- and coproporphyrin over time (on days 7,30 and 90) compared with the initial concentration (t=0), in urine aliquots and in urine pool, with HCl ... 36 Table 3.4 Differences in percentage (%) of concentrations of uro- and coproporphyrin over time (on days 7, 30 and 90), preserved in Na2CO3 or HCl, compared with the concentration of urine aliquots
and pool without preservative added ... 37
Chapter 4
Table 4.1 Comparison of Soret maximum band and molar extinction coefficients (ɛ) of
Coproporphyrin I and III and Uroporphyrin I, under our experimental conditions vs values reported in the literature ... 48 Table 4.2 Quantification Limit (QL) and Detection Limit (DL) obtained for coproporphyrins
standards in a water matrix, analysed by the spectrophotometric method (Soulsby) and the HPLC method (Woods). ... 54
Chapter 5
Table 5.1 Description and origin of the groups whose biological samples were analysed in this
chapter. ... 62 Table 5.2 Identification of exposed subjects (from L, M, R, A, S, V and F groups) using their
individual urinary (U) porphyrin profile (levels of Uro-, Hepta-, Hexa-, Penta- and Coproporphyrin) and levels of ALA.... ... 72
xviii Tabel 5.3 Identification of exposed subjects (from L, A, S and V groups) using their individual
urinary (U) porphyrin profile (levels of Uro-, Hepta-, Hexa-, Penta- and Coproporphyrin) and levels of ALA ... 74 Table 5.4 Identification of active exposed subjects (from M, R and F groups) using their individual urinary (U) porphyrin profile (levels of Uro-, Hepta-, Hexa-, Penta- and Coproporphyrin) and levels of ALA. ... 75 Table 5.5 Comparison between urinary concentration of Pb (µg/L and µg/g creat) and urinary levels of ALA (mg/L and mg/g creat), in a group of x-rays workers. ... 76 Appendices
Appendix 1
Table A1.1 Concentration of Uro-, Hepta-, Hexa-, Penta- and Coproporphyrin along time (0, 7, 30 and 90 days) in urine samples, aliquots or pool, preserved at different temperatures (4º, -20º and -80º C), without additional preservative. ... 94 Table A1.2 Concentration of Uro-, Hepta-, Hexa-, Penta- and Coproporphyrin along time (0, 7, 30 and 90 days) in urine samples, aliquots or pool, preserved at different temperatures (4º, -20º and -80º C), with Na2CO3, as preservative. ... 94
Table A1.3 Concentration of Uro-, Hepta-, Hexa-, Penta- and Coproporphyrin along time (0, 7, 30 and 90 days) in urine samples, aliquots or pool, preserved at different temperatures (4º, -20º and -80º C), with HCl, as preservative. ... 95
Table A1.4 Standard-Deviation of Uro-, Hepta-, Hexa-, Penta- and Coproporphyrin’ concentrations along time (0, 7, 30 and 90 days) in urine samples, aliquots or pool, preserved at different
temperatures (4º, -20º and -80º C), without additional preservative ... 95 Table A1.5 Standard-Deviation of Uro-, Hepta-, Hexa-, Penta- and Coproporphyrin’ concentrations along time (0, 7, 30 and 90 days) in urine samples, aliquots or pool, preserved at different
temperatures (4º, -20º and -80º C), with Na2CO3 as preservative ... 96
Table A1.6 Standard-Deviation of Uro-, Hepta-, Hexa-, Penta- and Coproporphyrin’ concentrations along time (0, 7, 30 and 90 days) in urine samples, aliquots or pool, preserved at different
temperatures (4º, -20º and -80º C), with HCl as preservative ... 96 Appendix 2
Table A2.1 Concentration of urinary coproporphyrin (µmol copro/g creat) and total urinary porphyrin concentration (µmol porphyrins/g creat) of subjects, analysed by different methods: Soulsby Method (coproporphyrin), Elder Method (total porphyrin) and HPLC method (copro and total porphyrins). ... 97 Table A2.2 Correlation test and mean value of results obtained for the samples analysed by the
xix Table A2.3 Correlation test and mean value of results obtained for the samples analysed by the Elder and HPLC method. ... 99
Appendix 3
Table A3.1 Concentration of Uro-, Hepta-, Hexa-, Penta- and Coproporphyrin (nmol/g creat) and ALA levels (mg/g creat) from 63 subjects of Portuguese sob-populations exposed in different contexts to heavy metals. ... 99
xx List of Abbreviations
(ɛ) Molar Extinction Coefficient AIP Acute Intermittent Porphyria ALA Delta-Aminolevulinic acid
ALAD Delta-Aminolevulinic Acid Dehydratase ALAS Delta-Aminolevulinic Acid Synthase
As (III-) Arsenite
AS (V) Arsenate As Arsenic
ASTDR Agency for Toxic Substances and Disease Registry Ba Barium
BEI Biological Exposure Index Cd Cadmium Co Cobalt Copro Coproporphyrin Cr Chromium Creat Creatinine Cu Copper DL Detection Limit
DNA deoxyribonucleic acid EPP Erythropoietic Protoporphyria
FAB-MS Fast Atom Bombardment Mass Spectrometry
GFAAS Graphite Furnace Atomic Absorption Spectrophotometry HBV Hepatitis B Virus HCl Hydrochloric Acid HCP Hereditary Coproporphyria HCV Hepatitis C Virus Hepta Heptaporphyrin Hexa Hexaporphyrin Hg Mercury
xxi HIV Human Immunodeficiency Virus
HPLC High Performance Liquid Chromatography
HPLC/ESI MS/MS HPLC/Electrospray Ionization Tandem Mass Spectrometry LCMS Liquid Chromatography-Mass Spectrometry
LC-MS/MS Liquid Chromatography Tandem Mass Spectrometry
MALDI-TOF Matrix-Assisted Laser Desorption Ionization/Time-of-Flight Mass Spectrometry MMT Methylcyclopentadienyl Manganese Tricarbonyl
Mn Manganese Mo Molybdenum Ni Nickel
OEL-TWA Occupational Exposure Limit-Time Weighted Average Pb Lead
PBG Porphobilinogen
PBG-D Porphobilinogen Deaminase PEL Permissible Exposure Limit Penta Pentaporphyrin
QL Quantification Limit
RFLPs Restriction Fragment Length Polymorphisms ROS Reactive Oxygen Species
SD Standard Deviation U Urinary
Uro III-S Uroporphyrinogen III Synthase Uro Uroporphyrin
Uro-D Uroporphyrinogen Decarboxylase UV-Vis Ultraviolet-Visible
V Vanadium
VDR Vitamin D Receptor VP Variegate Porphyria
WHO World Health Organization Zn Zinc
xxii List of Chemical Formulas
(H2O2) Hydrogen peroxide
(Na2CO3) Sodium Carbonate
(O2− •) Superoxide ion
1
Chapter I
2 1.1 Porphyrins
The porphyrins are a class of naturally occurring macrocyclic compounds, which play a very important role in the metabolism of living organisms. The porphyrin molecule contains four pyrrole rings linked via methine bridges (Fig. 1.1) (Biesaga et al., 2000). The size of the
porphyrin-macrocycle is perfectly suited to bind almost all metal ions and indeed many metals can be inserted in the center of the macrocycle, forming metallo-porphyrins that play key roles in several biochemical processes, like photosynthesis, oxygen transport and in various redox reactions (Biesaga et al., 2000; Giovannetti, 2012).
Fig. 1.1 Porphyrin structure (Biesaga et al., 2000).
From the perspective in coordination chemistry, the porphyrin ligand has turned out to be very versatile, and almost all metals have been combined with porphyrins. Such complexes have been used in a variety of applications as models for biological electron transport, oxygen transport,
metalloenzymes and in cancer medicine and photodynamic therapy (Biesaga et al., 2000; Goldoni, 2002; Wiglusz et al., 2004). In recent years, (metallo)porphyrins and porphyrin-metal interfaces have become a major interest for applications in opto-electronics, data storage and solar cells (Goldoni, 2002).
Porphyrins, in the reduced form, porphyrinogens, are formed in mammalian tissues as
intermediates in the biosynthesis of heme. In most tissues, porphyrinogens with 8-, 7-, 6-, 5-, and 4-carboxylated side chains are produced more than required for heme biosynthesis and are excreted as porphyrins in the urine (Woods, 1996). The pattern of porphyrin excretion in normal individuals is represented in Table 1.1.
3 Table 1.1 Normal concentrations of porphyrins in urine for human subjects (Abe and Konaka, 1989).
Porphyrin Sex nmol/L nmol/g creatinine
Uroporphyrin M 5.5-50.8 6.0-17.3 F 5.1-39.0 5.3-18.6 Heptaporphyrin M 2.7-16.8 2.3-6.1 F 2.4-13.6 2.7-6.2 Hexaporphyrin M <1.0 <1 F <1.0 <1 Pentaporphyrin M 1.0-8.0 1.0-3.3 F 1.3-5.3 1.0-4.2 Coproporphyrin I M 22.2-167.1 27.2-78.3 F 23.5-117.9 24.2-73.2 Coproporphyrin III M 63.0-358.6 46.3-207.0 F 44.3-247.2 40.2-137.8
In relation to the electronic absorption of porphyrins, they display extreme intense bands, the so-called Soret or B-bands, in the 380–500 nm range with molar extinction coefficients of 105 M-1 cm-1. Moreover, at longer wavelengths, in the 500–750-nm range, their spectra contain a set of weaker,
but still considerably intense Q bands with molar extinction coefficients of 104M-1cm-1(Fig. 1.2)
(Biesaga et al., 2000; Giovannetti, 2012; Polo et al., 1988).
Fig. 1.2 Ultraviolet-Visible (UV-Vis) spectrum characteristic of porphyrins, with representation of the Soret and Q bands, between 350-750 nm (Goldoni, 2002).
Electronic absorption and spectra emission of porphyrins are sensitive to processes such as metalation, protonation (pH), substitution, or dimerization, which make porphyrins useful sensors of their environmental surroundings (Wiglusz et al., 2004). The change in spectra upon addition of acid or basic substances can generally be attributed to the attachment or the loss of protons (Giovannetti, 2012). For the main peak of the excitation spectra, fluorescence depends on pH and is minimal near
Wavelength (nm) Abs o rb an ce
4 pH 5 and near pH 7-7.5 for coproporphyrin (copro) and uroporphyrin (uro), respectively (Polo et al., 1988).
Porphyrinogens are the actual products of porphyrin metabolism in vivo, and fully half of the porphyrins in urine may be present in this form. These colorless nonfluorescent compounds require oxidation to porphyrins before spectrophotometric or fluorometric analysis (Westerlund et al., 1988).
1.2 Porphyrias
Eight enzymes bring about heme synthesis from glycine and succinyl CoA. The biosynthetic pathway begins in the mitochondria and after three cytoplasmic stages the final step of heme
formation takes place again in the mitochondria (Fig. 1.3). The first enzyme, delta-aminolevulinic acid synthase (ALAS), is the rate limiting enzyme in the production of heme and is controlled via negative feedback regulation by the intracellular heme concentration (Fateen et al., 2011).
Fig.1.3 Heme biosynthetic pathway. Steps are catalyzed by (1) aminolevulinic acid synthetase (ALAS), (2) ALA dehydratase (ALAD), (3) uroporphyrinogen I synthetase, (4) uroporphyrinogen III cosynthetase, (5) uroporphyrinogen decarboxylase, (6)
corporpophyrinogen oxidase, (7) protoporphyrinogen oxidase, and (8) ferrochelatase. Adapted from Woods et al, 1996.
Enzyme defects in the heme biosynthetic pathway cause genetic diseases called porphyrias which are characterized by the excessive production, accumulation and excretion of porphyrins and/or porphyrin precursors (Danton and Lim, 2006). Porphyrias are often classified as hepatic or erythropoietic, according to the organ where heme precursors accumulate. Specific patterns of accumulation of the precursors delta-aminolevulinic acid (ALA), porphobilinogen and porphyrins are associated with characteristic clinical features: acute neurovisceral attacks, skin lesions or both (Table 1.2) (Deacon and Elder, 2001; Fateen et al., 2011).
5 Table 1.2 Clinical classification of porphyrias: mode of genetic transmission, enzyme deficiency, tissues involved, clinical manifestations and patterns of overproduction of porphyrins and heme precursors in urine. Adapted from (Deacon and Elder, 2001; Hindmarsh, 2003; Woods, 1996).
Porphyria Mode of genetic
transmission Enzyme deficiency Tissues
Clinical Manifestation Porphyrins and Heme precursors in urine Acute Porphyrias Acute Intermittent Porphyria (AIP)
Auto Dom PBG deaminase Liver Viscero-Neurological
ALA, Copro
ALA dehydratase Porphyria
Auto Recess ALA dehydratase Liver Viscero-Neurological
ALA, Copro Variegata
Porphyria
Auto Dom Protoporphyrinogen oxidade Liver Viscero-Neurological, Photosensitivity ALA, PBG, Copro Hereditary Coproporphyria
Auto Dom Coproporphyrinoge n oxidase Liver Viscero-Neurological, Photosensitivity ALA, PBG, Copro Non-Acute Porphyrias Congenital Erythorpoietic
Auto Recess Uroporphyrinogen- III synthase Erythroid cells Photosensitivity Copro Porphyria Cutanea tarda Sporadic Auto Dom Uroporphyrinogen descarboxylase
Liver Photosensitivity Uro and Hepta Erythropoietic
protoporphyria
Auto Dom Ferrochelatase Erythroid cells and liver Photosensitivity Copro Hepatoerythropoi etic porphyria (HEP)
Auto Recess Uroporphyrinogen descarboxylase Erythroid cells and liver Photosensitivity, Viscero-Neurological Uro and Hepta
Auto Dom= Autosomal Dominant; Auto Recess= Autosomal Recessive
Treatment of porphyrias is based on symptomatic relief, together with carbohydrate (glucose) loading and in more severe attacks, heme therapy, which repress ALAS. However, glucose treatment is not as efficient as exogenous heme administration to achieve clinical remission in serious acute intermittent porphyria attacks (Sardh et al., 2009).
Although the porphyrias are uncommon disorders of heme biosynthesis, the wide range and variability of their clinical features leads to their inclusion in the differential diagnosis of many diseases. The porphyrias constitute a group of diseases for which the clinician requires the assistance of the laboratory to make a diagnosis. Therefore, every acute hospital laboratory needs to have simple, reliable methods for their exclusion or for the identification of those few patients who need more specialised further investigation (Deacon and Elder, 2001).
Clinical and biochemical diagnosis of the porphyrias is a difficult task and is currently based upon review of the clinical features and measurement of the various porphyrin metabolites in body fluids. Different techniques are available for the diagnosis of the porphyrias and the identification of
6 the eventual defect(s), ranging from simple biochemical measurement of ALA and porphobilinogen (PBG) through enzymatic assays to the investigation of genetic abnormalities (Deacon, 1988; Hindmarsh, 2003). A proposed algorithm for the biochemical investigation of acute porphyrias is proposed by Hindmarsh (2003).
Since the porphyrin excretion pattern is characteristic for each of the hereditary porphyrias, High Performance Liquid Chromatography (HPLC) porphyrin profiles have been used for their differential diagnosis (Deacon, 1988).
Except for the use of erythrocyte porphobilinogen deaminase activity to confirm the diagnosis of acute intermittent porphyria (AIP), enzyme assays have little to offer in the routine investigation of these diseases. Enzyme assays are often difficult to perform, and the relevant tissues are difficult to obtain. Genetic analysis provides a more accurate diagnosis and other benefits in AIP, variegate porphyria (VP), hereditary coproporphyria (HCP), and erythropoietic protoporphyria (EPP) (Hindmarsh et al., 1999a).
1.3 Changes in urinary porphyrins excretion
Usually changes in urinary porphyrins excretion are a sign of porphyria or intoxication with heavy metals or halogenated aromatic hydrocarbons (Table 1.3).They can also occur in individuals infected by some viruses such as Hepatitis B Virus (HBV), Hepatitis C Virus (HCV) and Human Immunodeficiency Virus (HIV) or exposed to illicit or therapeutic drugs like alcohol, to prolonged therapeutic use of estrogens, to iron overload, and as adverse effects of drugs like anticonvulsants or anaesthetics (Alves et al., 2009; Doss et al., 2000; Ford et al., 1981).
Drugs and chemicals, heavy metals and alcohol are known to be significant and frequent factors in the induction and maintenance of subclinical and clinical disturbances of porphyrin
metabolism, including hepatic porphyrias. Especially acute hepatic porphyrias are triggered by drugs and/or alcohol and have therefore been designated as “pharmacogenetic diseases”(Moore, 1998).
Chronic alcoholics have an increased urinary excretion of copro, mainly isomer 3, but a normal urinary excretion of uro, ALA, and PBG. Ethanol administration to normal subjects results in increased activity of leucocyte ALAS and erythrocyte porphobilinogen deaminase, the two rate-controlling enzymes of the heme pathway. Ferrochelatase, the enzyme that inserts iron into
protoporphyrin to form heme, shows very marked depression, existing also a prolonged depression in uroporphyrinogen decarboxylase too (Alves et al., 2009; Moore, 1998).
7 Table 1.3 Various causes and conditions related to changes in urinary porphyrin excretion (Doss et al., 2000).
(1) Intoxications: alcoholism (acute and/or chronic); foreign and environmental chemicals, such as
hexachlorobenzene, polyhalogenated biphenyls, dioxins, vinyl chloride, carbon tetrachloride, benzene, chloroform; heavy metals such as lead, arsenic, mercury, etc.; drugs
(2) Liver diseases: e.g. cirrhosis, hepatitis, fatty liver, cholestasis, alcoholic liver syndromes, drug
injury, cholangitis, haemochromatosis
(3) Haematological diseases: e.g. haemolytic, drug-induced, sideroachrestic, sideroblastic, aplastic
anaemias; ineffective erythropoiesis (intramedullary haemolysis); pernicious anaemia; thalassaemia; leukaemia, erythroblastosis
(4) Infectious diseases: acute poliomyelitis (5) Diabetes mellitus
(6) Disturbance of iron metabolism: e.g. haemosiderosis, idiopathic haemochromatosis (7) Hereditary hyperbilirubinemias: e.g. Dubin–Johnson syndrome, Rotor's syndrome (8) Malignancies: e.g. hepatocellular tumours, hepatic metastases, pancreatic carcinoma,
lymphomatosis and other neoplastic processes
(9) Myocardial infarction
(10) Adverse effects of drugs: analgesics, sedatives, hypnotics, antibiotics, sex hormones, i.e. estrogens
and oral contraceptives, and narcosis
(11) Pregnancy (12) Fasting
1.4 Heavy Metals
Heavy metals are naturally found on earth’s crust and have been used in many different applications over decades (Yousaf et al., 2016). Generic sources of heavy metals include mining and industrial production such as foundries, smelters, oil refineries, petrochemical plants and chemical industry, untreated sewage sludge, disperse sources such as metal piping, traffic and combustion by-production from coal burning power plants. Atmospheric emissions are probably the most harmful to the environment, and consequently, to human health due to either the great quantity involved, or their widespread dispersion which may originate many different exposure pathways (Dinis and Fiúza, 2011). Heavy metals exposure result from many unusual activities and sources and can come in contact with humans by a wide range of processes and pathways.
1.4.1Environmental Exposure to heavy metals
Heavy metals such as lead (Pb), mercury (Hg), cadmium (Cd) and arsenic (As) constitute a significant potential threat to human health. The environmental persistence of metals in concert with their intensive use by modern society have, over the years, created metal accumulation in the
biosphere. The exposure may be through air, food or drinking water and depends on the metal type, its elemental/inorganic/organic form and exposure level (Kakkar and Jaffery, 2005; Kozlowska et al., 2003; Scherer, 2005; Yousaf et al., 2016).
Most of heavy metals bind to the sulfhydryl groups of biological molecules thus inhibiting enzyme activity, disrupting cellular transport and causing changes in protein functions. The toxicity of heavy metals includes the blocking of functional groups of important molecules, e.g. enzymes,
8 from cellular sites. While assessing the risk due to heavy metal exposure, factors such as age, sex, nutrition, socio-economic status, exposure conditions, duration of exposure, genetic variability and susceptibility have to be considered for a realistic approach (Calderón et al., 2003; Kakkar and Jaffery, 2005).
Assessing the risk of pollutant exposure in human populations involves the measurement of specific chemical residues in soil/water/air or in tissues of habituating populations. The use of biological markers or biomarkers may provide important information concerning human´s exposure (Kakkar and Jaffery, 2005).
1.4.1.1 Heavy Metals in urban environments
In an urban environment, trace metals can be emitted from numerous anthropogenic sources. Activities with a noticeable impact on the urban environment typically include traffic-related
activities, industry-specific activities, the disposal of municipal waste (incineration or landfill), and the corrosion of construction/building materials. Those deposited on land in an urban setting can be readily relocated and dispersed by wind, rain, and surface runoff (Wong et al., 2006).
The prolonged presence of these contaminants in urban environment, particularly in urban soils, and their proximity to the human population, can significantly amplify the exposure of the urban population to metals (Zhang et al., 1999). The direct health impact of trace metal contamination of the urban environment are usually difficult to assess due to the complexity of the medical factors involved (Vlahov and Galea, 2002).
Compelled by the growing environmental and health awareness of the general public, assessment of an array of trace metals in soils, sediments, water, air, as well as food are demanded by regulatory guidelines. Those routinely regulated trace metals include As, Barium (Ba), Cd, Cobalt (Co), Chromium (Cr), Copper (Cu), Hg, Pb, Molybdenum (Mo), Nickel (Ni), Vanadium (V), and Zinc (Zn) (Wong et al., 2006).
1.4.2 Occupational exposure to heavy metals
Major sources of occupational exposure to heavy metals are smelters, mining activities and hazardous waste sites. Pyrometallurgical nonferrous metal production is the major global source of airborne As, Cd, Cu, Zn, and Pb. The metallurgical are also primary sources of Cd, Ni, and Pb for aquatic ecosystems, whereas for soil the most important sources of metals worldwide are mine tailings, smelter wastes, and atmospheric fallout. As a result, metal accumulation in air, water, soil, and food (fish, grains, etc.), may be higher than background levels in areas located in the vicinity of smelters and mines (Calderón et al., 2003).
Around smelters and mining areas, metals are commonly present as mixtures. Mixtures can influence expected adverse health effects because their components can individually have affinity for the same organs or, together, overwhelm a particular mechanism the body uses to defend itself against toxic substances. Thus, sometimes, metal mixtures can interact in the body in such a way that the combined toxicity is more serious than the individual toxicity of each metal alone. This way, low doses that might not individually cause adverse health effects, together may become a public health issue (Calderón et al., 2003).
9 Potentially high Pb levels may occur in the following industries: Pb smelting and refining industries, battery manufacturing plants, steel welding or cutting operations, construction, rubber products and plastics industries, printing industries, firing ranges, radiator repair shops, and other industries requiring flame soldering of Pb solder. In these work areas, the major routes of Pb exposure are inhalation and ingestion of Pb bearing dusts and fumes. A permissible exposure limit (PEL) for Pb of 50 μg/m3 in the workplace was established (Agency for Toxic Substances and Disease Registry, 2005).
Occupational exposure to As has been reported in several industries, particularly in nonferrous smelting, electronics, wood preservatives, As production, glass manufacturing, and application of arsenical pesticides. Those at primary risk include workers in numerous industries, including
manufacture and use of insecticides, weed killers, wood preservatives, glass production, metal refining and in some medicines. (Kakkar and Jaffery, 2005; Rodríguez et al., 2003).
Occupational exposure to Manganese (Mn) occurs in various industrial processes such as welding, ferroalloy steel production and dry cell battery manufacturing. Mn is also found at high concentrations in several other industrial settings, such as the production of Mn-containing organic pesticides, fireworks, ceramics, glass, leather, textiles, paint, and cosmetics (Andrade et al., 2015; Bader et al., 1999). A significant number of studies have shown that welders are exposed to high concentrations of Mn-containing welding fumes which leads to increased prevalence of
neurobehavioral symptoms among them. Several neurobehavioral symptoms have also been reported among the ferroalloy smelting workers exposed to Mn (Hassani et al., 2016).
The current Occupational Exposure Limit-Time Weighted Average for Mn (OEL-TWA; 0.2 mg/m3) seems not to provide sufficient protection against the neuropsychological effects. So, an adjustment is needed to modify the current OEL-TWA of Mn for a better protection of exposed workers (Hassani et al., 2016).
1.4.2.1 Mine Workers
Mining plays an important role in both local and national economies, however, in some locations the activity is still performed in an uncontrolled way, giving rise to soil erosion and serious environmental contamination (Coelho et al., 2012).
Activities associated with mining are also hazardous activities, in both the environmental and public health contexts. Mining activities may adversely affect the health of miners and the
communities living near mine sites, and these effects may persist even after the mine is closed (Coelho et al., 2012).
The mine workers are exposed to a large amount of dust with various potentially toxic substances for eight hours/day and six days/week over a lifetime of work (Coelho et al., 2012). The common toxicants present in the mining environment are Pb, Hg, Cd, Mn, As, aluminium and fluoride. Inhalation and absorption through the skin are common routes of exposure, and the
conditions of work often intensify exposure due to increased respiration rates and repetitive exposure to toxicants. Low-dose chronic exposure of toxic substances results in the accumulation of toxicants in the body. Hence, there is a need to monitor the mining environment as well as the miners due to the exposure to these toxicants (Dhatrak and Nandi, 2009).
10 1.4.3 Heavy Metals in Cigarette Smoke
From the point of conception and throughout life, humans experience a broad range of
physical, chemical and biological exposures. The health effects of such exposures will depend not only on dose but also on their interaction with each chemical and with the characteristics of the individual, such as age, sex and lifestyle (Berglund et al., 2011; Ellis et al., 2012).
The use of cigarettes constitutes one of the major causes of morbidity and mortality in the world. Tobacco smoke has several toxic properties, including genotoxic, and carcinogenic properties. Containing 4000 identified chemical compounds, cigarette smoke is very harmful for human health. Among these toxic materials there are heavy metals, particularly Cd and Pb. Several heavy metals found in tobacco smoke such as Cd, Cr, Pb, and Ni also accumulate in tissues and fluids through smoking (Ashraf, 2012; Kossowska et al., 2010; Lazarević et al., 2012).
Heavy metal content in tobacco depends on soil properties, atmospheric conditions, and requirements for tobacco farming (use of pesticide and fertilizer). Tobacco plants absorb Pb and As from soil and concentrate these metals in leaves. For this reason, there are large variations in the content of metals in tobacco between countries (Lazarević et al., 2012).The mean content of Pb in cigarettes is 1.26 μg/g and As is 0.11 μg/g (Ashraf, 2012; Lazarević et al., 2012; Pappas, 2011).
Tobacco is an important source of Pb in passive smokers (children and adolescents). Blood Pb levels were 14% and 24% higher in children who lived with 1 or with 2 or more smokers than in children living with non-smokers (Lazarević et al., 2012; Pappas, 2011).
As is methylated and eliminated from the body through the urine. Cigarette smoking lowers methylation capacity of As and its elimination from the body. Cigarette smoking can also act synergistically with As exposure to cause DNA damage in lungs. Mortality risk from heart disease, skin lesion, bladder cancer, and lung cancer associated with exposure to As is higher among smokers (Lazarević et al., 2012).
Mn (II) complexes have been studied in tobacco. U.S. Environmental Protection Agency Reports stated that compounds of Mn were suspected of inducing or exacerbating asthma. Mn(II) has been shown to cause pulmonary inflammation in rats, though not as strongly as Cu or Ni (Pappas, 2011).
Smokers had lower copro and uro + copro porphyrin levels, however there are few published data relating changes in urinary porphyrin excretion to the smoking habit. Further studies are needed to properly address these findings (Alves et al., 2009).
Biomonitoring of the exposure to complex mixtures such tobacco smoke is a challenge since these exposures have many constituents and people is exposed to more than one type of mixtures. Also, a panel of biomarkers of effect should cover the major known adverse effects of smoking (e.g., oxidative stress, inflammatory processes, lipid peroxidation, lipometabolic disorders and mutagenic effects) (Scherer, 2005).
11
1.4.4 Sources and toxicity of Pb, As and Mn
1.4.4.1 Pb
Pb is one of the most abundant toxic metals in the Earth’s crust. It has been used since prehistorical times and has become widely distributed and mobilized in the environment. Exposure to Pb in the environmental and occupational settings continues to be a serious public health problem (Kakkar and Jaffery, 2005). At high exposure levels, Pb produces alterations in cognitive development in children; and kidney damage, anaemia and hypertension mainly in adults. About 50% of Pb is absorbed through the inhalation of dusts, 10–15% orally absorbed, out of which 90% accumulated in the bones (Ahamed and Siddiqui, 2007; Kakkar and Jaffery, 2005).
Acute toxicity of Pb is rare but may occur with adulterated food or drink. Wrist drop may occur as late sign of intoxication in exposed workers. Other effects include reduced life span of erythrocytes, impairment of proximal tubular function, reduced sperm count and mobility. In babies from exposed pregnant women a reduced birth weight can be observed (Kakkar and Jaffery, 2005).
Oxidative stress appears to be a possible mode of action of Pb toxicity. Oxidative stress occurs when generation of free radicals (i.e. substances with one or more unpaired electrons) exceed the capacity of antioxidant defence mechanisms (i.e. pathways that provide protection against harmful effect of free radicals) (Ahamed and Siddiqui, 2007).
The participation of free radicals in Pb toxicity may occur at different levels: (i) inhibition of delta-aminolevulinic acid dehydratase (ALAD) that leads to the accumulation of its substrate ALA, which can be quickly oxidized to generate free radicals as superoxide anion (O2− •), hydroxyl radical
(OH•), and hydrogen peroxide (H2O2), and (ii) stimulation of ferrous ion initiating membrane lipid
peroxidation (Ahamed and Siddiqui, 2007).
1.4.4.2 As
As is a common environmental contaminant widely distributed around the world. Elevated As levels in the environment are attributable to both natural and anthropogenic sources, including
geothermal discharges, industrial products and wastes, agricultural pesticides, wood preservatives and mine drainage.
Human exposure to this metalloid comes from well water and contaminated soil, from occupational exposure, and from fish and other marine organisms rich in methylated As species. Researchers observed that concentrations more than 300 µg/L were associated with arsenical lesions (Rodríguez et al., 2003).
Human oral exposure to As has been mainly related to bladder, kidney, liver and skin cancer, while exposure through inhalation has been linked to lung cancer. As exposure is also associated with peripheral neuropathy and peripheral vascular disorders such as black foot disease, a disorder which results in gangrene of the lower extremities. Once absorbed, As is stored in the liver, kidney, heart and lung, while lower amounts are present in muscle and neural tissue. Two to four weeks after As
ingestion, it is incorporated into the nails, hair, and skin by binding to keratin sulfhydryl group (Ng et al., 2005; Rodríguez et al., 2003).
12 Acute exposure to As in humans has been shown to result in memory problems, difficulty concentrating, mental confusion and anxiety. In children chronically exposed to As, urine levels of this metalloid were inversely correlated with verbal Intelligence Quotient (IQ) scores, including verbal comprehension and long-term memory (De Vizcaya-Ruiz et al., 2009; Rodríguez et al., 2003).
Reactive oxygen species generation (ROS) associated with As exposure is known to play a fundamental role in the induction of its adverse health effects and diseases (De Vizcaya-Ruiz et al., 2009). Better and more epidemiological studies are required for the identification of biomarkers for As exposure and health effects (Kakkar and Jaffery, 2005).
1.4.4.3 Mn
Mn is an essential element for the proper functioning of plants, animals, and humans. A deficiency of Mn can lead to serious health effects, such as the impairment of neurological functions, seizures, osteoporosis, and mental retardation. However, in the presence of high Mn concentrations, it is a neurotoxin and can cause irreversible neurological disease, for example, in cases of industrial exposure. Prolonged and subclinical Mn exposure is also suspected to cause cancer, neurologic and psychiatric disorders, including Parkinson’s- and schizophrenia-like symptoms (Andrade et al., 2015). Methylcyclopentadienyl manganese tricarbonyl (MMT), an organometal, was introduced to unleaded gasoline as an antiknock agent. Levels of Mn in the urban environment were therefore anticipated to rise (Kakkar and Jaffery, 2005).
Epidemiological data suggest that high Mn concentrations in drinking water may be associated with neurological impairment. Nevertheless, neurotoxic effects induced by Mn in humans emerge mostly subsequent to inhalation exposure where the metal can enter the brain through the olfactory pathways, providing a direct path into brain tissue (Bader et al., 1999). High inhaled Mn levels may lead to manganism, a neurodegenerative disorder that resembles Parkinson disease in both
symptomatology and some of the underlying cellular mechanisms. In the early stages of intoxication, the symptoms may be reversible (Andrade et al., 2015; Bader et al., 1999).
1.5 Biomarkers
A biomarker is defined as a xenobiotically induced alteration in cellular or biochemical components or processes, structures or functions, which is measurable in a biological system or sample (Gil and Pla, 2001; Marchiset-Ferlay et al., 2012).
Validation criteria for a biomarker include intrinsic qualities such as specificity, sensitivity, knowledge of background level in the population, existence of dose–response relationships, degree of inter- and intra-individual variability and knowledge of the kinetics, confounding and modifying factors. In addition, properties of the sampling and analytical procedures are of relevance, including constraints and non-invasiveness of sampling, stability of sample as well as simplicity, high
sensitivity, specificity and quickness of the analytical method (Gil and Pla, 2001; Scherer, 2005). Non-invasive methods are preferred over invasive methods because of greater acceptability. They are expired air, saliva, semen, urine, sputum, hair, nails, faeces, and breast milk. Invasive methods may yield samples from blood, lung tissue, bone marrow, amniotic fluid, liver tissue, bone, follicular fluid or adipose tissue (Kakkar and Jaffery, 2005).
13 Biomarkers of exposure allow measurement of the internal dose by chemical analysis of the toxic compound or metabolite in body fluids or excreta such as blood, urine and exhaled air. Internal dose may also mean the amount of a chemical stored in one or several body compartments or in the whole body. This usually applies to cumulative toxic chemicals (Gil and Pla, 2001). The measurement of the ‘external dose’ is for example Pb air concentration at the workplace or in the residential, rural or urban areas, multiplied by the time spent at these places. The ‘biologically effective dose’ (or ‘target dose’) is the amount of agent reaching the target organ and target cells (Scherer, 2005).
Biomarkers of susceptibility serve as indicators of a sensitivity of individuals to the effect of a xenobiotic or to the effects of a group of compounds. They can be genetic markers that include alterations in chromosomal structure, such as restriction fragment length polymorphisms (RFLPs), polymorphism of enzyme activities, and others (Scherer, 2005).
Response or effect biomarkers are indicative of biochemical changes within an organism due to exposure to the xenobiotic. The ideal biomarker should be detected early and be able to show adverse effects before they are irreversible. Those are the most studied biomarkers and they include modifications in some parameters of blood composition, alterations of specific enzyme activities, the appearance of DNA adducts, localized mRNA and protein increased and the appearance of specific antibodies against a xenobiotic or a particular cellular fraction (Gil and Pla, 2001).
As conclusion, we may say that the markers of biological toxicity represent an important tool in toxicology for three main reasons: they allow estimation of the biological effect on the target tissue, they are markers of subclinical alterations and sensible indicators of pathology being useful in
diagnostic and preventive strategies, and they consider inter- and intra-individual variability in xenobiotics response (Gil and Pla, 2001).
1.5.1 Biomarkers of Pb, As and Mn 1.5.1.1 Pb
The ideal biomarker of Pb exposure would be a measurement of total Pb body burden. Biomarkers of exposure in practical use today are measurements of total Pb levels in tissues or body fluids, such as blood, bone, urine, or hair (Agency for Toxic Substances and Disease Registry, 2005).
Measurement of Pb in blood is the most widely used biomarker of Pb exposure. The biological exposure index (BEI) for Pb in blood of exposed workers is 30 μg/dL (Abadin et al., 2007).
The development of non-invasive techniques for measuring Pb concentrations in bone has enabled the exploration of bone Pb as a biomarker of Pb exposure in children and in adults. Pb in bone is considered a biomarker of cumulative exposure to Pb because Pb accumulates in bone over the lifetime and most of the Pb body burden resides in bone (Abadin et al., 2007).
Pb inhibits several enzymes in heme biosynthetic pathway, including ALAD,
coproporphyrinogen oxidase and ferrochelatase. Because Pb effectively inhibits ALAD activity, resulting in accumulation of ALA in blood and urine, urinary ALA has also been used as a biomarker of Pb exposure or a marker of early biologic Pb effect. ALA can have neurotoxic activity and may contribute to Pb-induced neurotoxicity. Blood Pb level indicates recent exposure, whereas bone Pb