Predictive Factors for Pregnancy Hypertension in Primiparous
Adolescents: Analysis of Prenatal Care, ABPM and Microalbuminuria
Regina Coeli Marques de Carvalho, Henry de Holanda Campos, Zenilda Vieira Bruno,Rosa Maria Salani Mota
Maternidade Escola Assis Chateaubriand e Centro Integrado de Hipertensão e Diabetes - Fortaleza, CE - Brazilobjective: To quantify PH prevalence in primiparous adolescents; define predictive factors for the occurrence of PH and its impact on newborns.
Methods: We followed 29 primiparous adolescents from the prenatal period through the 12th week of the puerperium, with a mean of sixteen years of age, served at the Outpatient Facility for Adolescents of Maternidade Escola Assis Chateaubriand (MEAC) of Universidade Federal do Ceará (Fortaleza, Brazil). The pregnant adolescents were divided into two groups, that is, those who remained normotensive (Group I) and those who developed PH (Group II). The variables investigated in the assessment of the value of predictability for the development of PH were anthropometric measures, socioeconomic aspects, smoking habit, inheritance for SAH (father/mother), prenatal tests requested in the first prenatal care visit in addition to mi-croalbuminuria and ambulatory blood pressure monitoring (ABPM) in the 28th week of gestation. The pregnant adolescents were followed up at delivery and late puerperium (12th week after the puerperium). The newborns to the mothers included in our study were assessed at birth according to the Apgar score and the Capurro method, for weight, height and perinatal hypoxia.
results: The prevalence of PH was 51.7%. Inheritance for SAH presented the highest predictive value for PH with an odds ratio of 10.99. Diastolic arterial pressure equal to or above 70 mmHg at the gestational age of 35 weeks was sta-tistically significant as a predictive value for PH. At ABPM we found a predictive value for PH: diastolic pressure load during alertness, diastolic and systolic pressure load during night sleep, pressure variability and maximum diastolic pres-sure during sleep. Specifically a maximum diastolic arterial prespres-sure (DAP) at ABPM during the period of night sleep ³64 mmHg presented an odds ratio of 6 for PH with a sensitivity of 80% and a specificity of 60% for the development of PH.
conclusion: The research for PH predictive factors in primiparous adolescents showed to be easy to apply and useful to stratify high-risk pregnant women as regards the development of PH.
Key words: Gestational hypertensive, microalbuminuria, ambulatory blood pressure monitoring (ABPM), pregnancy in ado-lescents.
correspondência: regina coeli Marques de carvalho •
Rua Dr. Ribamar Lobo, 430/403 - 60176-140 – Fortaleza, CE - Brazil
Gestational hypertensive diseases continue to be the major causes of maternal/fetal mortality in developing countries and account for 60% of direct maternal obstetrics-related deaths1.
The specific group of primiparous adolescents is the age group that more strongly correlates with worse maternal/fetal prognosis in large population surveys, and presents high rates of premature delivery, newborns who are small for the gestational age (SGA)2-4 and with a maternal death risk approximately sixty times higher as compared to women in the 20 to 24 age range5-8.
Pregnancy hypertension, defined as the presence of transitory arterial hypertension during pregnancy, with no proteinuria, and with normalized arterial pressure after the 12th week of pregnancy, has been more strongly correlated with recurrence in future pregnancies and with a higher risk for the development of cardiovascular diseases9-10.
In the last years, ambulatory blood pressure monitoring (ABPM) has become a very useful noninvasive method in clinical obstetrics for hypertensive or normotensive pregnant
women with a risk factor for developing pregnancy-induced hypertensive disease11.
Microalbuminuria is considered an independent marker of lesions in target organs of hypertensive12 and diabetic13-14 patients. There is no consensus about its predictive value for pregnancy-induced hypertensive disease15-18 in pregnant women, and studies are needed to validate its use in pregnancy with a high risk for the development of pregnancy-induced hypertensive disease.
Methods
the study. They were separated into two different groups: Group I, those who remained normotensive, and Group II, which comprised those who had a PH diagnosis. All the variables investigated were correlated with the PH diagnosis and assessed as regards their predictive power for PH. The variables investigated as regards PH predictability were: weight (kg), height (m), body mass index (kg/m2), socioeconomic aspects (schooling, marital status, type of dwelling, smoking habit); inheritance for SAH; laboratory tests (hematocrit, hemoglobin, urine analysis, fasting glycemia) requested in the first prenatal care visit; pressure measurements taken in the first and last prenatal visit; microalbuminuria and ABPM in the 28th week of pregnancy. The adolescents were followed up during delivery (vaginal, cesarean section, forceps) and were later visited at home after the 12nd week of puerperium. The newborns were assessed as regardstheir conditions of birth (perinatal anoxia, APGAR at the first and fifth minutes, Capurro), weight (gr), height (cm) and whether they were AGA (adequate for gestational age), LGA (large for gestational age), SGA (small for gestational age) and the data were correlated with the data of the mothers’ diagnosis of PH. The study was approved by the Research Ethics Committee of the Medical College of the Federal University of Ceará, Brazil (Universidade Federal do Ceará).
In the ABPM, we used DYNAMAP monitors (device for indirect noninvasive automatic mean arterial pressure). Pressure level readings were done using the oscillometric method according to the protocol of the British Hypertension Society19 and to the criteria established by the American Association of Medical Instrumentation20 and by the 3rd ABPM Guidelines of the Brazilian Society of Hypertension21. The ABPM monitor was adjusted to the patient’s waist, on the opposite side of the arm where the blood pressure was measured. The periods of alertness and night sleep of the ABPM were defined and programmed so that the pressure could be measured every twenty minutes during alertness and every thirty minutes during night sleep. ABPM was accepted as valid for analysis if a minimum of fourteen measurements had been taken during alertness and seven measurements had been taken during night sleep21. The following ABPM variables were assessed with a predictive value for PH:
- Mean arterial pressure (mmHg) – (MAP);
- Mean SAP (systolic arterial pressure) and mean DAP (diastolic arterial pressure) (mmHg) during alertness and sleep;
- Maximum SAP or DAP value recorded during alertness and sleep (mmHg);
- Systolic and Diastolic pressure variability (standard deviation);
- Maximum systolic and diastolic variation (mmHg) – maximum AP variation as compared with the normal pattern during alertness (SAP of 140 mmHg and DAP of 90 mmHg) and sleep (SAP of 120 mmHg and DAP of 80 mmHg during
sleep);
- Systolic pressure load (% of SAP measurements above 140 mmHg) and diastolic (% of DAP measurement above 90 mmHg) during alertness;
- Systolic pressure load (%of SAP measurements above 120 mmHg) and diastolic (% of DAP measurements above 80 mmHg) during night sleep;
- Nocturnal descent – percentage of pressure level reduction during sleep as compared with the alertness period (a fall of pressure levels by or above 10% as compared with pressure levels during alertness).
The data were collected in individual records and stored in an Access 7.0 database. They were analyzed in the Excel and SPSS 7.5 for Windows (Microsoft Corporation) programs. Student’s t test and Mann-Whitney nonparametric tests were used to compare the means of continuous variables between Groups I and II. Categoric variables were analyzed using Fisher’s exact test and the likelihood ratio test, in that a value of p < 0.01 was defined as statistically significant. For the multivariate analysis of risk factors for the development of PH we used logistic regression analysis. Wald’s test was used to assess the significance of the odds ratio (OR) adjusted by logistic regression, with a confidence interval of 95% (CI 95%); the Hopkins scale was used for the OR.
Results
The adolescents’ age ranged from fourteen to eighteen years, and 58.6% were under sixteen. The average gestational age at the first and last prenatal care visits was 13.5 weeks and 35 weeks respectively. Delivery occurred at the mean gestational age of 38 weeks.
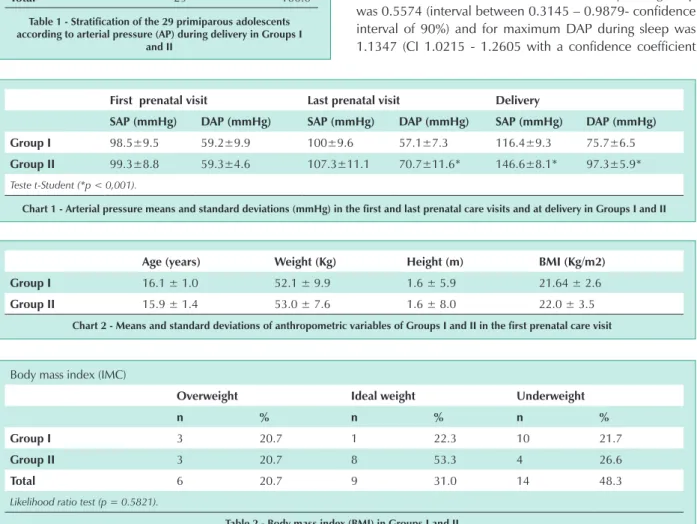
Fourteen adolescents (48.3%) remained normotensive (Group I) and fifteen (51.72%) presented PH (Group II) with a mean arterial pressure (AP) of 146.6/ 97.3 mmHg at delivery (Tab. 1) (Chart 1).
DAP in the last prenatal care visit of patients in Group II presented significant statistical difference as compared with Group I (p < 0.001) (chart 1).
Fourteen patients (48.3%) were underweight in the beginning of pregnancy; nine (31.0%) were within ideal weight limits; and six (20.7%) were overweight (Chart 2) (tab.2). There was no statistically significant difference as regards body weight gain during pregnancy when the two Groups were compared (11.4 ± 3.7 kg in Group I and 12.2 ± 3.5 kg in Group II).
analyzed and the occurrence of PH.
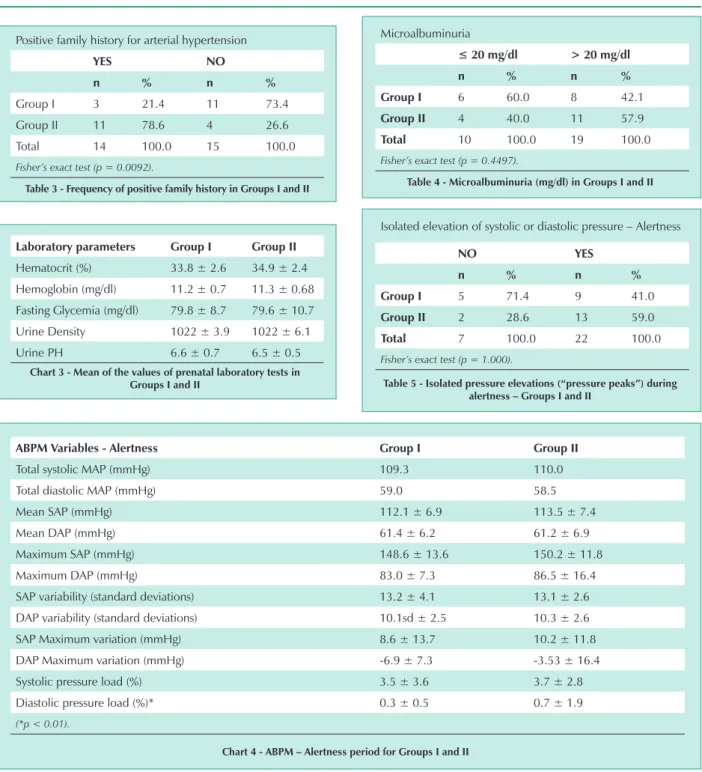
Fourteen adolescents had a family history for SAH and eleven (78.6%) developed PH (p = 0.0092) (Tab. 3). A positive family history for SAH represented a risk (odds ratio) of 10.99 for PH (confidence interval: 1.99-60.57; significance level: 95%).
Laboratory tests requested in the first prenatal visit showed no predictive value for the development of PH (chart 3).
Microalbuminuria with values above normal (> 20 mg/dl) was found in nineteen individuals, of which eleven (57.9%) developed PH (Group II) (Tab. 4).
ABPM measurements were of good technical quality, with the mean of valid measurements being 83.15% for Group I and 85.33% for Group II.
During alertness, there were statistically significant differences between the two Groups as regards diastolic
pressure load (p < 0.01) (chart 4). Isolated systolic and diastolic pressure “peaks” in the ABPM period were recorded in the two groups studied, although there was greater predominance of this change in Group II, where 59.0 % of the patients presented this alteration on ABPM (Tab. 5). Fisher’s exact test showed no association between this event and PH development.
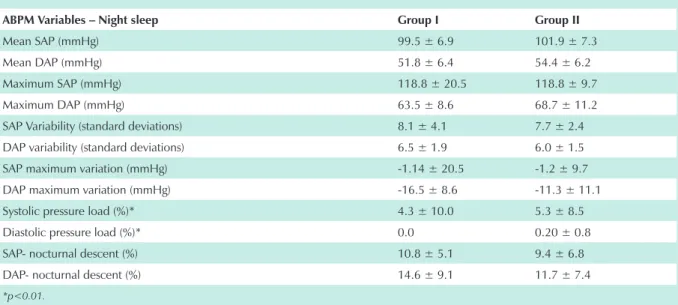
During night sleep systolic and diastolic pressure loads presented statistically significant differences between the two Groups (p < 0.01) (chart 5). In Group II, 60.9% of the patients presented greater pressure instability represented by the presence of isolated “pressure peaks” (Tab. 6). Fisher’s exact test showed no correlation between the occurrence of hypertensive “peaks” and the development of PH (Tab. 7).
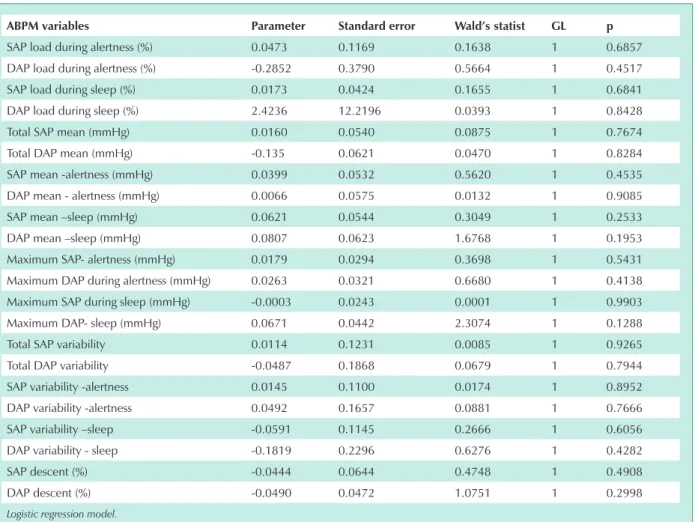
According to the Backward Stepwise model for analysis of multiple linear regression coefficients with a significance level of 45% we can find the predictive value for PH, the mean SAP and DAP during night sleep, maximum DAP during alertness and sleep, DAP pressure variability during sleep and DAP descent during sleep (chart 6). Considering the multivariate analysis with a significance level of 10% among these variables we find the predictability value for PH, diastolic pressure variability and maximum diastolic pressure in the period of night sleep (chart 7).
The odds ratio estimated for DAP variability during sleep was 0.5574 (interval between 0.3145 – 0.9879- confidence interval of 90%) and for maximum DAP during sleep was 1.1347 (CI 1.0215 - 1.2605 with a confidence coefficient
First prenatal visit last prenatal visit Delivery
sAP (mmhg) DAP (mmhg) sAP (mmhg) DAP (mmhg) sAP (mmhg) DAP (mmhg)
group i 98.5±9.5 59.2±9.9 100±9.6 57.1±7.3 116.4±9.3 75.7±6.5
group ii 99.3±8.8 59.3±4.6 107.3±11.1 70.7±11.6* 146.6±8.1* 97.3±5.9*
Teste t-Student (*p < 0,001).
chart 1 - Arterial pressure means and standard deviations (mmhg) in the first and last prenatal care visits and at delivery in groups i and ii
AP at delivey n. of adolescents %
normal arterial pressure
(group i) 14 48.3
Pregnancy hypertension
(group ii) 15 51.7
total 29 100.0
table 1 - stratification of the 29 primiparous adolescents according to arterial pressure (AP) during delivery in groups i
and ii
Age (years) Weight (Kg) height (m) bMi (Kg/m2)
group i 16.1 ± 1.0 52.1 ± 9.9 1.6 ± 5.9 21.64 ± 2.6
group ii 15.9 ± 1.4 53.0 ± 7.6 1.6 ± 8.0 22.0 ± 3.5
chart 2 - Means and standard deviations of anthropometric variables of groups i and ii in the first prenatal care visit
Body mass index (IMC)
overweight ideal weight underweight
n % n % n %
group i 3 20.7 1 22.3 10 21.7
group ii 3 20.7 8 53.3 4 26.6
total 6 20.7 9 31.0 14 48.3
Likelihood ratio test (p = 0.5821).
of 90%). We can assume that the increase in DAP variability during night sleep provides a certain protective effect as to the development of PH, whereas increased maximum DAP during sleep would represent a greater risk factor for the development of PH.
By assessing the maximum DAP during sleep in an isolated
fashion we verified that at the cut-off point of DAP ≥ 64
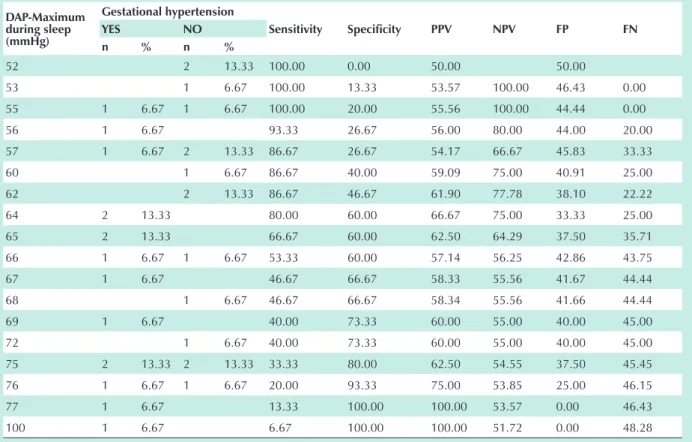
mmHg we observe a dichotomy between the two Groups studied, with a greater association with the development of PH with a sixfold odds ratio (variation of coefficient between 1.172 and 30.72, confidence interval of 95%) (Tab. 8). The
sensitivity for this pressure value was 80% and the specificity was 60%, with a positive predictive value (PPV) of 66.7, negative predictive value (NPV) de 75.0, false positive (FP) of 33.33 and false negative (FN) of 25 (chart 8).
Maximum pressure variability during sleep, in turn, did not present any specific cut-off point with a predictive value for PH.
Twenty two patients had vaginal delivery, one had forceps delivery and four had cesarean sections due to obstetric reasons. Perinatal anoxia occurred in twelve newborns, two of which belonged to Group II (66.7%), but with no statistically
Positive family history for arterial hypertension
yes no
n % n %
Group I 3 21.4 11 73.4
Group II 11 78.6 4 26.6
Total 14 100.0 15 100.0
Fisher’s exact test (p = 0.0092).
table 3 - Frequency of positive family history in groups i and ii
laboratory parameters group i group ii
Hematocrit (%) 33.8 ± 2.6 34.9 ± 2.4
Hemoglobin (mg/dl) 11.2 ± 0.7 11.3 ± 0.68
Fasting Glycemia (mg/dl) 79.8 ± 8.7 79.6 ± 10.7
Urine Density 1022 ± 3.9 1022 ± 6.1
Urine PH 6.6 ± 0.7 6.5 ± 0.5
chart 3 - Mean of the values of prenatal laboratory tests in groups i and ii
Microalbuminuria
≤ 20 mg/dl > 20 mg/dl
n % n %
group i 6 60.0 8 42.1
group ii 4 40.0 11 57.9
total 10 100.0 19 100.0
Fisher’s exact test (p = 0.4497).
table 4 - Microalbuminuria (mg/dl) in groups i and ii
AbPM variables - Alertness group i group ii
Total systolic MAP (mmHg) 109.3 110.0
Total diastolic MAP (mmHg) 59.0 58.5
Mean SAP (mmHg) 112.1 ± 6.9 113.5 ± 7.4
Mean DAP (mmHg) 61.4 ± 6.2 61.2 ± 6.9
Maximum SAP (mmHg) 148.6 ± 13.6 150.2 ± 11.8
Maximum DAP (mmHg) 83.0 ± 7.3 86.5 ± 16.4
SAP variability (standard deviations) 13.2 ± 4.1 13.1 ± 2.6
DAP variability (standard deviations) 10.1sd ± 2.5 10.3 ± 2.6
SAP Maximum variation (mmHg) 8.6 ± 13.7 10.2 ± 11.8
DAP Maximum variation (mmHg) -6.9 ± 7.3 -3.53 ± 16.4
Systolic pressure load (%) 3.5 ± 3.6 3.7 ± 2.8
Diastolic pressure load (%)* 0.3 ± 0.5 0.7 ± 1.9
(*p < 0.01).
chart 4 - AbPM – Alertness period for groups i and ii
Isolated elevation of systolic or diastolic pressure – Alertness
no yes
n % n %
group i 5 71.4 9 41.0
group ii 2 28.6 13 59.0
total 7 100.0 22 100.0
Fisher’s exact test (p = 1.000).
significant differences between the two Groups (Tab. 9). No statistically significant differences were found between the two Groups studied as regards the other variables analyzed in the newborns (Chart 9) (Tab. 10).
Discussion
The data found in our study confirm that in the specific group of primiparous adolescents there is a high risk for PH, with an occurrence of 51.7%.
The development of systemic arterial hypertension in
women who have developed gestational hypertension is described in many studies in the literature22-25. Chesley & Sibai demonstrated that pregnant women with mean arterial pressure (MAP) in the second quarter of pregnancy equal to or above 90 mmHg presented a higher incidence of development of chronic arterial hypertension evidenced during years of clinical follow up25. Therefore, clinical follow-up of these adolescents in the subsequent years will provide information for the early diagnosis of arterial hypertension and for the adoption of nonpharmacological preventive measures for HAS, as well as for the adoption of early appropriate therapy where necessary, thus avoiding co-morbidities associated with the natural progression of arterial hypertension, such as chronic renal failure, left ventricle hypertrophy and heart failure
According to the 3rd Brazilian Consensus of Arterial Hypertension, for individuals under eighteen and considered normal, pressure values range from SAP < 130 mmHg and DAP < 85 mmHg26. Considering that the average height of the adolescents in our study was 161 cm (percentile 50), all of them presented normal mean pressure levels in the first and last prenatal care visits alike.
When the two Groups studied were compared we found a statistically significant difference for DAP measured with the manual sphygmomanometer in Group II. Since absolute pressure levels are considered within normal patterns, they do not have clinical significance in the prenatal period.
Heredity of SAH had a significant predictive value for PH, with an odds ratio of 10.99 times. Sukerman-Voldman et al27 found a correlation between SAH and PE. If this data is emphasized in the prenatal period we will be able to stratify, in this specific Group of pregnant women, those who are at a greater risk for developing PH, or maybe other gestational hypertensive diseases such as preeclampsia or eclampsia.
AbPM variables – night sleep group i group ii
Mean SAP (mmHg) 99.5 ± 6.9 101.9 ± 7.3
Mean DAP (mmHg) 51.8 ± 6.4 54.4 ± 6.2
Maximum SAP (mmHg) 118.8 ± 20.5 118.8 ± 9.7
Maximum DAP (mmHg) 63.5 ± 8.6 68.7 ± 11.2
SAP Variability (standard deviations) 8.1 ± 4.1 7.7 ± 2.4
DAP variability (standard deviations) 6.5 ± 1.9 6.0 ± 1.5
SAP maximum variation (mmHg) -1.14 ± 20.5 -1.2 ± 9.7
DAP maximum variation (mmHg) -16.5 ± 8.6 -11.3 ± 11.1
Systolic pressure load (%)* 4.3 ± 10.0 5.3 ± 8.5
Diastolic pressure load (%)* 0.0 0.20 ± 0.8
SAP- nocturnal descent (%) 10.8 ± 5.1 9.4 ± 6.8
DAP- nocturnal descent (%) 14.6 ± 9.1 11.7 ± 7.4
*p<0.01.
chart 5 - AbPM – night sleep period – groups i and ii
Isolated elevation of systolic or diastolic pressure - Night sleep
yes no
n % n %
Group I 9 39.1 5 85.8
Group II 14 60.9 1 14.2
Total 23 100.0 6 100.0
Fisher’s exact test (p = 0.054).
table 6 - isolated pressure elevations (“pressure peaks”) during the night sleep period – groups i and ii
Changes of AP in the night sleep period
yes no
n % n %
Group I 1 25.0 13 52.0
Group II 3 75.0 12 48.0
Total 4 100.0 25 100.0
Fisher’s exact test (p = 0.5977).
There was no correlation between anthropometric variables or the social aspects investigated and PH. Up to the study’s
follow-up, pregnancy did not show to have a negative impact on the life of these adolescents. Most of the adolescents in the study, i.e. 89.7% remained in school, and only seven (24.2%) moved in with their partners to their own homes, while most of them, 75.8% continued to live with their parents or with the parents of their partners.
Routine prenatal laboratory tests and microalbuminuria in the 28th gestational week did not show to have any predictive value for PH. Maybe the fact that only one sample for laboratory tests was collected in the beginning of pregnancy contributed to the results found.
ABPM in the 28th gestational week demonstrated to be
AbPM variables Parameter standard error Wald’s statist gl p
SAP load during alertness (%) 0.0473 0.1169 0.1638 1 0.6857
DAP load during alertness (%) -0.2852 0.3790 0.5664 1 0.4517
SAP load during sleep (%) 0.0173 0.0424 0.1655 1 0.6841
DAP load during sleep (%) 2.4236 12.2196 0.0393 1 0.8428
Total SAP mean (mmHg) 0.0160 0.0540 0.0875 1 0.7674
Total DAP mean (mmHg) -0.135 0.0621 0.0470 1 0.8284
SAP mean -alertness (mmHg) 0.0399 0.0532 0.5620 1 0.4535
DAP mean - alertness (mmHg) 0.0066 0.0575 0.0132 1 0.9085
SAP mean –sleep (mmHg) 0.0621 0.0544 0.3049 1 0.2533
DAP mean –sleep (mmHg) 0.0807 0.0623 1.6768 1 0.1953
Maximum SAP- alertness (mmHg) 0.0179 0.0294 0.3698 1 0.5431
Maximum DAP during alertness (mmHg) 0.0263 0.0321 0.6680 1 0.4138
Maximum SAP during sleep (mmHg) -0.0003 0.0243 0.0001 1 0.9903
Maximum DAP- sleep (mmHg) 0.0671 0.0442 2.3074 1 0.1288
Total SAP variability 0.0114 0.1231 0.0085 1 0.9265
Total DAP variability -0.0487 0.1868 0.0679 1 0.7944
SAP variability -alertness 0.0145 0.1100 0.0174 1 0.8952
DAP variability -alertness 0.0492 0.1657 0.0881 1 0.7666
SAP variability –sleep -0.0591 0.1145 0.2666 1 0.6056
DAP variability - sleep -0.1819 0.2296 0.6276 1 0.4282
SAP descent (%) -0.0444 0.0644 0.4748 1 0.4908
DAP descent (%) -0.0490 0.0472 1.0751 1 0.2998
Logistic regression model.
chart 6 - Analysis of the simple linear regression coefficients of the AbPM variables for Ph
AbPM variables Parameter standard error Wald’s statist gl p
DAP variability - sleep -0.5845 0.3479 2.8221 1 0.0930
DAP-Maximum during sleep 0.1264 0.0639 3.9143 1 0.0479
Constant -4.6193 3.2184 2.0600 1 0.1512
Logistic regression model.
chart 7 - Analysis of the multiple linear regression coefficients of the AbPM variables (backward stepwise model) for the development of pregnancy hypertension
DAP – Maximum during sleep
< 64 mmhg ≥ 64 mmHg
n % n %
group i 9 75,0 6 33.3
group ii 3 25.0 12 66.7
total 12 100.0 18 100.0
Fisher’s exact test (p = 0.030).
the only test that had a predictive value for PH. Brown et al28 found maximum pressure values of 133/81 mmHg during alertness, and 117/68 mmHg during sleep for normotensive pregnant women between the 26th and 30th gestational week28. The adolescents in our study who developed PH (Group II) presented maximum pressure values of 150.2 ± 11.8/ 86.5 ± 16.4 mmHg during alertness, and of 118.8 ± 9.7/ 68.7 ± 11.2 mmHg during the night sleep period, which are therefore above the values deemed normal, specifically in this gestational age. The presence of isolated “pressure peaks” during alertness and night sleep of the pregnant women in Group II evidences that, in fact, there is greater pressure variability and an instability of the circadian rhythm of pressure in those women who come to develop PH.
The diastolic pressure load during alertness in Group II
presented statistically significant differences (p < 0.01) with regard to pregnant women in Group I. Diastolic pressure load values during alertness are absolutely normal if we consider the values of the population in general. The population we studied, in turn, is made up of pregnant adolescents in the second half of pregnancy and, because they are in a state of intense systemic vasodilation, we should actually find pressure values which are lower than those of the population in general; therefore, this variable showed to have a predictability value for PH.
Changes in pressure behavior during ABPM during night sleep in pregnant women with PE are very controversial. The presence of diminished nocturnal descent and the inversion of the alertness-sleep pattern, i.e., the fact that pressure levels are higher during sleep than during alertness are among the most significant findings included in the literature29-34. Halligan et al34 correlate nocturnal descent with the degree of PE severity. In our casuistics, we did not find statistically significant differences as regards nocturnal descent between the two Groups studied, but we observed, through the odds ratio estimated, that the higher the value of maximum DAP during sleep, the higher the risk for PH. Of the pregnant
women who presented maximum DAP during sleep ≥ 64
mmHg, 66.7% progressed to PH (odds ratio of 6.0 times for PH). Hermida et al35 observed that the pregnant women who developed PE or PH had ABPM alterations which became
DAP-Maximum during sleep (mmhg)
gestational hypertension
sensitivity specificity PPv nPv FP Fn
yes no
n % n %
52 2 13.33 100.00 0.00 50.00 50.00
53 1 6.67 100.00 13.33 53.57 100.00 46.43 0.00
55 1 6.67 1 6.67 100.00 20.00 55.56 100.00 44.44 0.00
56 1 6.67 93.33 26.67 56.00 80.00 44.00 20.00
57 1 6.67 2 13.33 86.67 26.67 54.17 66.67 45.83 33.33
60 1 6.67 86.67 40.00 59.09 75.00 40.91 25.00
62 2 13.33 86.67 46.67 61.90 77.78 38.10 22.22
64 2 13.33 80.00 60.00 66.67 75.00 33.33 25.00
65 2 13.33 66.67 60.00 62.50 64.29 37.50 35.71
66 1 6.67 1 6.67 53.33 60.00 57.14 56.25 42.86 43.75
67 1 6.67 46.67 66.67 58.33 55.56 41.67 44.44
68 1 6.67 46.67 66.67 58.34 55.56 41.66 44.44
69 1 6.67 40.00 73.33 60.00 55.00 40.00 45.00
72 1 6.67 40.00 73.33 60.00 55.00 40.00 45.00
75 2 13.33 2 13.33 33.33 80.00 62.50 54.55 37.50 45.45
76 1 6.67 1 6.67 20.00 93.33 75.00 53.85 25.00 46.15
77 1 6.67 13.33 100.00 100.00 53.57 0.00 46.43
100 1 6.67 6.67 100.00 100.00 51.72 0.00 48.28
chart 8 - DAP–Maximum during sleep ≥ 64 mmhg – sensitivity, specificity, positive predictive value (PPv), negative predictive value (nPv), false positives (FP), false negatives (Fn) and predictability of Ph
Newborns – Presence of perinatal anoxia
yes no
n % n %
group i 4 33.3 10 58.9
group ii 8 66.7 7 41.1
total 12 100.0 17 100.0
Fisher’s exact test (p = 0.2635).
References
1. Organización Mundial de la Salud. Necessidades de salud de los adolescentes. Informe de um Comitê de Expertos de la OMS. Genebra, 1977. (Série de Informes Técnicos, 609).
2. Risk approach for maternal and child health care. Geneva, 1978. (WHO Offset Publication, 39).
3. Organização Mundial de Saúde (OMS). Committee Report on Hypertension Control. Clin Exper Hypertension 1996; 18: 371-85.
4. National and State-specific pregnancy rates among adolescents-United States, 1995-1997. MMWR Morb Mortal Wkly Rep 2000; 49: 606-11.
5. American College of Obstetricians and Gynecologists apud Sibai BM, Ewell M, Levine RJ, et al. Risk factors associated with preeclampsia in healthy nulliparous women. Am J Obstet Gynecol 1997; 177: 1003-10.
6. Aliaga E, Suazo EW, Díaz JI, et al. Experiencia en una unidad de gestantes precoces. Rev Chil Obstet Ginecol 1985; 50: 127-39.
7. Souza MMC. A maternidade nas mulheres de 15 a 19 anos: um retrato da realidade. Mundo da Saúde 1999; 23: 93-105.
8. Gravidez na adolescência. Disponível em: http://brazilpednews. org. br/set2001/bnpar101.htm. Acesso em: 14 fev. 2002.
9. Report National High Blood Pressure Education Program Working Group on High Blood Pressure in Pregnancy. apud Bethesda(MD): Dept. of Health and Human Services(US) National Institutes of Health, National Heart, Lung, and Blood Institute; 2000 Jul. NIH Publication No: 00-3029.
10. Seely EW. Hypertension in pregnancy: a potencial window into long-term cardiovascular risk in women. J Clin Endocrin Metab 1999; 84: 1858-61.
11. Penny JA, Halligan AWF, Shennan AH, et al. Automated, ambulatory, or conventional blood pressure measurement in pregnancy: Which is the better predictor of severe hypertension? Am J Obstet Gynecol 1998; 178: 521-26.
12. Grossling P, Beevers PG. Urinary albumin excretion blood pressure in the general population. Clin Sci 1989; 76: 39-42.
13. Mogensen CE. Microalbuminuria as a predictor of clinical diabetic nephropathy. Kidney Int 1987; 31: 673-89.
14. Viberti GC, Hill RD, Jarrett RJ, et al. Microalbuminuria as a predictor of clinical nephropathy in insulin-dependent diabetes mellitus. Lancet 1982; 1: 1430-32.
15. Misiani R, Marchesi D, Tiraboschi G, et al. Urinary albumin excretion in normal pregnancy and pregnancy induced hypertension. Nephron 1991; 59: 416-22.
16. Konstantin-Hansen KF, Hesseldahl H, Pedersen, SM. Microalbuminuria as a predictor of preeclampsia. Acta Obstet Gynecol Scand 1992; 71: 342-46.
17. Higby K, Suiter CR, Phelps JY, et al. Normal values of urinary albumin and total protein excretion during pregnancy. Am J Obstet Gynecol 1994; 171: 984-89.
18. Bar J, Hod M, Erman A, et al. Microalbuminuria as an early predictor of hypertensive complications in pregnancy women at high risk. Am J Kidney Dis 1996; 28: 220-25.
19. O’Brien E, Petrie J, Littler W, et al. The British Hypertension Society protocol for the evaluation of automated and semi-automated blood pressure measuring devices with special reference to ambulatory systems. J Hypertens 1993; (suppl. 2): 542-62.
20. Association for the Advanced of Medical Instrumentation. American National Standard for Eletronic or Automated Sphygmomanometers. Washington DC: AAMI... apud Halligan A, Shennan A, Thurston H, et al. Ambulatory blood pressure measurement in pregnancy: The current state of the art. Hypertens Pregnancy 1995; 14: 1-16.
manifest since the first quarter of pregnancy with greater pressure variability and an increase in pressure levels in the last quarter of pregnancy.
As regards the newborns, we did not find any factor that could be correlated with PH, although there were more cases of perinatal anoxia (66.7%) among Group II newborns.
The number of cases studied limits the results found, but may show us that hypertensive gestational diseases, specifically PH, in primiparous adolescents, are prevalent
in our population. The investigation of predictive factors for PH may modify the natural progression of hypertensive gestational diseases.
Conclusion
The study to investigate predictive factors for PH in the specific Group of primiparous adolescents showed to be easy to apply and yielded satisfactory results. Heredity of SAH and ABPM in the 28th gestational week were shown to have the highest predictive values for PH. Maximum DAP during sleep and pressure variability during night sleep, as well as the diastolic pressure load during alertness in ABPM had significant predictive values for PH. Maximum DAP during
night sleep ≥ 64 mmHg presented a sensitivity of 80%,
specificity of 60% with PPV of 66.67 and NPV of 75 for the development of PH.
Potential Conflict of Interest
No potential conflict of interest relevant to this article was reported.
Variables of newborns
Apgar 1st min. Apgar 5th min. capurro (weeks) Weight (gr) height (cm)
group i 7.7 ± 1.6 9.0 39.4 ± 1.5 3.117 ± 418 50.0 ± 1.7
group ii 7.1 ± 1.4 8.6 ± 1.3 38.4 ± 1.5 3.282 ± 568 49.6 ± 3.3
chart 9 – one and five-minute Apgar scores, capurro method, weight and height of newborns born to the 29 primiparous adolescents in groups i and ii
Classifications of newborns
sgA AgA lgA
n % n % n %
group i 2 66.6 12 50.0
group ii 1 33.4 12 50.0 2 100.0
total 3 100.0 24 100.0 2 100.0
21. Sociedade Brasileira de Hipertensão IV. Diretrizes para uso da Monitorização Ambulatorial da Pressão Arterial. Arq Bras Cardiol v 85;suplememto II , julho 2005.
22. Dekker GA, De Vries JI, Doelitzsch PM, et al. Underlying disorders associated with severe early-onset preeclampsia. Am J Obstet Gynecol 1995; 173: 1042-48.
23. Sibai B M, EL-Nazer A, Gonzalez-Ruiz A. Severe preeclampsia in young primigravid women: subsequent pregnancy outcome and remote prognosis. Am J Obstet Gynecol 1986; 155: 1011-16.
24. Nissel H, Lintu H, Lunell NO, et al. Blood pressure and renal function seven years after pregnancy complicated by hypertension. Br J Obstet Gynaecol 1995; 102: 876-81.
25. Chesley LC, Sibai BM. Clinical significance of elevated mean arterial pressure in the second trimester. Am J Obstet Gynecol 1988; 159: 275-9.
26. Sociedade Brasileira de Hipertensão; Sociedade Brasileira de Cardiologia; Sociedade Brasileira de Nefrologia. III Consenso Brasileiro de Hipertensão Arterial. São Paulo, 1998.
27. Sukerman-Voldman E, Aragonés A, Becerra F, et al. Perfil epidemiológico para la hipertención durante el embarazo. Rev Obstet Ginecol Venezuela 1998; 58: 5-11.
28. Brown MA, Bowyer L, Mchugh L, et al. Twenty-four automated blood pressure monitoring as a predictor preeclampsia . Am J Obstet Gynecol 2001; 185: 618-22.
29. Seligman SA. Diurnal blood pressure variation in pregnancy. J Obstet Gynaecol Br Commonw 1971; 78: 417-22.
30. Redman CWG, Beilin LJ, Bonnar J. Reversed diurnal blood pressure rhythm un hypertensive pregnancies. Clin Sci Mol Med 1976; 51: 687-89.
31. Murnaghan GA. Hypertension in pregnancy. Postgrad Med J 1976; 52 (suppl. 7): 123-6.
32. Halligan A, Shennan A, Lambert PC, et al. Diurnal blood pressure difference in the assessment of pre-eclampsia. Obstet Gynecol 1996; 87: 205-8.
33. Hermida RC, Ayala DE. Diagnosing gestacional hypertension and preeclampsia with 24-hour mean of blood pressure. Hypertension 1997; 30: 1531-37.
34. Sawyer MM, Lipshiitz J, Anderson GD, et al. Diurnal and short-term variation of blood pressure: comparison of pre-eclamptic, chronic hypertensive and normotensive patients. Obstet Gynecol 1981; 58: 291-6.