Prevalence and factors
associated to malnutrition and
excess weight among under ive
year-olds in the six largest cities
of Maranhão
Prevalência e fatores associados à
desnutrição e ao excesso de peso
em menores de cinco anos nos seis
maiores municípios do Maranhão
Deysianne Costa das Chagas
Antônio Augusto Moura da Silva
Rosangela Fernandes Lucena Batista
Vanda Maria Ferreira Simões
Zeni Carvalho Lamy
Liberata Campos Coimbra
Maria Teresa Seabra Soares de Britto e Alves
Program in Collective Health of the Universidade Federal do Maranhão - UFMA
Funding sources: Coordenação de Aperfeiçoamento de Pessoal de Nível Superior (CAPES – Coordi-nation for the Improvement of Higher Education Personnel) for the Master’s degree scholarship granted to Deysianne Costa das Chagas (Code number 20001010015M4) and State of Maranhão Department of Health/Fundação de Amparo à Pesquisa do Maranhão (FAPEMA – State of Maranhão Research Support Foundation) for the inancial support (Process number 0192.00/04).
Corresponding author: Deysianne Costa das Chagas. Rua Santo Adalberto, 04 – Residencial Gra-nada, Bairro Forquilha, São Luis, MA, BRAZIL, 65054-115. Email: [email protected]
Abstract
Prevalences of malnutrition and overweight among children under five years and its as-sociation with socioeconomic, demographic and health indicators were estimated for the six largest municipalities of Maranhão, in 2006/2007. By means of a household survey, a sample of 1214 children under five years of age was randomly selected. Two-stage cluster sampling was used, representing the six municipalities of Maranhão with over one hundred thousand inhabitants. Standardized questionnaire was adminis-tered to mothers or guardians and trained personnel measured weight and height or length. For classification of malnutrition cutoff points of <-2z scores for weight-for--age, weight-for-length/height and length/ height-for-age were used. Overweight was considered when weight for heithg was > +2 z score, following World Health Organization guidelines. By weight-for-age malnutrition prevalence was 4.5, by length/height-for--age 8.5% were stunted and by the weight--for-length/height 3.9% were malnourished (wasting), while 6.7% were overweight. Children of families headed by women had lower prevalence of malnutrition (preva-lence ratio=0.4). Socioeconomic variables were not associated with malnutrition or overweight. Participation in money transfer programs from the government was not associated with malnutrition or overweight. The prevalence of malnutrition was low, but being overweight was more prevalent than malnutrition. Social inequality was not detected in relation to malnutrition in children under five years of age, suggesting a favorable trend towards greater equity.
Resumo
Prevalências de desnutrição e excesso de peso em menores de cinco anos e sua associação com fatores socioeconômicos, sanitários e demográficos foram estimadas nos seis maiores municípios do Maranhão, em 2006/2007. Por meio de inquérito do-miciliar por amostragem 1.214 crianças menores de cinco anos foram aleatoriamente selecionadas. Foi utilizada amostragem por conglomerados em dois estágios, represen-tativa dos seis municípios maranhenses com mais de cem mil habitantes. Foram aplicados questionários padronizados para as mães ou responsáveis pelas crianças e aferidos peso e estatura. Para classificação da desnutrição foram utilizados os pontos de corte < –2 escores z pelos indicadores peso para idade, peso para estatura e estatura para idade. Para a classificação do excesso de peso foram considerados > +2 escores z, de acordo com o indicador peso para estatura, seguindo recomendações da Organização Mundial da Saúde. Pelo índice peso para idade a prevalência de desnutrição foi de 4,5%, pelo índice estatura para idade 8,5% estavam com desnutrição pregressa e pelo índice peso para estatura 3,9% encontravam-se com desnutrição atual, enquanto 6,7% apresen-tavam excesso de peso. Crianças de famílias chefiadas por mulheres apresentaram me-nores prevalências de desnutrição (Razão de Prevalências = 0,4). Variáveis socioeco-nômicas não estiveram associadas à desnu-trição ou ao excesso de peso. Recebimento de benefício do programa bolsa família não foi associado à desnutrição ou excesso de peso. A prevalência de desnutrição infantil foi baixa, mas o excesso de peso foi mais prevalente do que a desnutrição. Não foi detectada desigualdade social em relação à desnutrição em crianças menores de cinco anos, sugerindo evolução favorável no sen-tido de maior equidade.
Palavras-chave: Desnutrição infantil. Sobrepeso infantil. Transtornos nutricio-nais. Saúde infantil.
Introduction
Malnutrition is characterized as a pathological condition resulting from a lack of energy and proteins in different proportions, which can be aggravated by repeated infections1. In contrast, child and adult obesity is defined as the excessive ac-cumulation of fat2.
There is ample evidence that deficits in growth during childhood are associated with higher levels of mortality, infectious diseases and harm to psychomotor development, lower school performance, and a reduction in height and productive capacity in adult-hood3,4. In the case of women, the reduction in growth during childhood is associated with low height and a higher risk of having children with low birth weight5, showing the inter-generational effect of malnutrition.
A study conducted by Monteiro (2009)6 identified a reduction in child malnutrition in Brazil of nearly 50% between 1996 and 2006/7. In contrast to this reduction, there has been an increase in the prevalences of child overweight and obesity. Currently, the rise in these indices has become a public health problem, as obesity causes harm to health, resulting in conditions such as the metabolic syndrome, high risk of developing hypertension, dyslipidemia, type 2 diabetes mellitus, osteoarthritis and certain types of cancer7. The prevalence of obesity has increased rapidly and is associated with changes in life habits, among which are the increase in physical inactivity and in-adequate eating habits.
A study conducted in the state of Maranhão in 1996 estimated a high preva-lence of malnutrition in children under five years of 11.9%10, using the weight-for-age indicator, higher than that estimated for the Northeast region of 6.3%, with the same in-dicator and in that same year9. However, the population-based studies that have been conducted did not estimate the prevalence of overweight in children under five years in Maranhão.
The implementation of the current social policies, among which cash transfer programs are included, has played an im-portant role in the reduction of social ine-qualities, with regard to malnutrition6 and child mortality11. However, few studies have been conducted to observe whether there are differences in the prevalences of malnu-trition and overweight, when the population that receives the Bolsa-Família benefit (a social welfare program of the Brazilian government that provides financial aid to impoverished families) is compared to the remaining groups.
Malnutrition has been associated with poverty, low maternal level of education, poor housing and sanitation conditions, a higher number of residents in the household, and maternal age younger than 20 years6,12.
Until now, the prevalences of malnu-trition and overweight and the factors associated with these health problems have not been identified in children living in Maranhão, nor has the level of social inequality associated with malnutrition. In less developed areas, it is important to assess whether malnutrition is decreasing in importance and whether overweight has become a public health problem. Thus, the present study aimed to assess the prevalen-ces and factors associated with malnutrition and overweight in children under five years living in the six most populous cities of the state of Maranhão, one of the poorest in the country.
Methods
Data from the cross-sectional study
entitled “Atenção à Saúde no Maranhão”
(State of Maranhão Health Care) and con-ducted in 2006-7 were used in the present study, which included a probabilistic sample of children under five years. This sample was investigated using a household survey applied in the six cities of the state of Maranhão with more than 100,000 inha-bitants (São Luis, Imperatriz, Caxias, Codó, São José de Ribamar and Timon)13. This study aimed to analyze the prevalence of the main health indicators and the use of services by the population living in these six most populous cities of the state.
A two-stage cluster sampling process with a probability proportional to the popu-lation of each city was used. In the first stage, a total of 100 census tracts were selected in the six cities, with a probability propor-tional to the population estimated by the 2000 Census. In the second stage, the initial block of each tract was randomly selected, followed by the selection of the initial point within each block, from which interviewers walked through the streets until the mothers or guardians of 12 children under five years could be interviewed in each census tract, regardless of the number of children in this age group included per household. In the second stage, the sample unit was the individual, although the sampling process was performed in the household level. In the cases when this number of children could not be found on a certain block, a random selection of another block in the same census tract was made until the ex-pected number could be achieved. If there were more children in the last household than the 12 required per sector, all of them were included and, in such cases, the total number of sample children surpassed 12. As households were selected with approxi-mately the same probability, weighting was not required.
size, which was comprised of 918 children. The final sample included 1,214 children to compensate for the use of a complex sampling design.
Anthropometric measurements such as weight (kg) and length/height (cm) were collected from children. Weight was me-asured in kilograms with Plenna® digital scales, with a capacity of 150kg and accuracy of 100g, placed on a flat surface. Children were weighed without clothes and in their mother’s or guardian’s arms and their wei-ght was defined by the difference obtained. Length was measured in the case of chil-dren aged until two years and height was measured in the case of older children. An Alturexata® infantometer with an accuracy of 0.1cm was used to measure length, with children lying on their back, legs relaxed and head supported, while the mobile part of the infantometer was slid towards their lined feet, touching them. Height was me-asured with children standing in orthostatic position, barefoot, legs and feet together, arms alongside the body and head in the Frankfurt plane. An Alturexata® stadiome-ter with an accuracy of 0.1cm was used to measure height.
Child age was determined according to the difference between their date of birth and the date of data collection. The classification proposed by the Associação Brasileira de Empresas de Pesquisa (ABEP – Brazilian Association of Market Research Companies)14 was used to define economic classes.
The anthropometric indices of length/ height-for-age z-score (HAZ), weigth-for--age z-score (WAZ) and weight-for-length/ height z-score (WHZ) were measured in Z-score values (standard-deviation units), compared to the World Health Organization (WHO) standard values15. The cut-off points < –2 Z-score were used to categorize malnu-trition and the cut-off points > +2 Z-score were used to categorize overweight with the weight-for-length/height index, according to the Sistema de Vigilância Nutricional
(SISVAN – Nutritional Surveillance System) classification16. Indices were calculated in
the WHO Anthro software, version 3.0.117. The “housing and sanitation conditions” variable was created to summarize the va-riables referring to these conditions with the use of a score. The following variables were considered to construct this score: housing type, water supply, sewage system and garbage collection. Each of these variables was coded as adequate (0) or inadequate (1). Values were added, thus obtaining the score. Consequently, the lower the score, the better the housing and sanitation conditions. The remaining variables were obtained from a standard questionnaire applied by previou-sly trained researchers during the interview with the child’s mother or guardian.
The dependent variable used in the statistical model was the weight-for-height index, divided into three categories: nor-mal weight (used as reference category), malnutrition and overweight. The statis-tical analysis was performed in the Stata software, version 9.018, using the set of svy commands. The use of conventional esti-mators could significantly underestimate the variance of accurate estimates18. The set of svy commands of Stata considered the complex sampling design (two-stage cluster sampling and previous stratification per city)17.
The descriptive analysis was initially performed and the univariate analysis was subsequently performed, using simple multinomial logistic regression, with an es-timate of unadjusted prevalence ratios and 95% confidence intervals (95%CI). The mul-tivariate analysis was performed according to the hierarchical model defined a priori (Figure 1). The first group (hierarchical level 1) included the socioeconomic variables: economic class and level of education of the head of the family; the second group included ethnicity: ethnic group of the head of the family; the third group included the environmental variables measured with a score, summarizing housing and sanitation conditions; the fourth group included the
governmental programs: Bolsa-Família
follow-up; the fifth group included the de-mographic variables: maternal age, number of residents in the household and sex of the head of the family; and the sixth group included the biological variables: child sex and age.
In the first group (hierarchical level 1) were the socioeconomic variables, even those not significant in the bivariate analy-sis. The significant variables in this analysis (p-value < 0.10) remained in the model and were included in the adjustment of the following group, ethnicity (hierarchical level 2). The same procedure was applied to the following groups of the model. At the end of the above mentioned procedure, two final models of associated factors were created: one for the deficit in and another for exces-sive weight-for-length/height.
Hierarchical analysis was also perfor-med for the deficit in length/height-for-age, using a logistic regression model.
The study protocols were approved by the Research Ethics Committee of the
Universidade Federal do Maranhão – UFMA
under number 275/06 and followed the norms of Resolution 196/96 of the Brazilian Health Council and its complementary nor-ms on human research.
Results
According to the weight-for-age index, the prevalence of malnutrition was 4.5%. Based on the weight-for-height index, 3.9% had malnutrition and 6.7% were overweight. Low length/height-for-age was observed in 8.5% of children under five years (Table 1).
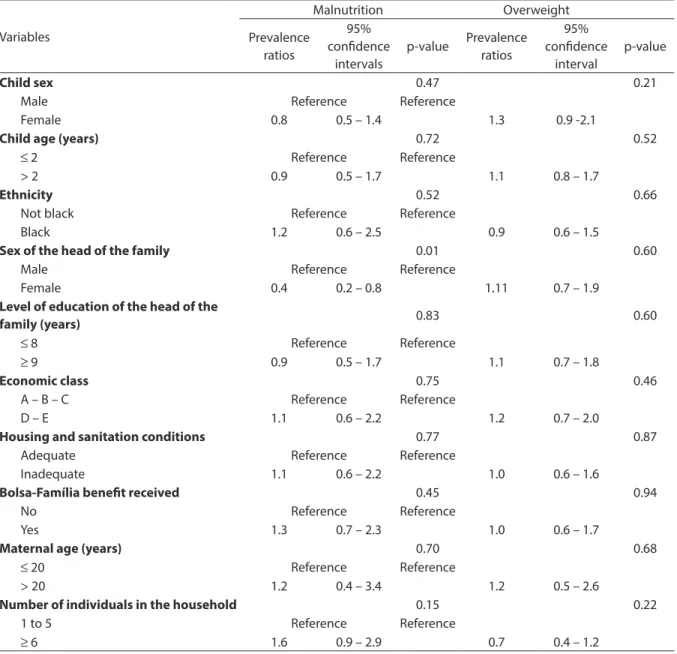
In the univariate analysis, children whose families were headed by women had a lower prevalence of malnutrition (PR=0.4, 95%CI 0.2-0.8). The prevalence of malnutrition in children who received the
Bolsa-Família benefit was similar to that of children who did not (Table 2).
Tables 3 and 4 show the results of the multivariate analysis. Even when the effect of the socioeconomic, environmental and biological variables is controlled, they did not show a statistically significant
Figure 1 – Theoretical model used to investigate the determinant factors of nutritional status in children under ive years, structured in hierarchical groups.
association with malnutrition or overwei-ght. Of the variables studied, only female head of the family remained independently associated with malnutrition after adjust-ment (Prevalence ratios = 0.4).
In the hierarchical logistic regression analysis, none of the factors was associated with the deficit in length/height-for-age (data not shown in the table).
Discussion
The estimated prevalences of malnu-trition and overweight were low. The pre-valence of overweight was higher than that of malnutrition, considering the weight--for-height index in children under five years, living in the six most populous cities of the state of Maranhão. The socioecono-mic factors were not associated with child nutritional status and families headed by women had a higher prevalence of malnu-trition according to the weight-for-height index. Receiving benefits from cash transfer programs did not show an association with malnutrition or overweight.
In an article published by Martorell 199819, the prevalences of low weight-for-length/
height were 1.2% in the Dominican Republic, 1.1% in Honduras and Peru and 0.4% in the United States, lower than those found in this study. With regard to excessive weight-for--length/height, the prevalences observed were 4.6% in the Dominican Republic, 1.4% in Honduras, 4.7% in Peru and 7.4% in the United States, also lower than those found in this study, with the exception of the United States.
According to data from the PNDS in 2006, the deficit in weight-for-length/ height in Brazil was 1.5%, lower than the 3.9% found in the six cities of the state of Maranhão analyzed in this study, indicating that the current prevalence of malnutrition is more than double the prevalence obser-ved for the country. With regard to the deficit in length/height-for-age, the prevalence obtained in that same study was 6.7%, also lower than the 8.5% found in this study9. These results show that the prevalence of previous malnutrition in these cities was low, although higher than the national prevalence.
Despite the prevalences of malnutrition found in this study being higher than the national prevalences, studies previously
Table 1 - Nutritional status according to the criteria weight-for-age*, weight-for-length/height** and length/height-for-age* among under ive year old children in the six most populous cities from Maranhão state, 2006/2007.
Tabela 1 - Estado nutricional segundo os critérios peso para idade*, peso para estatura** e estatura para idade* em menores de cinco anos nos seis municípios mais populosos do Maranhão, 2006/2007.
Indicators n % 95%CI
Weight-for-age index
Very low weight-for-age 14 1.2 0.6 – 1.8
Low weight-for-age 39 3.3 2.2 – 4.3
Normal weight 1,146 95.6 94.4 – 96.7
Weight-for-height index
Low weight-for-length/height 46 3.9 2.8 – 5.0
Normal weight 1,051 89.4 87.6 – 91.1
High weight-for-length/height 79 6.7 5.3 – 8.1
Length/height-for-age index
Low length/height-for-age 100 8.5 6.9 – 10.1
Adequate length/height-for-age 1,076 91.5 89.9 – 93.1
conducted in the state of Maranhão sho-wed higher indices than the current ones. When compared to the results of this study, there was a reduction in the prevalence of previous malnutrition, which decreased from 30.6% in 1991 to 24.0% in 199610, in a representative sample of children under five years of age. In this study, the prevalence of
previous malnutrition was 8.5% in 2006/7 in the six most populous cities of Maranhão, lower than the value found for this entire state in 1996, thus suggesting that previous malnutrition decreased during this period. While studying children aged one year from two population-based cohorts in Southern Brazil, Post,20 observed that Table 2 -Non-adjusted analysis by multinomial logistic regression of the factors associated to underweight and excess weight according to the weight-for-length/height criterion among under ive year-old children who live in the six most populous cities, Maranhão state, 2006/2007.
Tabela 2 - Análise não ajustada por regressão logística multinomial dos fatores associados à desnutrição e ao excesso de peso pelo critério peso para estatura em crianças menores de cinco anos nos seis municípios mais populosos do Estado do Maranhão, 2006-2007.
Variables
Malnutrition Overweight
Prevalence ratios
95% conidence
intervals
p-value Prevalence ratios
95% conidence
interval
p-value
Child sex 0.47 0.21
Male Reference Reference
Female 0.8 0.5 – 1.4 1.3 0.9 -2.1
Child age (years) 0.72 0.52
≤ 2 Reference Reference
> 2 0.9 0.5 – 1.7 1.1 0.8 – 1.7
Ethnicity 0.52 0.66
Not black Reference Reference
Black 1.2 0.6 – 2.5 0.9 0.6 – 1.5
Sex of the head of the family 0.01 0.60
Male Reference Reference
Female 0.4 0.2 – 0.8 1.11 0.7 – 1.9
Level of education of the head of the
family (years) 0.83 0.60
≤ 8 Reference Reference
≥ 9 0.9 0.5 – 1.7 1.1 0.7 – 1.8
Economic class 0.75 0.46
A – B – C Reference Reference
D – E 1.1 0.6 – 2.2 1.2 0.7 – 2.0
Housing and sanitation conditions 0.77 0.87
Adequate Reference Reference
Inadequate 1.1 0.6 – 2.2 1.0 0.6 – 1.6
Bolsa-Família beneit received 0.45 0.94
No Reference Reference
Yes 1.3 0.7 – 2.3 1.0 0.6 – 1.7
Maternal age (years) 0.70 0.68
≤ 20 Reference Reference
> 20 1.2 0.4 – 3.4 1.2 0.5 – 2.6
Number of individuals in the household 0.15 0.22
1 to 5 Reference Reference
overweight had an increasing trend, sho-wing a prevalence of 4.0% in 1982 and 6.7% in 1993 according to the weight-for-height index. Based on this same index, the preva-lence of overweight in the present study was 6.7%, comparable to that found in the city of Pelotas, in Southern Brazil, in 199320. When the current overweight rates calculated for the six most populous cities of Maranhão were compared with studies conducted in other states, it was observed that the prevalence of overweight of 6.7% with the weight-for-height index was similar to that found in the city of Florianópolis - SC (6.8%)
and lower than that found in São Leopoldo - RS (9.8%) in children at the same age21,22. Findings such as these show that nutri-tional differences, which were previously evident in children of the Northeastern and Southern regions of Brazil, are not so evident as they have become more homogeneous in the entire country.
By analyzing these results and compa-ring them to previous studies conducted in other states, it is assumed there was a change in the nutritional status of these children, with the reduction in malnutri-tion and increase in overweight. This fact,
Table 3 - Adjusted hierarchical analysis by multinomial logistic regression of the factors associated to underweight according to the weight-for-length/height criterion among under ive year-old children who live in the six most populous cities, Maranhão state, 2006/2007.
Tabela 3 - Análise hierarquizada ajustada por regressão logística multinomial dos fatores associados à desnutrição pelo critério peso para estatura em crianças menores de cinco anos nos seis municípios mais populosos do Estado do Maranhão, 2006-2007.
Variables
Group 1 Group 2 Group 3 Group 4 Group 5 Group 6
PR (95%CI) p PR (95%CI) p PR (95%CI) p PR (95 %CI) P PR (95%CI) p PR (95%CI) p
Economic class
A – B 1
C 2.9 (0.7 – 13.2) 0.16
D – E 3.0 (0.6 – 15.1) 0.17 Level of education
of the head of the family
≤ 8 years 1
≥ 9 years 1.2 (0.6 – 2.3) 0.69
Ethnicity of the head of the family
White 1
Mixed 1.4 (0.6 – 3.3) 0.46
Black 1.2 ( 0.3 – 4.4) 0.76
Environmental conditions
Adequate 1
Inadequate 1.1 (0.6 – 2.2) 0.77
Bolsa-Família beneit received
No 1
Yes 1.4 (0.7 – 2.6) 0.30
PSF follow-up
No 1
Yes 0.9 (0.4 – 1.7) 0.70
Maternal age
< 20 years 1
≥ 20 years 1.1 (0.4 – 3.3) 0.82
Number of residents in the household
5 or fewer 1
6 or more 1.6 (0.9 – 3.0) 0.12
Sex of the head of the family
Male 1 1
Female 0.4 (0.2 – 0.8) 0.01 0.4 (0.2 – 0.8) 0.01
Child age ≤ 2 years 1
> 2 years 0.9 (0.4 – 1.7) 0.71
Child sex
Male 1
Female 0.8 (0.4 -1.3) 0.34
however, may point to the evidence that the nutritional transition process is occurring in this age group, when the global deficiencies of malnutrition are decreasing and overwei-ght is increasing, without one replacing the other. According to Batista Filho (2009)23, this pattern has become a great challenge for developing countries.
Several studies have associated low income with malnutrition and high inco-me with overweight22,24. However, other studies have shown that the socioeconomic conditions of families are not more closely associated with child nutritional status, as
observed by Corso (2003)21. In the present study, overweight and malnutrition did not show statistically significant associations with head of the family, economic class and other socioeconomic variables. Based on the results found, it could be suggested that inequalities have been reduced in the state of Maranhão, as other socioeconomic factors were not associated with nutritional disorders in children.
In a study published by Lima (2010)25, the simultaneous improvement in family purchasing power, maternal level of edu-cation, availability of sanitation and health
Table 4 - Adjusted hierarchical analysis by multinomial regression of the factors associated to excess weight according to the weight-for-length/height criterion among under ive year-old children who live in the six most populous cities, Maranhão state, 2006/2007.
Tabela 4 - Análise hierarquizada ajustada por regressão logística multinomial dos fatores associados ao excesso de peso pelo critério peso para estatura em crianças menores de cinco anos nos seis municípios mais populosos do Estado do Maranhão, 2006-2007.
Variables
Group 1 Group 2 Group 3 Group 4 Group 5 Group 6
PR (95%CI) p PR (95%CI) p PR (95%CI) p PR (95 %CI) P PR (95%CI) p PR (95%CI) p
Economic class
A – B 1
C 1.2 (0.5 – 2.8) 0.68 D – E 1.8 (0.7 – 4.3) 0.21 Level of
education of the head of the family
≤ 8 years 1
≥ 9 years 1.4 (0.8 – 2.5) 0.19
Ethnicity of the head of the family
White 1
Mixed 1.0 (0.6 – 1.9) 0.88 Black 0.9 (0.4 – 2.4) 0.91
Environmental conditions
Adequate 1
Inadequate 1.0 (0.6 – 1.6) 0.87
Bolsa-Família beneit received
No 1
Yes 1.0 (0.5 – 1.7) 0.91
PSF follow-up No 1
Yes 1.1 (0.6 – 1.8) 0.80
Maternal age < 20 years 1
≥ 20 years 1.1 (0.5 – 2.5) 0.76
Number of residents in the household
5 or fewer 1
6 or more 0.7 (0.4 – 1.2) 0.17
Sex of the head of the family
Male 1 1
Female 1.2 (0.7 – 2.0) 0.52 1.1 (0.7 – 1.9) 0.63
Child age
≤ 2 years 1
> 2 years 1.1 (0.7 – 1.7) 0.60
Child sex Male 1
Female 1.3 (0.8 – 2.0) 0.26
care services and mothers’ reproductive history could explain slightly more than half of the reduction in the prevalence of child malnutrition in the Northeastern region be-tween 1986 and 1996 and almost two thirds of it between 1996 and 2006. This suggests that the improvement in these indicators contributed to the reduction in or even the elimination of socioeconomic inequalities with regard to malnutrition.
Being a child in a family headed by a wo-man was associated with a lower prevalence of malnutrition (PR 0.4, 95%CI 0.2 – 0.8). According to Carvalhaes26, the maternal capacity to manage and optimize the several resources required for adequate child care could influence child nutritional status. This could explain such findings in the sense that female heads of the family have the power to control and allocate available resources in a more convenient way to guarantee their children’s nutritional health.
Based on this cross-sectional study, it could not be concluded that the associa-tions observed were causal, although possi-ble factors associated with child nutritional status have been suggested. The study’s population-based approach should be em-phasized as one of its strong points. Among children under five years, the prevalence of malnutrition was low in the cities with a hi-gher number of inhabitants and overweight already appears as a public health problem,
thus posing a serious challenge to health services and policies.
Another point which should be empha-sized is that overweight is more prevalence than malnutrition in these cities. This sug-gests that, in the process of child nutritional transition, malnutrition was not replaced by the standard where overweight prevails, despite its decreasing trend. This situation is similar to the third stage described by Batista Filho27, when overweight/obesity would be more frequent than malnutrition in the nutritional transition process on a population scale.
In conclusion, child nutritional status needs to be monitored and public nutri-tion educanutri-tion policies that deal with such nutritional disorders and are aimed at both low- and high-income families must be developed.
Authors’ contributions
D. C. Chagas contributed to the article conception, discussion of results and text writing; A. A. M. Silva, L. C. Coimbra, R. F. L. Batista, V. M. F. Simões and Z. C. Lamy con-tributed to the interpretation and discussion of results and final text review; and M. T. S. S. B. Alves contributed to the interpretation and discussion of results, text writing and final text review.
References
1. Lacerda EMA, Accioly E, Faria IG, Costa VM. Práticas de Nutrição Pediátrica. São Paulo: Editora Atheneu; 2006.
2. Frelut ML, Navarro J. Obesity in the child. Presse Med
2000; 10: 572-7.
3. Black RE, Allen LH, Bhutta ZA, Caulfield LE, de Onis M, Ezzati M et al. Maternal and child undernutrition: global and regional exposures and health consequences.
Lancet 2008; 371(9608): 243-60.
4. Victora CG, Adair L, Fall C, Hallal PC, Martorell R, Richter L et al. Maternal and child undernutrition: consequences for adult health and human capital.
Lancet 2008; 371(9609): 340-57.
5. Kramer MS. Determinants of low birth weight: methodological assessment and meta-analysis. Bull Word Health Organ 1987; 65: 663-737.
6. Monteiro CA, Benicio MHDA, Konno SC, Silva ACFd, Lima ALLd, Conde WL. Causas do declínio da desnutrição infantil no Brasil, 1996-2007. Rev Saúde Pública 2009; 43: 35-43.
7. Mello ED, Luft VC, Meyer F. Obesidade infantil: como podemos ser eficazes? J Pediatr 2004; 80: 173-82.
9. Brasil. Ministério da Saúde. Pesquisa Nacional de Demografia e Saúde da Criança e da Mulher - PNDS 2006: dimensões do processo reprodutivo e da saúde da criança. Ministério da Saúde, Centro Brasileiro de Análise e Planejamento. Brasília, DF; 2009.
10. Tonial SR, Silva AAM. Saúde, Nutrição e Mortalidade Infantil no Maranhão. São Luis: Gráfica Universitária – UFMA; 1997.
11. Aquino R, Oliveira NF, Barreto ML. Impact of the Family Health Program on Infant Mortality in Brazilian Municipalities. Am J Public Health 2009, 99: 87-93.
12. Olinto MTA, Victora CG, Barros FC, Tomasi E. Determinantes da desnutrição infantil em uma população de baixa renda: um modelo de análise hierarquizada. Cad Saúde Pública 1993; 9(S1): 14-27
13. Alves MTSSB, Sousa SMPS, Coimbra LC. Atenção a Saúde do adulto e da criança no Maranhão. São Luis: EDUUFMA; 2009.
14. ABEP. Critério de Classificação Econômica Brasil 2009. Disponível em www.abep.org.br/mural/abep/cceb. htm.2003 [Acessado em maio de 2009]
15. World Health Organization. Child Growth Standards: Length/height-for-age, weight-forage, weight-for-length, weight-for-height and body mass index-for-age. Methods and development. Geneva, Switzerland: WHO; 2006.
16. Brasil. Vigilância Alimentar e Nutricional SISVAN:
Orientações para a coleta e análise de dados antropométricos em Serviços de Saúde. Brasília: Ministério da Saúde; 2008.
17. WHO Anthro. [programa de computador].Versão 3. World Health Organization; 2009
18. Stata Corp. Stata Topics Survey Data Analysis. UCLA: Academic Technology Services, Statistical Consulting Group. Disponível em http://www.ats.ucla.edu/stat/ Stata/topics/ Survey.htm. [Acessado em 14 de abril de 2010]
19. Martorell R, Khan LK, Hughes ML, Grummer-Strawn LM. Obesity in Latin American Women and children. J Nutr 1998; 128: 1464-73.
20. Post CL, Victora CG, Barros FC, Horta BL, Guimarães PRV. Desnutrição e obesidade infantis em duas coortes de base populacional no Sul do Brasil: tendências e diferenciais. Cad Saúde Pública 1996; 12: 49-57.
21. Corso ACT, Botelho LJ, Zeni LAZR, Moreira EAM. Sobrepeso em crianças menores de 6 anos de idade em Florianópolis, SC. Rev Nutr 2003; 16: 21-8.
22. Vitolo MR, Gama CM, Bortolini GA, Campagnolo PDB, Drachler MDL. Alguns fatores associados a excesso de peso, baixa estatura e déficit de peso em menores de 5 anos. J Pediatr 2008; 84: 251-7.
23. Batista Filho M, Souza AI, Miglioli TC, Santos MC. Anemia e obesidade: um paradoxo da transição nutricional brasileira. Cad Saúde Pública 2008; 24: 247-57.
24. Mondini L, Monteiro CA. Relevância epidemiológica da desnutrição e da obesidade em distintas classes sociais: métodos de estudo e aplicação à população brasileira.
Rev Bras Epidemiol 1998; 1: 28-39.
25. Lima ALL, Silva ACF, Konno SC, Conde WL, Benicio MHDA, Monteiro CA. Causas do declínio acelerado da desnutrição infantil no Nordeste do Brasil (1986-1996-2006). Rev Saúde Pública 2010; 44: 17-27.
26. Carvalhaes MABL, Benício MHDA. Capacidade materna de cuidar e desnutrição infantil. Rev Saúde Pública 2002; 36: 188-97.
27. Batista Filho M, Rissin A.. A transição nutricional no Brasil: tendências regionais e temporais. Cad Saúde Pública 2003; 19: 181-91.