Bolsa-Família Program: Diet
quality of adult population in
Curitiba, Paraná
Programa Bolsa-Família: qualidade
da dieta de população adulta do
município de Curitiba, PR
Flávia Emília Leite de Lima
IRegina Mara Fisberg
IIKátia Yumi Uchimura
IIITelma Picheth
IIII Departamento de Nutrição da Universidade Federal da Paraíba.
II Departamento de Nutrição, Faculdade de Saúde Pública, Universidade de São
Paulo.
III Curso de Nutrição da Faculdade Evangélica do Paraná.
The present research project was funded by the Conselho Nacional de Desenvolvimento Cientíico e Tecnológico (CNPq – National Council for Scientiic and Technological Development – process 401992-2005/5)
Corresponding author: Flávia Emília Leite de Lima. Universidade Federal da Paraíba - Centro de Ciências da Saúde - Departamento de Nutrição. Cidade Universitária s/n. João Pessoa – PB. CEP: 58000-00. E-mail: [email protected]
Abstract
This study evaluated the quality of diet of the population receiving the Bolsa Familia Program in Curitiba, state of Parana, Brazil. It was a population-based cross-sectional study, conducted from July 2006 to July 2007. 747 beneficiaries were interviewed from 19 years of age, of both genders. A 24 hour-recall was implemented in order to assess the quality of the diet and the Healthy Eating Index (HEI) was used as a parameter for the classification of the group in consump-tion levels. Descriptive statistics were used to describe the diet quality of the studied population. Wald test and ANOVA test were performed to compare the means of the index according to the socio-economic vari-ables, considering a significance level of 5%. The sample comprised 91.4% of women and 8.6% ofmen. The average age of the popula-tion was 36.4 ± 13.3 years, with 75% having completed elementary school. The mean HEI was 51 points, which features a diet that needs improvement. The population has a monotonous diet with an adequate intake of legumes, but low for fruits, vegetables and dairy products. Comparing the categories of diet quality of individuals, all components, except sodium, showed statistically differ-ent median score (p < 0.01). Studies that evaluate the quality of the diet are essential to support the implementation of nutrition education programs targeted to the core of the problem in the populations studied.
Resumo
Este estudo avaliou a qualidade da dieta da população beneficiária do Programa Bolsa-Família, em Curitiba, PR. Estudo transversal, de base populacional, realizado no período de julho de 2006 a julho de 2007. Foram entrevistados 747 beneficiários, a partir dos 19 anos de idade, de ambos os sexos. Para avaliação da qualidade da dieta foi aplica-do recordatório de 24 horas, e o Índice de Qualidade da Dieta (IQD) foi utilizado como parâmetro para classificação do grupo em níveis de consumo. Estatística descritiva foi utilizada para descrever a qualidade da dieta da população. Para a comparação de médias do índice segundo as variáveis socioeconômicas foram realizados o teste
t de Wald e a análise de variância ANOVA, considerando-se um nível de significância de 5%. A amostra foi constituída por 91,4% de mulheres e 8,6 % de homens. A média de idade da população foi de 36,4 ± 13,3 anos, com cerca de 75 % possuindo o ensino fun-damental incompleto. A média do IQD foi de 51 pontos, o que caracteriza uma dieta que precisa de ajustes. A população possui uma dieta monótona, com um consumo adequa-do de leguminosas, porém baixo para frutas, verduras e produtos lácteos. Na comparação entre as categorias de qualidade da dieta dos indivíduos, todos os componentes, com exceção do sódio, apresentaram medianas de pontuação estatisticamente diferentes (p < 0,01). Estudos que avaliem a qualidade da dieta são fundamentais para subsidiar a implantação de programas de educação alimentar direcionados para o cerne do problema nas populações estudadas.
Palavras-chave: Dieta. Hábitos alimentares. Programas de governo. Índice de qualidade da dieta. Saúde. Alimentos.
Introduction
The social food and nutrition policies developed in Brazil have provided several proposals, aimed at solving food and nutri-tional problems of the population1.
The Bolsa-Família (Family Allowance) is a cash transfer program that provides finan-cial aid to poor Brazilian families and aims to fight hunger, poverty and inequalities.2. Its
functioning is based on direct monthly cash transfers to registered families. According to Marques et al3, this program benefits
ap-proximately 47 million Brazilians and may total up to 21% of the household income. Attanasio and Mesnard4 reported that the
re-sources provided through the social welfare program implemented in Colombia were more frequently used to purchase foods.
Data from the Instituto Brasileiro de
Análises Sociais e Econômicas (IBASE – Brazilian Institute of Socioeconomic Analyses) show that beneficiaries of the
Programa Bolsa-Família (PBF – Family Allowance Program) spend 73% of the ben-efits on foods on average, in the Southern region of the country. The consumption of foods from the group of vegetables in this region was the one that changed the least, when compared to the remaining food groups5.
The most recent study on household budget conducted in Brazil confirms the increase in the consumption of fat-rich foods, to the detriment of typical Brazilian staples, such as rice, beans, fruits and veg-etables. When stratified by income, beans, roots and tubers are more consumed by the population with an income of up to ¼ of one minimum wage, whose diet is mainly based on carbohydrates. Food quality in the Southern region was assessed, reveal-ing the lowest consumption of beans and the highest consumption of saturated fats among the five Brazilian regions6.
status of a certain population. Changes in the consumption of certain foods by this population have been shown in different studies. However, it is important to identify what direction beneficiaries have followed with regard to the quality of what they have consumed.5,7,8
The approach to food quality, in terms of foods and/or food groups, is useful not only to describe dietary habits, but also to show the characteristics of the socio-cultural context in which a certain population is included9-11.
In view of the nutritional situation in Brazil that has been described here and the lack of studies with a population with such representativeness, the present study aimed to investigate the diet quality of the population registered with the PBF, in the city of Curitiba, PR.
Methods
A cross-sectional study was conducted between 2006 and 2007, in Curitiba, PR, Southern Brazil. This city is divided into nine Health Districts, whose boundaries correspond to the division of the geographi-cal space into regional administrative units. According to the 2005 estimates from the
Instituto Brasileiro de Geografia e Estatística
(IBGE – Brazilian Institute of Geography and Statistics), there are 1,757,903 inhabitants living in this city. The highest growth rate (5.34% per year) occurred between the 1970s and 1980s. When the period between 1996 and 2000 is considered, the annual growth rate was 1.82%12.
The city of Curitiba health network was comprised of 105 Health Units (HU) in 2005 and, according to data from the Brazilian Ministry of Social Development and Fight against Hunger of that same year, there were 31,323 families registered with the above
mentioned program in Curitiba13.
Sample selection
The number of families registered with the PBF, who lived in the coverage area of
the city of Curitiba in 2005, was conside-red to calculate the sample size. The size of this population per health district and per health unit was made available by the Epidemiology Sector of the Municipal Department of Health.
The calculation of the sample size consi-dered the population of 31,323 families, an acceptable error of 3% and significance level of 5%, resulting in a total number of 1,073 households. The districts of Bairro Novo and Cajuru were excluded from the sample, as a similar study had been conducted in the year prior to the data collection of this stu-dy, totaling 747 households. The sampling plan, as far as the selection of individuals to be interviewed is concerned, was designed according to probabilistic process techni-ques, using a proportional stratified sample in stages. First, the health district (HD) was considered as stratum, aiming to guarantee that representatives of the entire benefited population could be interviewed without restrictions.
To guarantee population representati-veness in the study of diet quality, families registered in all health units of Curitiba were selected. To achieve this, after dividing the sample per health district, the proportional distribution of the number of families per health unit was made.
A selection was carried out according to a numbered list of the families to choose the households whose individuals would be interviewed.
Researchers determined that the head of the family or another adult, who was aged more than 18 years, lived in the household and was present at the moment of the visit, would be appropriate to participate in the study. If there was nobody in the selected household at the moment of the visit or if all household members refused to partici-pate, the following household on the list was chosen.
Data collection
selection process. undergraduate Nutrition students and newly graduated nutritionists participated in the teams. All interviewers were previously trained for this task.
Data collection occurred simultaneously in two health districts. In addition, commu-nity health agents from primary health care units helped with this activity to facilitate interviewers’ access to households.
Individuals were invited to participate in the study to voluntarily respond to a ques-tionnaire about life habits and food intake.
Information about socio-demographic characteristics of the population was also collected, such as age, marital status, occupation, number of residents in the household, place of origin, and level of education of the interviewee and head of the family.
A 24-hour food recall was applied to ob-tain data on food intake. All foods consumed on the previous day were recorded, with their respective cooking measures. In cer-tain cases, when it was difficult to measure the amount consumed (for example: a small slice of cake), the photo album developed by Zabotto et al (1996)14 was used as an
addi-tional resource for food questionnaires. In the case of certain foods for whose serving there were no photographs, the serving size reported by the participant was taken into consideration, following the food table developed by Pinheiro et al (2001)15 as the
standard.
Data processing
The chemical composition of partici-pants’ 24-hour food recalls was calculated
using the Nutri software, version 1.016.
Before inputting the data on food recalls into the software program, a critical analysis of these food recalls was made to identify measurement errors in the amounts repor-ted. Homemade preparations such as pizza, sandwiches and salads were broken down into their respective ingredients to be input into the program, aiming to better catego-rize foods according to the food pyramid groups. To achieve this, the standardized
recipes proposed by Pinheiro et al (2000)16
and Fisberg and Villar17 were used. In all
preparations, the amount of salt added was considered separately, aiming to more accu-rately observe the amount consumed to as-sess its sodium, a component of the Healthy Eating Index (HEI). Questionnaires with a daily consumption lower than 500kcal or higher than 4,000kcal were excluded from the sample, according to what has been established by Willett (1998)18.
Food consumption was assessed with the HEI, an instrument that measures glo-bal eating quality, incorporates nutrients and foods as quality components and es-tablishes scores from zero to ten points for each component to classify an individual’s diet11,19.
Individuals with a consumption equal to the recommended level achieve a maximum score of ten points. The minimum score of zero is obtained when no foods of a certain food group were consumed. Low consump-tion refers to those components whose score is lower than five; intermediate, from five to eight points; and high, above eight points.
The maximum value that the HEI can achieve is 100 points. High scores mean that consumption is close to the intervals or amounts recommended; low scores indicate consumption below the recommendation. In the present study, the HEI whose score
had been established by Bowman (1998)20
was used, which categorizes individuals’ diet into inadequate – up to 51 points; re-quiring adjustments – 51 to 80 points; and adequate – more than 80 points.
associations were found, the Tukey’s test was used to identify the categories that differed from one another. The Kruskal-Wallis test was used to observe the difference between medians of consumption in each group, according to the HEI score.
The present research project was ap-proved by the Research Ethics Committee
of the Faculdade Evangélica do Paraná and
authors declared there were no conflicts of interest.
Results
A total of 747 individuals were inter-viewed. Among these, 91.4% were women and 8.6% were men. The mean age of the population was 36.4 ± 13.3 years, of which approximately 75% had an incomplete
primary school level, 35.1% were married, and 51.7% were day workers. The mean HEI was 50.4 points. According to this index, 52.9% were categorized as having an inadequate diet, 45.7%as diet requiring adjustments, and 1.3% as adequate diet.
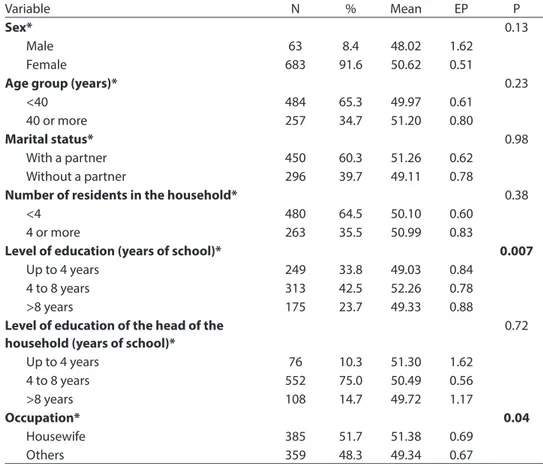
Table 1 shows that the HEI indicated a higher mean among females, housewi-ves, those aged more than 40 years, those with a partner, and those having between four and eight years of education. “Level of education” and “occupation” showed a statistically significant difference in means between their categories.
Table 2 shows the mean consumption of energy, fats and cholesterol, according to HEI categories. There was an increase in the consumption of energy with the increase in index scores. The median score of each
Table 1 –Distribution of number and percentage of individuals, health eating index(HEI) means, standard error and “p” value according sociodemographic variables. Curitiba, 2006-2007.
Tabela 1 - Distribuição do número e porcentagem de indivíduos, média do índice de qualidade da dieta (IQD), erro padrão e valor de p segundo variáveis sociodemográicas. Curitiba, 2006-2007.
Variable N % Mean EP P
Sex* 0.13
Male 63 8.4 48.02 1.62
Female 683 91.6 50.62 0.51
Age group (years)* 0.23
<40 484 65.3 49.97 0.61
40 or more 257 34.7 51.20 0.80
Marital status* 0.98
With a partner 450 60.3 51.26 0.62 Without a partner 296 39.7 49.11 0.78
Number of residents in the household* 0.38
<4 480 64.5 50.10 0.60
4 or more 263 35.5 50.99 0.83
Level of education (years of school)* 0.007
Up to 4 years 249 33.8 49.03 0.84
4 to 8 years 313 42.5 52.26 0.78
>8 years 175 23.7 49.33 0.88
Level of education of the head of the household (years of school)*
0.72
Up to 4 years 76 10.3 51.30 1.62
4 to 8 years 552 75.0 50.49 0.56
>8 years 108 14.7 49.72 1.17
Occupation* 0.04
Housewife 385 51.7 51.38 0.69
Others 359 48.3 49.34 0.67
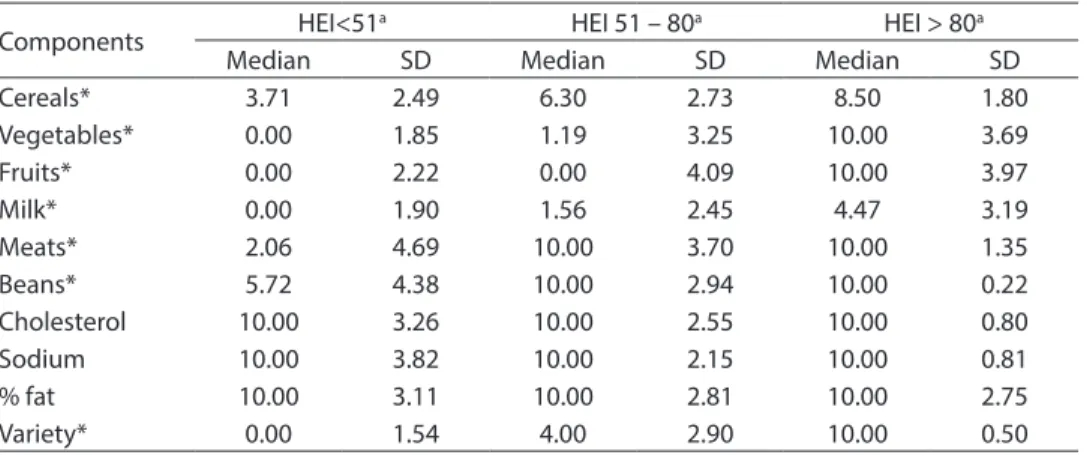
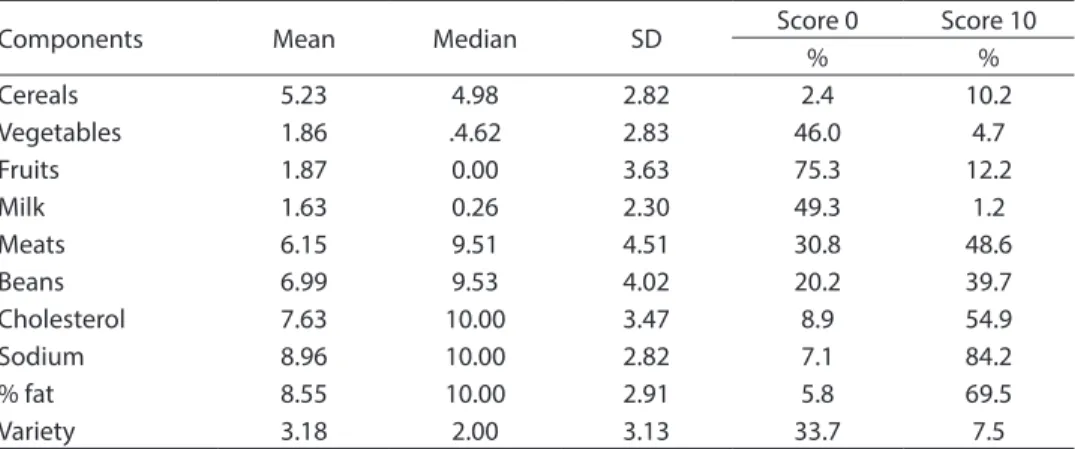
component of the HEI (Table 3) shows a gradual increase in all food groups, accor-ding to the three categories of diet quality classification. There were no statistically sig-nificant differences for cholesterol, sodium and percentage of fat. Table 4 shows that the consumption of fruits and dairy products was very low. The same applied to the va-riety of the diet. The median consumption of meats and beans was high (> 8 points), although two thirds of the population did not consume any servings of fruits per day, 46% did not consume vegetables, and 43.9% did not consume milk and dairy products.
Discussion
The present study observed the diet
quality of the population benefited by the Bolsa-Família program in the city of Curitiba. This quality was shown with the HEI, an instrument that categorizes indi-viduals according to levels of consumption of food groups.
The population studied was primarily comprised of women and young adults with up to eight years of education. This charac-terization is similar to that described in the
IBASE’s summarized document about
Bolsa-Família program beneficiaries, which shows that the majority of them are women (94%), aged between 15 and 49 years, of mixed eth-nicity (black and white), and with a primary school level of education (IBASE 2008).
The mean HEI was 51.0 points, indi-cating a diet that requires adjustments, as
Table 2 – Energy, total fat, saturated fat and cholesterol means intake according to Health Eating Index categories of adults of Bolsa Familia Program in Curitiba. Curitiba, 2006-2007.
Tabela 2 - Consumo médio de energia, gordura total, gordura saturada e colesterol segundo categorias do Índice de Qualidade da Dieta de adultos beneiciários do Programa Bolsa-Família em Curitiba. Curitiba, 2006-2007.
HEI score N Energy (kcal)
Total fat (%)
Saturated fat (%)
Cholesterol (mg)
< 51 395 1,256.75 32.81 16.62 242.00
51 -80 341 1,527.43 27.51 14.43 199.70
> 80 11 2,083.06 25.54 15.93 147.34
Table 3 – Median values of Diet Quality Index component scores in adult population of Bolsa Família Program in Curitiba. Curitiba, 2006-2007.
Tabela 3 – Valores medianos de escores dos componentes do IQD, segundo a classiicação da qualidade da dieta em população adulta beneiciária do programa bolsa família no Município de Curitiba. Curitiba, 2006-2007.
Components HEI<51
a HEI 51 – 80a HEI > 80a
Median SD Median SD Median SD
Cereals* 3.71 2.49 6.30 2.73 8.50 1.80
Vegetables* 0.00 1.85 1.19 3.25 10.00 3.69
Fruits* 0.00 2.22 0.00 4.09 10.00 3.97
Milk* 0.00 1.90 1.56 2.45 4.47 3.19
Meats* 2.06 4.69 10.00 3.70 10.00 1.35
Beans* 5.72 4.38 10.00 2.94 10.00 0.22
Cholesterol 10.00 3.26 10.00 2.55 10.00 0.80
Sodium 10.00 3.82 10.00 2.15 10.00 0.81
% fat 10.00 3.11 10.00 2.81 10.00 2.75
Variety* 0.00 1.54 4.00 2.90 10.00 0.50
observed by Morimoto et al. (2008)21, in a
study conducted in an adult population of cities situated in the metropolitan area of São Paulo, whose mean HEI was 60.42 points.
A study conducted with a representative sample of the American population, known
as the 3rd National Health and Nutrition
Examination Survey (NHANES III), showed
a mean HEI of 63.4 points20. While
conduc-ting the study known as Behavioral Risk Factor Surveillance System (BRFSS), Rafferty et al (2002)21 used a modified version of the
HEI and obtained a mean of 55.7 points for individuals aged more than 18 years. Champagne et al (2007)22 analyzed the diet
quality of a population experiencing food insecurity and found a HEI of 59.14 points for this population, revealing that dietary habits need to be changed, regardless of the population in which diet quality is assessed. Level of education and occupation were the variables that showed statistically signi-ficant differences in the mean HEI.
Table 2 shows that, the better the diet quality, the higher the energy consumption and the lower the percentage of total fat and cholesterol.
Hoddinott and Skoufias (2003)23
conduc-ted a longitudinal study that assessed the impact of Progresa, a cash transfer program
developed in Mexico, and reported that, in terms of food consumption, there was an increase in the number of calories and nutrients of beneficiary families with the increase in the acquisition of vegetables and animal-based foods.
The results of the present study corro-borate those found by Bhattacharya et al
(2004)24, who showed that poorer
individu-als tend to have lower HEI scores, although this does not necessarily mean insufficient energy consumption, but rather inadequate food choices. The population studied is cha-racterized as poor or very poor and the great majority of them have a diet categorized as requiring adjustments. However, the mean energy consumption does not indicate an insufficient number of calories for the intermediate and adequate diet groups determined with the HEI.
While assessing the dietary changes that occurred with the introduction of the PBF in a sample of 5,000 households in Brazil,
Lignani et al (2011)25 showed an increase
in the amount and variety of foods con-sumed and concluded that the program increased the families’ access to food and purchasing power. Nevertheless, families most frequently chose a high-energy and low-nutrient diet.
Nigenda and Gonzáles-Robledo (2005)26
Table 4 – Descriptive statistics to Diet Quality Index components and porcentual of maximum and minimum score to individuals. Curitiba, 2006-2007.
Tabela 4 – Estatística Descritiva para os principais componentes de classiicação do Índice de
Qualidade da Dieta e percentual de indivíduos que obtiveram pontuação mínima ou máxima. Curitiba, 2006-2007.
Components Mean Median SD Score 0 Score 10
% %
Cereals 5.23 4.98 2.82 2.4 10.2
Vegetables 1.86 .4.62 2.83 46.0 4.7
Fruits 1.87 0.00 3.63 75.3 12.2
Milk 1.63 0.26 2.30 49.3 1.2
Meats 6.15 9.51 4.51 30.8 48.6
Beans 6.99 9.53 4.02 20.2 39.7
Cholesterol 7.63 10.00 3.47 8.9 54.9
Sodium 8.96 10.00 2.82 7.1 84.2
% fat 8.55 10.00 2.91 5.8 69.5
analyzed the impact of Latin-American cash transfer programs and showed that the Social Protection Network of Nicaragua revealed an improvement in the quality of foods consumed by beneficiary families. Among those who were very poor, changes were more important in terms of the foods consumed.
Consumption of certain food groups was low, regardless of the diet quality classifica-tion (Table 2). Nearly 2/3 of the populaclassifica-tion did not consume fruits and 46% did not consume vegetables, corroborating Jaime and Monteiro’s (2005)27 analyses of a study
conducted in Brazil, which identified a daily consumption of fruits lower than 30% in the Brazilian population. The median score of consumption of vegetables was low (4.62 points), similar to what was found by Morimoto et al (2008)10.
Lock et al (2005)28 estimated the
morbi--mortality attributed to a low consumption of fruits and vegetables and showed that, among adults, this consumption is lower in the majority of Latin American countries than in Africa and that 2.6 million deaths could have been prevented worldwide, of which 31% were due to cardiovascular di-seases, if the population had followed the dietary recommendations.
According to data on income in mini-mum wages from the last Household Budget Survey (HBS), the population eligible for cash transfers spends 0.5% of their budget on fruits and vegetables6. Low consumption
of dairy products should be taken into con-sideration, as nearly 50% of the population achieved a score of zero for consumption of milk and derivatives, showing that there was no daily consumption of this group.
Studies conducted in the United States and Brazil showed an intermediate con-sumption (between five and seven points) of milk and derivatives in the populations studied11,21,29. Morimoto et al (2008)10
as-sessed the diet of the population living in the metropolitan area of São Paulo and ob-served a low score, similarly to the present
study, although only 25% of the population studied achieved a score of zero for these foods. Panigassi et al (2008)7 reported that
families experiencing social insecurity con-sumed less milk and derivatives, vegetables and fruits than those who were not in this situation.
Levy-Costa et al (2005)30, whose results
disagree with those found in the present study, observed that the Southern region of Brazil stands out because it shows a greater relative contribution of these foods to household food availability. In addition, this study revealed that the consumption of milk and derivatives has been increasing with time, although individuals earning up to half a minimum wage per month showed a relative contribution of milk and deriva-tives in the last HBS that represented 3.3% of the total energy consumption.
The present study had certain limi-tations. One of them was the use of the 24-hour food recall to assess diet quality. Basiotis et al (2002)31 reported that the scores
calculated according to only one day of food recall are lower than those calculated according to three days, although this dif-ference is not significant. Other population studies on diet quality assessment also used only one food recall(9,10,26.27).
The present study had a cross-sectional design, which means that consumption prior to cash transfers was not observed. Instead, current consumption was charac-terized to assess the dietary consumption of beneficiary families.
In conclusion, this study revealed im-portant information about the need to work with this population using nutrition
educa-tion programs. The Bolsa-Família program
References
1. Uchimura KY, Bosi MLM. Programas de comercialização de alimentos: uma análise das modalidades de
intervenção em interface com a cidadania. Rev Nutr Campinas 2003; 16(4): 387-97.
2. BRASIL. Ministério do Desenvolvimento Social e Combate à Fome. Programa Bolsa-Família. 2008. Disponível em: http://www.mds.gov.br. [Acessado em 23 de outubro de 2008]
3. Marques RM, Mendes A. Servindo a dois senhores: as políticas sociais no governo Lula. Rev Katal 2007; 10(1): 15-23.
4. Attanasio O e Mesnard A. The impact of a Conditional Cash Transfer Programme on Consumption in Colombia. Fiscal Studies 2006; 27(4): 421-42.
5. Instituto Brasileiro de Análises Sociais e econômicas (IBASE). Repercussões do programa bolsa família na segurança alimentar e nutricional das famílias beneficiadas. Documento Síntese. 2008.
6. Instituto Brasileiro de Geografia e Estatística – IBGE. Pesquisas de Orçamento Familiar (POF): 2008-2009.
Avaliação Nutricional da disponibilidade domiciliar de alimentos no Brasil. Rio de Janeiro; 2010.
7. Panigassi G, Segall-Correa AM, Marin-Leon L et al. Insegurança alimentar intrafamiliar e perfil de consumo de alimentos. Rev Nutr 2008, 21(S): 135-44.
8. Lignani JB e Salles-Costa R. Participação do Programa Bolsa-Família nas modificações do consumo alimentar de famílias beneficiadas pelo programa. Disponível em: http://www.ipc-undp.org/publications/mds/28P.pdf. [Acessado em 18 de janeiro de 2010]
9. Fisberg RM, Marchoni DML, Slater B, Martini LA.
Inquéritos Alimentares: Métodos e bases científicos. Ed Atheneu: São Paulo; 2005.
10. Kant AK. Indexes of overall diet quality: a review. J Am Diet Assoc 1996; 96: 785-91.
11. Fisberg RM, Slater B, Barros RR, Lima FD, Carandina L, Barros MBA et al. Índice de qualidade da dieta IQD: avaliação e aplicabilidade. Rev Nutr 2004; 17(4): 301-8.
12. IPPUC. Instituto de Pesquisa e Planejamento Urbano de Curitiba. Área, população e densidade demográfica segundo bairros e regionais de Curitiba 2000-2007. Disponível em: http://ippucnet.ippuc. org.br/Bancodedados/Curitibaemdados/anexos/ ÁreapopulaçãoDensidadeDemográficaSegundo BairrosRegionaisdeCuritiba.pdf. [Acessado em 28 de novembro de 2007]
13. Morimoto JM, Latorre MRDO, Slater B et al. Dietary Quality and associated factors among adults living in the state of São Paulo, Brazil. J Am Diet Assoc 2006; 106: 2067-72.
14. Zabotto CB. Registro fotográfico para inquéritos dietéticos: utensílios e porções. Campinas, Goiânia: UNICAMP, NEPA; 1996.
15. Pinheiro ABV, Lacerda EMA, Benzecry EH, Gomes MCS, Costa VM. Tabela para avaliação de consumo alimentar em medidas caseiras. 4a Ed. São Paulo: Editora Atheneu; 2000.
16. Phillippi ST, Szarfarc SC, Latterza AR. Virtual Nutri -Sistema de Análise Nutricional [programa de computador]. Versão 1.0. São Paulo; 1996.
17. Fisberg RM, Villar BS. Manual de Receitas e Medidas Caseiras para Cálculo de Inquéritos Alimentares: manual elaborado para auxiliar o processamento de inquéritos alimentares. São Paulo: Signus Ed.; 2002.
18. Willett WC. Nutritional Epidemiology. 2a ed. New York: Oxford University. 1998.
19. Kennedy ET, Ohls J, Carlson S, Fleming K. The Healthy Eating Index: design and applications. J Am Diet Assoc
1995; 95: 1103-8.
20. Bowman AS, Lino M, Gerrior AS, Basiotis PP. The Healthy Eating Index: 1994-1996. U.S. Department of Agriculture, Center for Nutrition Policy and Promotion;1998.
21. Rafferty AP, Anderson JV, McGee HB, Miller CE. A Healthy Diet Indicator: quantifying compliance with the dietary guidelines using the BRFSS. Prev Med 2002; 35: 9-15.
22. Champagne CM, Casey PH, Connell CL et al. Poverty and Food intake in rural America: Diet Quality is lower in food insecure adults in the Mississipi Delta. J Am Diet Assoc 2007; 107: 1886-94.
23. Hoddinott,J, Skoufias E. The impact of Progress on food consumption. FCND discussion papers 150. Washington D.C.: International Food Policy Research Institute (IFPRI); 2003.
24. Bhattacharya J, Currie J, Haider S. Poverty, food insecurity, and nutritional outcomes in children and adults. J Health Econ 2004; 23(4): 839-62.
25. Lignani J de B, Sichieri R, Burlandy L, Salles-Costa R. Changes in food consumption among the Programa Bolsa Família participant families in Brazil. Public Health Nutrition 2011; 14(5):785-92.
26. Nigenda G, Gonzáles-Robledo LM. Lessons offered by Latin American cash transfer programmes, Mexico’s Oportunidades and Nicaragua’s SPN. Implications for African countries. London: DFID Health Systems Resource Centre; 2005.
27. Jaime PC, Monteiro CA. Consumo de frutas e hortaliças na população adulta brasileira, 2003. Cad Saúde Pública
28. Locki K, Pomerleau J, CauserL et al. The global burden of disease attributable to low consumption of fruit and vegetables: implications for the global strategy on diet.
Bull World Health Organ 2005; 83(2): 100-8.
29. Fisberg RM, Morimoto JM, Slater B, et al. Dietary Quality and Associated Factors among Adults Living in the State of São Paulo, Brazil. J Am Diet Assoc 2006; 106: 2067-72.
30. Levy-Costa RB, Sichieri R, Pontes NS, Monteiro CA. Disponibilidade domiciliar de alimentos no Brasil: distribuição e evolução (1974-2003). Rev Saúde Pública
2005: 39(4): 530-40.
31. Basiotis PP, Carlson A, Gerrior SA, Juan WY, Lino M. The Healthy Eating Index: 1999-2000. U.S. Department of Agriculture, Center for Nutrition Policy and Promotion; 2002.