Ten years of HIV-AIDS epidemic
in more than 60 years in Federal
District – Brazil
Dez anos de epidemia do HIV-AIDS
em maiores de 60 anos no Distrito
Federal – Brasil
Maria Liz Cunha de Oliveira
I,IILeidijany Costa Paz
IGislane Ferreira de Melo
III Federal District Department of Health, Brazil.
II Catholic University of Brasília, Brazil.
Corresponding author: Maria Liz Cunha de Oliveira. SQSW 305 bloco B apt. 306, Brasília, DF, BRAZIL, 70673-433. E-mail: [email protected]
Abstract
Introduction: The progressive increase in number of HIV/AIDS cases in old age brings the necessity of studies about the specificities of this phenomenon by region.
Objective: To identify the epidemiology in AIDS cases diagnosed in Distrito Federal - Brasil, in individuals aged > 60 years old.
Methods: We conducted a time serie study with secondary data from SINAN/AIDS for the period January 1999 to December 2009.
Results: In this period, 4,258 new cases of AIDS were of whom 89 (2.0%) are elderly. Although a small percentage, the annual growth was continuous. The most frequent exposure category was heterosexual, the age group most affected was 60 and 69 years, with 71 (79.8%) cases; the propor-tion of cases man/woman has changed over the years, in 1999 was 1:1 and in 2006, 0,7:1. Conclusion: The HIV/AIDS epidemic among the elderly can be seen stable on the Distrito Federal.
Resumo
Introdução:O aumento progressivo no nú-mero de casos de HIV/AIDS em idosos traz a necessidade de estudos sobre as especifici-dades deste fenômeno por região. Objetivo:
Descrever as características dos casos de AIDS em indivíduos com idade > 60 anos ou mais no Distrito Federal – Brasil. Método: Realizou-se um estudo de série temporal, com dados secundários do SINAN/AIDS, no período de Janeiro de 1999 a dezembro 2009. Resultado: Neste período foram diagnosticados 4258 novos casos de AIDS; destes, 89 (2,0%) são idosos. Embora seja uma porcentagem pequena, o crescimento anual foi contínuo. A categoria de exposição mais frequente foi a de heterossexual, a faixa etária mais acometida foi de 60 a 69 anos com 71 (79,8%) casos, e a proporção de ca-sos homem/mulher vem mudando ao longo dos anos, sendo que em 1999 era de 1:1 e, em 2006, de 0,7:1. Conclusões: A epidemia de HIV/AIDS pode ser considerada estável entre os idosos no Distrito Federal.
Palavras-chave: Síndrome da Imuno-deficiência Adquirida. AIDS. Idoso. Epide-miologia. Doenças sexualmente transmis-síveis. DST.
Introduction
In Brazil, there has been a systematic and steady rhythm of growth in the elderly population. In 2009, this country had a population of nearly 21 million individuals aged 60 years and more. Between 1999 and 2009, the number of elderly individuals in the general population increased from 9.1% to11.3%1.
With a fertility rate lower than the population replacement level, combined with other factors such as technological advances, especially in the area of health, the elderly are currently a significant por-tion of Brazilian society. It is estimated that, in the next 20 years, the number of elderly Brazilians will surpass 30 million, represent-ing 13% of the population1.
Population aging causes elderly health to be the center of attention. According to the World Health Organization (WHO), “el-derly individuals” are those aged between 60 and 100 years or more, living in devel-oping countries2. This age group includes a
period of more than 40 years, comprising, apart from very different experiences, in-dividuals who have their full physical and mental capacity and others in situations of dependence3.
A study on “Sexual Health and the New Elderly”4 draws attention to the
socio-cultural change in behavior towards sexu-ality and aging, and it has challenged the traditional stereotype of “asexual old age”, as the sexual function began to be viewed as an essential component to achieve suc-cessful aging in general. The key factors that consolidate this change include the recent pharmaceutical industry advances, which enable the extension of active sexual life, in addition to changes in sexual attitudes and behavior in older individuals associated with the demystification of sex, thus caus-ing them to be more vulnerable to sexually transmitted diseases (STD). Among these is the human immunodeficiency virus (HIV), the agent of the acquired immunodeficiency syndrome (AIDS)5.
between 1945 and 1965, now known as the “third age”, brings new behavior about what it means to “be old”, particularly with regard to sexuality. As an example, divorce and re-marriage rates are continually increas-ing in older ages6,7; there is a growing trend
towards sexual life without cohabitation in the relationships among older individuals. Moreover, non-heterosexual lifestyles are more accepted legally and socially – older male and female homosexuals are more open towards their sexual identity6. A new
industry is developing around this elderly group, providing dating services for older individuals and counseling on how to form intimate relationships in old age8. These
changes in values, attitudes and behavior are even more evident when one observes that the rates of sexually transmitted dis-eases (STD), including HIV, are rapidly in-creasing among individuals aged more than 50 years6. In Brazil, in the 60-year-and-older
age group, the HIV incidence rate was 2.8 in 1998, increasing to 5.1 in 20109.
Therefore, due to the trend found in the literature, the present study aimed to iden-tify the general characteristics of AIDS in individuals aged more than 60 years living in the Federal District (FD), Midwestern Brazil.
Methods
A retrospective, descriptive time-series study was conducted to analyze the AIDS trend in the elderly, between 1999 and 2009. This 10-year period was selected because it shows a slow yet steady aging process in the Brazilian population10.
This study was performed in the Federal District, Midwestern Brazil, which had a resident population of 2,606,885 inhabi-tants in 2010. In this same year, the resident population aged 60 years and older totaled 197,613 inhabitants, of which 42.98% were men and 57.01% were women (data on the resident population collected from the IBGE database9,11).
Elderly individuals were categorized by age group into 10-year intervals: 60-69 years, 70-79 years and 80 years and more. These
three age groups are characterized as young elderly, old elderly and oldest old, respecti-vely12, referring to the age groups available
in the Sistema de Informações de Agravos de Notificação (SINAN – Information System for Notifiable Diseases). The SINAN is an information system from the Brazilian Ministry of Health, implemented in the entire country to monitor mandatory noti-fication health problems.
The study population was comprised of all AIDS cases recorded in the SINAN betwe-en 1999 and 2009, occurring in individuals aged 60 years and older, living in the Federal District, Midwestern Brazil. Researchers decided to analyze the data available until 2010 to prevent notification delay errors, as this was the year when the definite data on the Federal District were found. These data were obtained from the SINAN in the Federal District Department of Health.
The AIDS notification and investigation files, established by the Ministry of Health and adopted by the Brazilian Sistema Único de Saúde (SUS – Unified Health System), are the instrument that feeds the database. These files are completed by health pro-fessionals and subsequently input into the SINAN.
Data processing and mapping were per-formed using the TabWin software (Tab for Windows), version 3.6, a free software pro-gram designed by DATASUS (Unified Health System Data Processing Department), whi-ch enables the tabulation of different types of information in the same environment, facilitating the construction of indicators.
The variables approached in the present study were as follows: sex, age, category of exposure and year of diagnosis.
Reports with distributions of frequen-cies of AIDS cases were developed for data analysis. The ratio between the number of male/female cases was calculated with the purpose of assessing the change in this ratio throughout time. Absolute and relative frequencies and incidence were calculated with the Excel program, version 7.0.
adjusted by the direct method1. Adjustment
for age using the direct method is performed with a single standard population, which functions as a common group of weights to calculate weighted rates (adjusted or stan-dardized). The standard population used was that of the Federal District in 20101,13.
The rate adjusted for age was calculated using the following formula:
The incidence coefficient is used to measure how a disease, in this case AIDS, behaves in a specific population, in this case all individuals aged more than 60 ye-ars living in the Federal District. Based on this coefficient, the importance of AIDS in this population can be analyzed. It should be noted that the incidence rate differs from the absolute number of cases, as it is always calculated according to the specific population under study; consequently, it is through this incidence that one can have an accurate view of how AIDS is behaving in the population aged more than 60 years.
Researchers chose to calculate the inci-dence in the general population aged less than 60 years and in the specific population aged more than 60 years to make a better analysis of the problem.
Ethical aspects
As the database is a public domain, the present research project did not have to be submitted to a Research Ethics Committee.
RESULTS
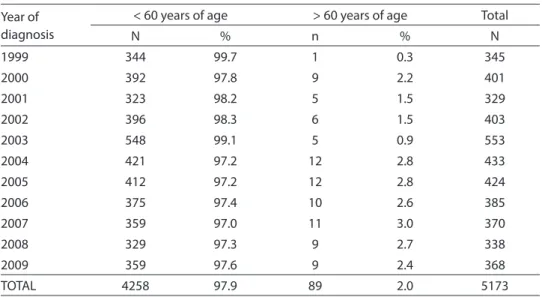
Data on the total number of AIDS cases diagnosed between 1999 and 2009 resulted in 4,258 new cases, of which 89 occurred among the elderly, totaling 2.0% of the total number of cases. Although being a small percentage, the annual growth was steady, subsequently decreasing in 2008 and 2009 (Table 1).
The analysis of the incidence rates between 1999 and 2009 in the population aged more than 60 years living in the Federal District shows that this rate has varied since 1999, even with the increase in
Tabela 1 - Distribuição dos casos de AIDS segundo ano de diagnóstico e faixa etária. Distrito Federal, 1999-2009.
Table 1 - Distribution of AIDS cases in the second year of diagnosis and age group. Federal District, 1999-2009.
Year of diagnosis
< 60 years of age > 60 years of age Total
N % n % N
1999 344 99.7 1 0.3 345
2000 392 97.8 9 2.2 401
2001 323 98.2 5 1.5 329
2002 396 98.3 6 1.5 403
2003 548 99.1 5 0.9 553
2004 421 97.2 12 2.8 433
2005 412 97.2 12 2.8 424
2006 375 97.4 10 2.6 385
2007 359 97.0 11 3.0 370
2008 329 97.3 9 2.7 338
2009 359 97.6 9 2.4 368
TOTAL 4258 97.9 89 2.0 5173
Source/Fonte: SINAN-GDST-AIDS/DIVEP/SVS/SES.
* Temporary and partial data input until January 2nd, 2012, and obtained from notification/case investigation files.
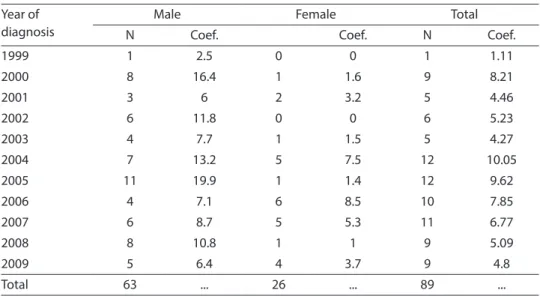
the population (Table 2), and the highest incidences in both sexes occurred in 2000 and 2005. As the numbers are small, the coefficient is greatly impacted, even with a slight increase in the absolute number. Additionally, this coefficient can randomly vary from year to year and, for this reason, researchers could not observe whether there was actually an increasing trend of this epi-demic in the Federal District.
With regard to AIDS cases according to sex ratio (M:F) and year of diagnosis, 2006 stands out as this was when there was an in-version in the ratio (0.7:1), resulting in more cases among women than men in this age group. This indicator points to the growth in the number of elderly women who became infected, although this information has va-ried greatly, probably due to small numbers.
The ratio in individuals aged less than 60 years has remained constant, contrasting with the same indicator among the elderly (Table 3).
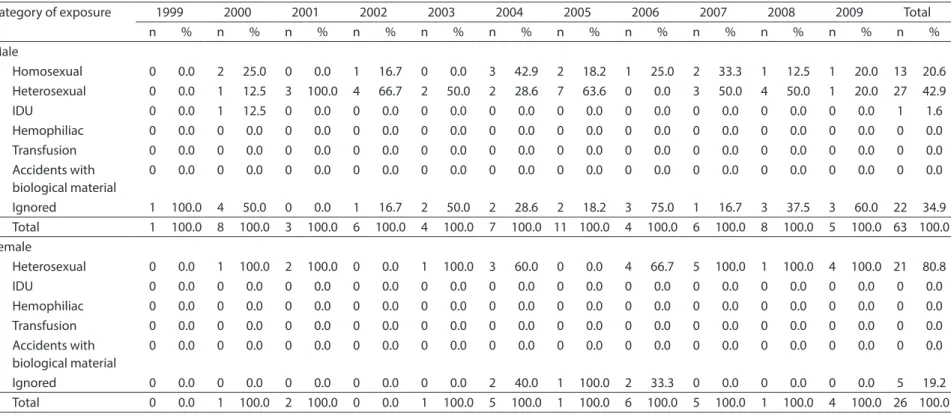
With regard to the category of exposure and year of diagnosis by sex, the largest number of cases in men, 27 (42.9%), and wo-men, 21 (80.8%), resulted from heterosexual
sexual relations. It should be emphasized that, in 22 (34.9%) reports among men, data on category of exposure were incomplete and considered to be ignored. In contrast, only five women (19.2%) had incomplete data (Table 4).
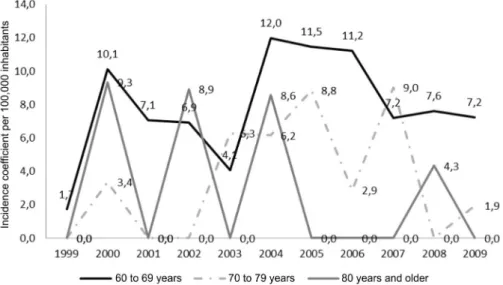
With regard to age group, those aged between 60 and 69 years were the ones most affected. In 1999, among individuals in this age group, the incidence coefficient was 1.7 cases per 100,000 inhabitants; in the following year, this incidence rose to 10.1 cases per 100,000 inhabitants, subsequently varying around this value throughout the time series analyzed (Figure 1).
Discussion
The analysis of the magnitude of AIDS revealed that, in this specific population, this disease has great epidemiological importance, not only due to the absolute numbers, but also due to the incidence rates from year to year.
Data collected from the Federal District between 1999 and 2009 differ from the ove-rall data for Brazil, taking into consideration
Tabela 2 – Casos de AIDS em maiores de 60 anos de idade (número e coeiciente por 100.000 hab.) segundo sexo e ano de diagnóstico. Distrito Federal, 1999 a 2009.
Table 2 - Cases of AIDS in over 60 years of age (by number and coeicient 100.000hab.) by sex and year of diagnosis. Federal District from 1999 to 2009.
Year of diagnosis
Male Female Total
N Coef. Coef. N Coef.
1999 1 2.5 0 0 1 1.11
2000 8 16.4 1 1.6 9 8.21
2001 3 6 2 3.2 5 4.46
2002 6 11.8 0 0 6 5.23
2003 4 7.7 1 1.5 5 4.27
2004 7 13.2 5 7.5 12 10.05
2005 11 19.9 1 1.4 12 9.62
2006 4 7.1 6 8.5 10 7.85
2007 6 8.7 5 5.3 11 6.77
2008 8 10.8 1 1 9 5.09
2009 5 6.4 4 3.7 9 4.8
Total 63 ... 26 ... 89 ...
Source/Fonte: SINAN-GDST-AIDS/DIVEP/SVS/SES.
* Temporary and partial data input until January 2nd, 2012, and obtained from notification/case investigation files.
proportional differences10. The results show
that, among elderly individuals, the profile of the population most affected by the epidemic is that of men aged from 60 to 69 years, i.e. the young elderly. It could be inferred that at least a portion of the popula-tion studied must have been infected in the 50-to-60-year age group, as it takes between five and ten years to go from transmission
to the seropositive status, when one is con-sidered to be an AIDS case.
Among individuals aged more than 60 years living in the Federal District, even with the increase in the population, the inciden-ce rate has varied and the highest rates in both sexes occurred in 2000 and 2005.
These data show that, in the Federal District, AIDS cases are not in agreement
Table 3 – Cases of AIDS second sex ratio (M: F) and age and year of diagnosis. Federal District, 1999-2009.
Tabela 3 – Casos de AIDS segundo razão de sexo (M:F) e faixa etária e ano de diagnóstico. Distrito Federal, 1999-2009.
Year of diagnosis Sex ratio
< 60 years of age > 60 years of age
1999 2.2:1 1.0:1
2000 2.0:1 8.0:1
2001 2.0:1 2.0:1
2002 2.0:1 7.0:1
2003 2.0:1 4.0:1
2004 2.1:1 1.4:1
2005 2.2:1 11.0:1
2006 1.8:1 0.7:1
2007 2.5:1 1.2:1
2008 2.6:1 8.0:1
2009 3.1:1 1.3:1
Source/Fonte: SINAN-GDST-AIDS/DIVEP/SVS/SES.
* Temporary and partial data input until January 2nd, 2012, and obtained from notification/case investigation files.
*Dados provisórios e parciais digitados até 02/01/2012 e obtidos das fichas de notificação/investigação de casos.
Figure 1 – Cases of AIDS in over 60 years of age (number) by age group and year of diagnosis. Federal District from 1999 to 2009.
36
R
e
v Br
as Epidemiol
2013; 16(1): 30-9
Ten y
ears of HIV-AIDS epidemic in mor
e than 60 y
ears in F
eder
al D
istr
ic
t – B
razil
O
liv
eir
a,
M.L.C.
et al.
Table 4 - Distribution of the number of AIDS cases in persons older than 60 years (number and proportion) by exposure category and year of diagnosis by sex. Federal District, 1999-2009.
Tabela 4 – Distribuição do número de casos de AIDS em maiores de 60 anos (número e proporção) segundo categoria de exposição e ano de diagnóstico por sexo. Distrito Federal, 1999-2009.
Category of exposure 1999 2000 2001 2002 2003 2004 2005 2006 2007 2008 2009 Total
n % n % n % n % n % n % n % n % n % n % n % n %
Male
Homosexual 0 0.0 2 25.0 0 0.0 1 16.7 0 0.0 3 42.9 2 18.2 1 25.0 2 33.3 1 12.5 1 20.0 13 20.6
Heterosexual 0 0.0 1 12.5 3 100.0 4 66.7 2 50.0 2 28.6 7 63.6 0 0.0 3 50.0 4 50.0 1 20.0 27 42.9
IDU 0 0.0 1 12.5 0 0.0 0 0.0 0 0.0 0 0.0 0 0.0 0 0.0 0 0.0 0 0.0 0 0.0 1 1.6
Hemophiliac 0 0.0 0 0.0 0 0.0 0 0.0 0 0.0 0 0.0 0 0.0 0 0.0 0 0.0 0 0.0 0 0.0 0 0.0
Transfusion 0 0.0 0 0.0 0 0.0 0 0.0 0 0.0 0 0.0 0 0.0 0 0.0 0 0.0 0 0.0 0 0.0 0 0.0
Accidents with biological material
0 0.0 0 0.0 0 0.0 0 0.0 0 0.0 0 0.0 0 0.0 0 0.0 0 0.0 0 0.0 0 0.0 0 0.0
Ignored 1 100.0 4 50.0 0 0.0 1 16.7 2 50.0 2 28.6 2 18.2 3 75.0 1 16.7 3 37.5 3 60.0 22 34.9
Total 1 100.0 8 100.0 3 100.0 6 100.0 4 100.0 7 100.0 11 100.0 4 100.0 6 100.0 8 100.0 5 100.0 63 100.0 Female
Heterosexual 0 0.0 1 100.0 2 100.0 0 0.0 1 100.0 3 60.0 0 0.0 4 66.7 5 100.0 1 100.0 4 100.0 21 80.8
IDU 0 0.0 0 0.0 0 0.0 0 0.0 0 0.0 0 0.0 0 0.0 0 0.0 0 0.0 0 0.0 0 0.0 0 0.0
Hemophiliac 0 0.0 0 0.0 0 0.0 0 0.0 0 0.0 0 0.0 0 0.0 0 0.0 0 0.0 0 0.0 0 0.0 0 0.0
Transfusion 0 0.0 0 0.0 0 0.0 0 0.0 0 0.0 0 0.0 0 0.0 0 0.0 0 0.0 0 0.0 0 0.0 0 0.0
Accidents with biological material
0 0.0 0 0.0 0 0.0 0 0.0 0 0.0 0 0.0 0 0.0 0 0.0 0 0.0 0 0.0 0 0.0 0 0.0
Ignored 0 0.0 0 0.0 0 0.0 0 0.0 0 0.0 2 40.0 1 100.0 2 33.3 0 0.0 0 0.0 0 0.0 5 19.2
Total 0 0.0 1 100.0 2 100.0 0 0.0 1 100.0 5 100.0 1 100.0 6 100.0 5 100.0 1 100.0 4 100.0 26 100.0
Source/Fonte: SINAN-GDST-AIDS/DIVEP/SVS/SES.
with what occurs in Brazil as a whole, whe-re thewhe-re was a significant incwhe-rease in the number of cases between 2000 and 2009. According to a report from the Brazilian Ministry of Health, 744 cases were recorded in 2000 and 1,623 cases in 200914. However, if
the years from 1999 to 2003 are added, there were 26 cases, whereas from 2004 to 2008, there were 54 cases, which may point to an increase in this age group, something that could not observed from year to year as this is a small population.
In the Federal District, AIDS among the elderly brings a different perspective to the epidemic, especially when the 60-to-69-year age group is observed, although the inci-dence coefficient is lower when compared to other age groups (Figure 1).
Some of the characteristics of the epidemic in the general population are also found in the elderly, among which is heterosexualization, especially when asso-ciated with sexual transmission11,12,15. The
following stand out among the factors that could be contributing to this new epidemic profile: the increase in sexual activity in the elderly; the available technology to improve and prolong sexual performance; and the unwillingness to use condoms16,17. With
regard to the feminization of the epidemic, many elderly women feel embarrassed to ask their partner to use condoms, as this spoils spontaneity and puts the sexual re-lation at risk18.
With regard to categories of exposure, although at a low level, injecting drug use among older adults should be emphasized, as this group is rarely considered to be drug--dependent. Health professionals tend not to investigate drug use in this population, erroneously assuming that they are not susceptible to such behavior or, if they were in the past, this is not relevant now, at the moment of a consultation15.
Final Considerations
In conclusion, the HIV/AIDS epidemic can be considered as stable among the elderly living in the Federal District. This
situation could be disguised by the difficulty in diagnosing HIV in this population.
The present study identified several factors that must be looked into, promoting behavioral studies associated with HIV infection in the elderly. Thus, it will be pos-sible to monitor high-risk sexual behavior, aiming to intervene in the epidemic and, consequently, reduce morbi-mortality from AIDS in the third age.
Although the assessment of quality of data according to individual characteris-tics was not the object of analysis, in the distribution proportional to sex, lack of information about the form of HIV trans-mission was higher among male adults, indicating the difficulty in obtaining data on the epidemiological history of patients.
This lack of information is probably associated with the greater difficulty in classifying individuals into stigmatized categories, such as male homosexuals and injecting drug users.
Currently, mandatory notification is the main HIV/AIDS epidemiological sur-veillance tool in the Federal District and Brazil. However, it should be noted that this information is subject to errors resul-ting from typing and recording, in addition to possible underreporting in the SINAN database. These limitations are inherent in secondary data.
With regard to underreporting, it should be emphasized that: antiretroviral drugs are expensive, they are available at no cost in the SUS, and they are not sold privately in Brazil. This aspect contributes to a more accurate identification of AIDS cases in the Federal District, in addition to the district directive that establishes notification as one of the documents that must be shown by users when registering to receive antire-troviral drugs27.
section (personal ads) of all Federal District newspapers.
It is suggested that these actions should be maintained and that new prevention strategies should be implemented to raise
knowledge about the vulnerability of the population aged more than 60 years, in-corporating this into the daily operations of health services.
References
1. Instituto Brasileiro de Geografia e Estatística. Ibge. Síntese de Indicadores Sociais. Uma análise das condições de vida da população brasileira - 2010. Rio de Janeiro: IBGE; 2010. Disponível em: http://www.ibge. gov.br/home/estatistica/populacao/condicaodevida/ indicadoresminimos/sinteseindicsociais2010/default. shtm. [Acessado em 21 de maio de 2012]
2. Organização Mundial da Saúde; Envelhecimento ativo: uma política de saúde. Brasília. 2005. Disponível em: http://www.who.int/es/[Acessado em 20 de maio de 2012]
3. Groisman DA. Velhice entre o normal e o patológico. História, Ciências e Saúde – Manguinhos jan-abr 2002; 9: 1 e 61-78. Disponível em: http://www.scielo.br/pdf/ hcsm/ v9n1/a04v9n1.pdf. [Acessado em 21 de maio de 2012]
4. Gott M. Sexual health and the new ageing. Age Ageing 2006; 35(2): 106-7.
5. Aquino EML. Saúde do homem: uma nova etapa da medicalização da sexualidade? Ciênc Saúde Colet 2005; 10(1): 19-22.
6. Potts A, Gavey N, Grace, V, Vares T. The downside of Viagra: women’s experiences and concerns about Viagra use by men. Sociology of Health & Illness 2003; 25(7): 697-719.
7. Zornitta M. Os novos idosos com AIDS e desigualdade à luz da bioética [dissertação de mestrado]. Rio de Janeiro: Escola Nacional de Saúde Pública Sergio Arouca; 2008.
8. Munk RJ, Jenison SA. Older people and HIV. New México: AIDS Education and Trainig Center. Disponível em: www.AIDSinfonet.org. [Acessado em 21 de maio de 2012]
9. Brasil. Ministério da Saúde. Secretária de Vigilância Saúde. Programa Nacional de DST e AIDS. Boletim Epidemiológico - AIDS e DST – Versão Final – Ano VII. nº 1 - 27ª a 52ª semanas epidemiológicas - julho a dezembro de 2009 e 01ª a 26ª semanas epidemiológicas - janeiro a junho de 2010. Disponível em: http:// www.AIDS.gov.br/sites/default/files/ anexos/ publicacao/2010/45974/vers_o_final_15923.pdf. [Acessado em 21 de maio de 2012]
10. Emlet, C A. Lessons Learned. Moving forward. Tacoma: University of Washington; 2005.
11. IBGE. Censo demográfico. Disponível em: http://www.
ibge.gov.br. [Acessado em 2 de janeiro de 2012]
12. Veras RP. País jovem com cabelos brancos: a saúde do idoso no Brasil. Rio de Janeiro: Relume Dumará; 1994.
13. Szklo M, Nieto FJ. Epidemiology beyond the basics. Gaithersburg: Aspen Publishers; 2000.
14. Ribeiro AM, Oliveira MLC, Melo GF. A AIDS de cabelos brancos: ocorrência de AIDS em idosos no Brasil. (no prelo)
15. Santos NJS, Tayra A, Silva SR, Buchalla CM, Laurenti R. A AIDS no Estado de São Paulo: As mudanças no perfil da epidemia e perspectivas da vigilância epidemiológica. Rev Bras Epidemiol 2002; 5(3): 286-310.
16. Melo MR, Gorzoni M, Melo KC, Melo E. Síndrome da imunodeficiência adquirida no idoso. Rev Diag Trat 2002; 7: 13-7.
17. Savasta AM. HIV: Associated Transmission Risks in Older Adults – An Integrative Review of the Literature. J Assoc Nurses Aids Care 2004; 12 (1): 50-9.
18. Brasileiro M, Freitas MIF. Representações sociais sobre AIDS de pessoas acima de 50 anos de idade, infectadas pelo HIV. Rev Latino-Am Enfermagem 2006; 14(5): 789-95.
19. UNAIDS. AIDS epidemic update.2012. Disponível em:
http://www.unAIDS.org. [Acessado em 1 de julho de 2009].
20. Distrito Federal. Secretaria de Estado de Saúde. Subsecretaria de Vigilância em Saúde. Diretoria de Vigilância Epidemiológica. Gerência de DST/AIDS e HV.
Boletim Epidemiológico de DST/AIDS do DistritoFederal.
Brasília, DF. Número 1/2011.
21. IBGE. Censo demográfico. Disponível em: http://www. ibge.gov.br. [Acessado em 2 de janeiro de 2012]
22. Vasconcelos EMR, Alves FAP, Moura LML. Perfil epidemiológico dos clientes HIV/AIDS na terceira idade. Rev Bras Enferm 2001; 54(3): 435-45.
23. Toledo LSG, Maciel ELN, Rodrigues LCM, Tristão-Sá R, Fregona G. Características e tendência da AIDS entre idosos no Estado do Espírito Santo. Rev Soc Bras Med Trop 2010; 43(3): 264-7.
25. Godoy VS, Ferreira MD, Silva EC, Gir E, Canini SRMS. O perfil epidemiológico da AIDS em idosos utilizando sistemas de informações em saúde do DATASUS: realidades e desafios. DST – J Bras Doenças Sex Transm 2008; 20(1): 7-11.
26. De Lorenzi DRS, Saciloto B. Frequência da atividade sexual em mulheres menopausadas. Rev Assoc Med Bras 2006; 52(4): 256-60.
27. Portaria nº. 37, de 23 de março de 2010. Estabelece os documentos que deverão ser fornecidos pelo médico assistente ao paciente para fins de cadastramento nas unidades de saúde dispensadoras de medicamentos antiretrovirais. Diário Oficial do Distrito Federal, 25 de março de 2010, Nº 58, p.10.