A Work Project, presented as part of the requirements for the Award of a Masters Degree in Finance from the Faculdade de Economia da Universidade Nova de Lisboa.
The effects Ishares IBovespa Index Fund creation on
the liquidity of underlying stocks
João Miguel dos Santos Silva, 361
A Project carried out on the Master in Finance, with the supervision of: Melissa Prado
2 ABSTRACT
I investigate the impact of Ishares Ibovespa Index Fund (BOVA) introduction on the liquidity of the underlying securities and the asymmetry of the liquidity effect depending on the BOVA component weight. My main finding is that there was no impact on liquidity of underlying components after the introduction of the exchange-traded fund and also that the absence of effect in liquid is symmetric for all the component securities. Additional, I find that BOVA has a low trading volume and liquidity over the 50 days of trading as compared with other ETF’s at the moment of inception. Being this the main reason for the absence of impact on the liquidity of components securities after BOVA inception.
Key words: Liquidity; Exchange-traded funds; Underlying Stocks
3 1. Motivation
The Exchange-traded funds (ETF’s) are one of the most useful financial innovations in the past decades, especially for the index traders. At the end of 2011, the global ETF industry
had 3,011 ETFs with 6,612 listings and assets of US$1,350.9 Bn from 155 providers on 42
exchanges around the world, according to the BlackRock report1.
ETF’s are an investment fund traded on assets that represent a basket of securities of a
particular index. This financial instrument allows investors to obtain portfolio diversification benefits at lower transaction costs as compared to trading a portfolio of underlying stocks.
The relative low price per share of ETF’s shares permit to trade indices easily, in small amounts, and at very low costs as compared to buying and holding a portfolio of the
component securities. These features are very attractive, specially, to the passive investors, which have less information. Moreover this financial instrument allows investors to join the
advantage of a closed-end and open-end mutual funds with much lower expense fee. And
also in ETF´s trading it is allowed to short-sell.
Thus, with the increasing importance of these financial instruments in the world it is
important to understand their impact on the market microstructure of underlying stocks.
What is the impact of introducing the ETF’s on the underlying stocks? How does the ETF’s creation affect the liquidity of underlying stocks? These are the questions frequently raised.
Another important matter is if the answers to this question vary if the scope of analysis is an
emerging market index tracker, in this case Brazil, where the microstructure of market is
different from the U.S. or European structure. For instance the asymmetry of information is higher and the transparency is lower in the Brazilian market, what contributes for a less
efficient market. Also the regulation and taxation are different in Brazil. Additionally
Brazilian Bovespa is a less diversified index compared to a diversified U.S. or European Index like the S&P 500 or the CAC 40, fact that have different implication for ETF. Finally,
4 the transaction volume and liquidity of ETFs that track the Ibovespa are low when compared to an U.S. or European ETF like the Diamonds, the QQQ or the Lyxor CAC 40, fact that may
also have a significant impact in the analysis.
The purpose of this paper is to study the impact of ETF’s inception on the underlying stocks. Particularly, the impact that basket security trading has on the liquidity of the markets for the
basket and the underlying securities. It is important for that purpose to measure the impact
and understand the role of asymmetry of information between investors, the arbitrage opportunities that arise from the introduction of this financial instrument and the dispersion
of believes caused by the increase of participants on the market on the liquidity of underlying
stocks. The common measures used for that purpose are the bid-ask spread, the amihud
illiquidity measure and the turnover.
To perform this analysis the ETF that I will study is IShares IBovespa, an index that tracks
the performance of the IBovespa index, the Brazilian stock exchange. I intend to approach
the subject from a different perspective, since most of the studies about the effect of ETF´s inception have as object of study European or US Stock exchange, as Richie and Madura
(2007), Hegde and McDermott (2004) and De Winne, Gresse and Platten (2009). Thus,
studying an emerging market may bring some new insights and conclusions to the theme.
The paper is organized as follows: section 2 presents a brief literature review; in section 3 I
expose the hypothesis; section 4 is for data analysis; section 5 presents a analysis of IShares
IBovespa, in section 6 I discuss the methodology; section 7 presents the results and finally in section 8 I display the conclusion.
2. Literature Review
There is no consensus, both in the asset management industry as in academia, about the
5 EDHEC-Risk Institute2 40% of the survey respondents observed an improved liquidity in the underlying market, but 39% did not, illustrating how the opinion about this matter diverges
among the specialists.
In the academic world, the previous literature conclusions about the effect of ETF’s inception are also divergent. On one hand, there exist studies that conclude that the liquidity on
underlying stocks increases after an ETF’s creation. Hegde and McDermott (2004) investigate the effect of Diamonds (DIA) index and the QQQ inception on the underlying index stocks liquidity, the Dow Jones Index Average 30 (DJIA 30) and NASDAQ 100 Index,
and found an improvement in liquidity over the first 50 days of the DIA trading. This
improvement was largely related to the decline in asymmetric information of trading in the
underlying stocks, which is consistent with the arbitrage hypothesis. According to this
hypothesis the introduction of financial instruments derived from existing securities reduces
markets incompleteness and increases the investment and arbitrage opportunities faced by
investors, promoting this way an improvement in liquidity and efficiency. Richie and Madura (2007) also tested the impact of the creation of the QQQ fund on the liquidity of the
component securities and the risk of the underlying securities and also conclude that the
liquidity of underlying stocks after ETF´s introduction increased. Furthermore, by using a decomposition of relative and absolute quoted spreads they found that the liquidity
improvement following the creation of the QQQ was more pronounced for less heavily
weighted stock, and that the component stocks experience a significant decline in systematic
risk when compared to the control sample, which experience no such decline. This conclusion are consistent with the Merton’s (1987) Investor Recognition Theory, which
argues that when the participation of investors in the market increase, the liquidity of a stock
will increase, and the dispersion of investor beliefs regarding the expected future payoffs will decrease.
6 On the other hand there are studies that did not find similar improvements. Subramanyam (1991) modeled the consequences of the introduction of a basket security for liquidity by
differentiate the population of traders as informed and uninformed. These traders can choose
to trade either in individual asset markets or in the assets index stock market. The uninformed traders or liquidity trader are the ones that doesn’t have any specific information but trades for exogenous reasons, making its investment decision based on perceived market movements rather than security’s fundaments. Contrary the informed traders use the extraneous information source to seek statistical arbitrage opportunities, making its decision
based on security fundaments and market information. At equilibrium, informed traders
preferably trade in the underlying stock market while liquidity traders go to the basket
market, where their losses to informed traders are usually lower. As a result of reduced liquidity trading in the component securities, adverse selection costs and spreads increase in
the underlying security markets. This effect is more pronounced among securities with
smaller weights in the basket than for heavily weighted securities. These conclusions are in line with the Adverse Selection Hypothesis. Also consistent with this theory, Kyle (1985)
argues, that the presence of informed traders with superior knowledge of the value of a stock
can impose adverse selection costs on liquidity traders and market makers. The adverse selection costs associated with index securities are likely to be significantly less than those
for the underlying securities because the pooling of the stocks greatly reduces the ability of
informed traders to profit from their stock-specific knowledge.
Van Ness, Van Ness, and Warr (2005) use matched samples to test the hypothesis that
uninformed traders prefer to invest in the Diamond ETF rather than in the individual stocks
constituting the index, concluding that after the Diamonds ETF inception the bid-ask spreads
of the DJIA 30 actually increased relative to the spreads of matching stocks, this could mean a decrease in liquidity, contrary to what Hegde and McDermott (2004) concluded in their
7 Summarily, in the literature there are divergent conclusions about the effect of an ETF’s introduction on the microstructure of underlying assets. On one hand there are studies, which support that the EFT’s introduction impacts positively the liquidity in individual stock, as
argued by arbitrage hypothesis and the Investor Recognition Theory. On the other hand there
is support for the Adverse Selection Hypothesis, as studies conclude that the introduction of
ETF’s reduces liquidity in component stocks, and increases the adverse selection costs and
spreads. The following sections will try to understand which of these conclusions remain or not for the Brazilian market.
3. Hypothesis
This study seeks to answers two questions. First, does the creation of ETF´s have a positive
impact on the liquidity of the component securities? Second, is the impact of a creation of basket securities on liquidity asymmetric for the component securities? Or is the effect more
pronounced in the less heavily weighted stocks?
3.1. Increase on the liquidity of components stocks
The introduction of ETF’s may provoke the increase the market liquidity of components stocks. The reason for that may be the inter-market arbitrage opportunities that these
financial instruments promote. In other words, ETF’s create new arbitrage opportunities since the ETF’s trade at a share price may be not aligned with the value of the underlying securities.
The creation of Arbitrage opportunities caused by ETF’s could also promote the increased liquidity on stock components market, mostly due to the creation/redemption process that
helps keep ETF share prices in line with net asset values (NAVs). For instance if the
underlying securities are trading at a lower price than the ETF shares, arbitrageurs buy the
underlying securities, redeem them for creation units, and then sell the ETF shares on the open market for a profit. If underlying securities are trading at higher values than the ETF
8 creation units in order to get the underlying securities, and then sell the securities on the open market for a profit. The actions of the arbitrageurs set the supply and demand of the ETFs
back into equilibrium to match the value of the underlying shares, resulting this in an
increase of liquidity and lower adverse selection cost (Richie and Madura, 2007). Therefore, considering this theory I will test the following hypothesis:
A counter hypothesis is that liquidity decreases in underlying stocks. This could happen because the less informed trader will prefer given its advantages to invest more in ETF’s than in component stock. This effect could be stronger than the one referred to above because the arbitrage opportunities resulting from creation and redemption of ETF’s shares may be difficult to explore, mainly for individual investors, due to the high cost charged in ETF
primary market (a minimum amount of 50,000 units is required to create or redeem ETF
shares. Thus, according with the theory presented above and in alternative to the arbitrage
theory I will test the following hypothesis:
3.2. Asymmetric impact of liquidity
The Investor Recognition Hypothesis (Merton 1987) suggests that an introduction of a new financial vehicle may lead to an increase in liquidity on the component securities market and
the dispersion of investor beliefs regarding the expected future payoffs will decrease.
As referred above the creation of ETF’s promotes arbitrage opportunities via creation and redemption mechanisms of shares. Participating in these arbitrage opportunities would mean buying and selling all the components stocks of an index. This will improve the liquidity of
all stocks, but it will have a major effect in the previously ignored stocks. The reason for the
9 usually characterized by a lower liquidity and higher costs of transactions, so the increase in liquidity promoted by arbitrage opportunities will have a more pronounced effect for this
stock than in heavily weighted components of the index that already were liquid and the cost
of transaction were low. According with this theory I will test the hypothesis below:
A counter hypothesis is presented by Subrahmanyam(1991), who proposes that the
introduction of a stock index will result in a greater focus by informed traders on larger component stocks. Consequently, the informed trading of the more heavily weight
components of the stock will increase, which leads to a greater liquidity effect for these
stocks. Thus, according with the theory presented above and in alternative to the Investor Recognition Hypothesis I will the following hypothesis:
4. Data
The data for this paper comes from the Bloomberg database. The data used in this paper is
quote data, specifically, trade files that provides the data, time, price, and volume of each
security or index at the market close. The focus of the study is the 115 Brazilian securities of which 66 of them are part of the Bovespa Index at the time of the introduction of the ETF
and the remaining are component securities of other Brazilian Index, namely Índice Brasil
Amplo – IbrA. The remaining securities chosen have similar characteristics to the ones that are components of Bovespa Index, to avoid effects in the results related with very different
microstructure of securities. In order to support this I compare Bovespa Securities with Non-
Bovespa Securities in terms of liquidity, which is the main focus of this study. For that purpose I use liquidity measure such as trading volume, bid-ask spread, Amihud Illiquidity
10
TABLE 1: Comparison between the liquidity of Bovespa Securities and Non-Bovespa Securities
Trading Bid-Ask Amihud Std. Dev. of
Volume Spread (%) Illiquidity (%) Daily Returns
Non-Bovespa Securities Mean 1,762,697 0.025 0.210 0.146
Bovespa Securities Mean 3,411,417 0.009 0.046 0.155
From Table 1, I verify that Bovespa Securities and Non-Bovespa Securities have similar
characteristics. So despite of the Non-Bovespa Securities are less liquid than Bovespa Securities what is expected, since securities that not take part of the main index are usually
less liquid, but the differences are not significant to have effect in the final results.
I focus on the 101-days trading data period around the first day of iShares Ibovespa Index Fund - November 28, 2008. The data selected take in consideration a fifty-day trading
window for the pre-introduction and post-introduction. The reason for this choice is that
index-tracking stocks were immediately well received by the investors. The trading volume increases instantly, meaning that a good deal of the liquidity effect is realized within the first
50 trading days. Another reason is that a shorter range of days minimizes the chance of other
events (that is not controlled for) influencing the results, although it is important to note that
the period under study is during the Financial Crisis what may affect the results despite of the fact Brazil was not one of the most affected countries. At last, since the data is both time
series and cross section, the number of observations is enough to guarantee the power of the
test and the conclusion.
5. Ishares Ibovespa Index Fund (BOVA)
The iShares Ibovespa Fundo de Indice is an exchange traded fund in Brazil. The Fund's
objective is to reproduce the performance of the Ibovespa Index, before fees and expenses. The exchange traded fund was created, on November, 2008, by BlackRock Brasil
Gestora de Investimentos Ltda. One unit of the ETF is worth 1/100 of the Index, with a
11 Million. Share creation and redemption are always possible for a minimum of 100,000 shares.
6. Methodology
In order to test the hypothesis exposed in the section 3, I examine the variation in several measures of liquidity for Bovespa stocks in time period interval of fifty days before and after
the tracker-inception date of November 28, 2008.
To test the hypothesis the study is divided into three parts. In first part I test the impact of
the ETF´s creation on the liquidity of the component securities. Thereafter I will test the symmetry of that impact across the underlying securities. Finally I perform a descriptive and
comparative analysis of BOVA liquidity
Several liquidity measures have been suggested in the literature. Earliest studies of market
liquidity concentrate exclusively on bid-ask spreads (see Demsetz, 1968; Stoll, 1978a,
1978b). Lee, Mucklow, & Ready (1993) indicates that spreads alone is insufficient to
measure liquidity and that liquidity must be indicated also by depth of dealers. Hegde and McDermott (2004) use both spread and depth estimates to examine the impact of
DIAMONDS introduction on the S&P 500 index liquidity. The measures of liquidity are
however empirical proxies that measure different aspects of liquidity. No single measure captures all its aspect. For this reason in this study I measures liquidity using different
measures in order to capture all liquidity aspects.
In order to assess the impact of ETF´s creation has on the liquidity of the component securities I begin with a univariate analysis of trading activity and liquidity as measured by
trading volume, bid-offer spread and volatility of daily returns and Amihud measure as a
12
6.1. The impact of ETF´s creation has on the liquidity of the component securities
6.1.1. Univariate analysis
In the univariate analysis I use an approach similar to Hegde and McDermott (2004) by
computing a Pre/Post Ratio to perform this analysis. I define pre-BOVA introduction period
as an interval covering 50 trading days beginning on September 18, 2008 and ending in the day prior to the inception of BOVA. The post-BOVA is the period of 50 trading days post
the introduction of ETF, ending on February 12, 2009. Using mean and median measures of
trading activity and liquidity variables for each stock i in both pre and post BOVA periods. A
Pre/Post Ratio is computed as following:
̅
̅ , for i = 1,115, (1) where is the trading activity or liquidity measure for security i. A Pre/Post Ratio of the
mean or median greater than 1 indicates a decrease over time in the variable study for the
stock i, contrary a Pre/Post Ratio lower than 1 indicates an increase over time in the variable
study for the stock i. To test the null hypothesis of the Pre/Post Ratio is equal to one or in
other word to test if the variable in question have any significant change after the ETF
introduction I employ a t-test.
After describe the procedure I used to perform the analysis it is important to define the
variables I employ to measure liquidity and trading activity. I use the following daily
measures the daily trading volume, trade size, the turnover and standard deviation of the return. In what concerns the liquidity measure I used the bid-ask spread, which is:
, i = 1, 115, n =1, 101 (2)
where and are respectively the ask price and the bid price of a security i in a
given day n. This measure pretend to capture the transaction cost for each security, since less
liquid stock have in general higher transaction costs associated and consequently higher
spread, also more liquid stock have in general lower transaction costs associated and
13 Other measure of liquidity is depth, which is the size of an order needed to move the market a given amount. If the market is deep, a large order is needed to change the price.
However this measure requires intraday trading data that was not available, for that reason I
use the Amihud illiquidity measure, as a daily proxy. The Amihud measure is computed as follows:
| |
(3) where is the return on the stock i on the day n, and is the respective daily volume
in Real. This ratio gives the absolute or percentage price change per Real of daily trading
volume, or the daily price impact of the order flow. This follows Kyle's (1985) concept of illiquidity, the response of price to order flow. The Amihud measure calculation is important
to complement the liquidity analysis, since this measure and the bid-offer spread capture a
different aspect of liquidity, while the spread is capture the fixed-cost component the
Amihud measure the price impact component, in other words, it is a sensitive measure of the size effect of an order in price.
6.1.2. Multivariate analysis
To complete the study I perform a multivariate analysis using multiple panel data regressions that control for volatility, trading volume and price level, since this are the main variable that
affect the liquidity. When I use this control variable and the dummy variable I isolate the
impact of ETF introduction on liquidity. The methodology used in this analysis is similar to the one used by Richie and Madura (2007) and Hegde and McDermott (2004). The panel
data model is estimated as:
(4)
for i = 1, 115 and n = 1, 101, where the is the daily closing price, is the daily
14
Parkinson’s (1980) method3. The
is the log of the dependent variable. In this
regression is estimated using of two different dependent variables, which are, the bid-ask
spread (SPDbo) and the Amihud measure (Amihud) in relative terms, since they better reflect
their economic significance to the dealer. The dummy variable takes the value 1
for the period interval post introduction of BOVA and 0 otherwise. The dummy variable
takes the value 1 for stocks that are component of Bovespa Index, the underlying of
BOVA and 0 otherwise. The interception dummy variable takes the value 1
for the BOVA securities that take part of BOVA in the period interval post introduction of BOVA and 0 otherwise.
Considering equation 4, it is important to refer the importance and the role of dummy
variables. If the control variables are not related with the liquidity measures the dummy variables serve to capture the change in liquidity across a specific period and securities,
which are fundamental to measure the impact of BOVA creation on the liquidity of the
component securities. In order to achieve that it is necessary at first consider the equation 4
without the dummy variables. In this case the intercept term serve to capture the change in the liquidity across the portfolio of 115 securities in the 101 days period. Although, the goal
of this study is to measure the impact of BOVA creation on the liquidity of the component
securities, so for that purpose it is necessary to isolate that impact. To achieve this it is important to measure the impact on the liquidity of the whole portfolio after BOVA
introduction by introducing the Dummy BOVA, isolating this way changes in liquidity after
the introduction of BOVA that are or not related to the ETF introduction. Then to measure the additional impact on the liquidity in BOVA’s underlying stocks in the 101 days period I introduce the Dummy ETF, isolating the changes in liquidity related with the fact that the
security is or not a component of the Bovespa Index. After isolating these effects I am able to
3 Volatility using the Parkinson Method is estimated as:
; where HIGH and
15 measure the additional the liquidity on the component securities of BOVA in the period post-BOVA introduction by using the interception Dummy post-BOVAEFT, capturing with this
variable the direct impact of the introduction of BOVA in the underlying stocks. It is also
important to refer that this approach that permit isolate and capture these different effects is consistent to the one used by Richie and Madura (2007) and De Winne, Gresse and Platten
(2009).
The equation 4 is estimated using Fixed Effects Model to control for unobservable individual heterogeneity that may be correlated with the regressors, since the Pooled-OLS model is
restrictive because it is assumed to be no unobserved individual heterogeneity. The fixed
effects regression exploits within-group variation over time and it is a powerful tool for
removing omitted variable bias, caused by the correlation of omitted variables and other independent variable.
6.2. Asymmetric impact of liquidity
After study what is the impact of ETF´s creation has on the liquidity of the component
securities, I will test the symmetry of that impact across the underlying securities. For this
purpose I use the some regression presented above including just one more variable:
(5)
where represents the weight of each stock in the underlying index that is the
underlying of BOVA. The variable is an interception dummy, which
represents the weight of each stock in the underlying index after the introduction of BOVA.
By using this variable I can inferred about the symmetry of the impact on liquidity across the
16
6.3. Descriptive and Comparative Analysis of BOVA
Finally, I perform a descriptive and comparative analysis of BOVA, in order to realize the
evolution of BOVA after its introduction. Performing also a comparative analysis between BOVA and other comparable ETFs that already was object of others studies mention in the
Literature Review in order to capture some differences and results that could support future
analysis and conclusion. I use essentially liquidity measure in this analysis, such as turnover, bid-ask spread and Amihud measure.
7. Empirical Results
As mention in the previous section I divided the study into three. In first part I test the impact
of the ETF´s creation on the liquidity of the component securities. Thereafter I will test the
symmetry of that impact across the underlying securities. Finally I perform a descriptive and
comparative analysis of BOVA liquidity.
7.1. The impact of ETF´s creation has on the liquidity of the component securities
In order to measure the effect of ETF´s creation has on the liquidity of the underlying
securities I begin with a univariate analysis of trading activity and liquidity as measured by
trading volume, bid-offer spread and volatility of daily returns and Amihud measure as a
proxy to depth. I then analyze changes in liquidity in a multivariate framework.
7.1.1. Univariate Analysis
7.1.1.1.Univariate analysis of changes in trading activity
To perform the univariate analysis of changes in trading activity I computed the Pre/Post
Ratio using the following variables: Trading Volume, which is a market indicator that
measure how many trades take place for a security or on an exchange on a given trading day, the Trade Size which consist in the average size in number of shares of each trade/order
17 volume, which could be considered as a liquidity measure liquidity calculated by dividing the total number of shares traded over a period by the average number of shares outstanding
for the period, the higher the turnover, the more liquidity of a stock. And finally I used
standard deviation of daily returns.
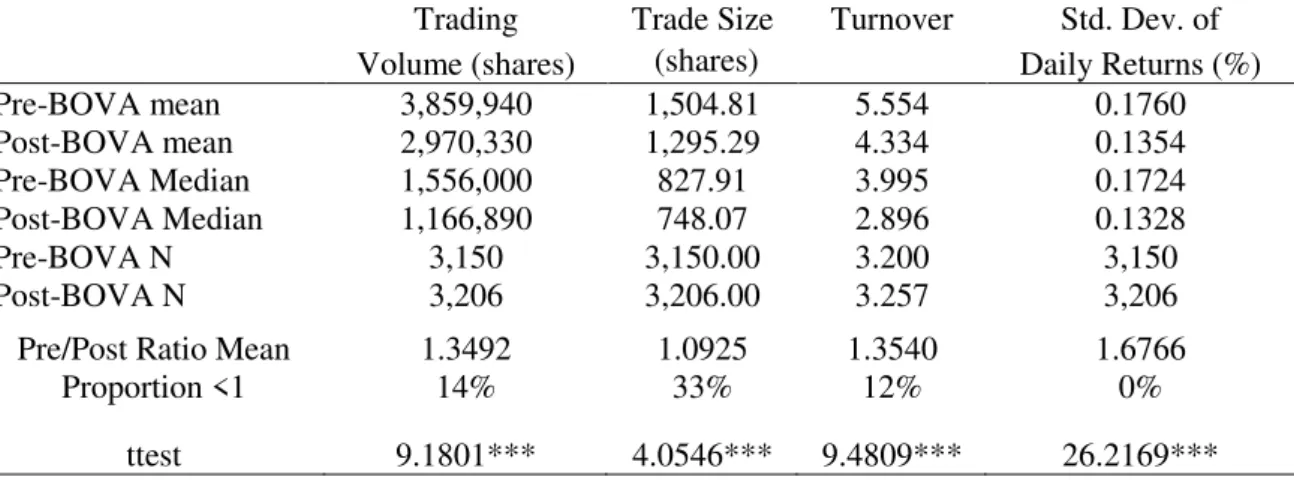
TABLE 2: Changes in the trading activity of the underlying Bovespa Stocks after the introduction of BOVA
Trading Trade Size Turnover Std. Dev. of
Volume (shares) (shares) Daily Returns (%)
Pre-BOVA mean 3,859,940 1,504.81 5.554 0.1760
Post-BOVA mean 2,970,330 1,295.29 4.334 0.1354
Pre-BOVA Median 1,556,000 827.91 3.995 0.1724
Post-BOVA Median 1,166,890 748.07 2.896 0.1328
Pre-BOVA N 3,150 3,150.00 3.200 3,150
Post-BOVA N 3,206 3,206.00 3.257 3,206
Pre/Post Ratio Mean 1.3492 1.0925 1.3540 1.6766
Proportion <1 14% 33% 12% 0%
ttest 9.1801*** 4.0546*** 9.4809*** 26.2169***
From Table 2, all the variables referred above experienced a significant decrease. For
instance the daily trading volume mean decrease from 3,859,940 shares in pre-BOVA period
to 2,970,330 shares in post-BOVA period and also only 14% of Bovespa underlying stocks
experience an increase after BOVA introduction. This may happen due to the lack of
confidence of the investors in this period. The Trade Size daily mean decrease significantly
from a 1,505 shares per order to a 1,295 shares per order after BOVA inception. The mean
Pre/Post ratio for turnover is 1.3540 and the decrease in the turnover is highly significant
using the using the t-test (t=9.4809), meaning that the securities are less liquid because it
indicates that is harder to buy and sell securities. However, there is the indication that
standard deviation of daily returns has a significant decreased, this may indicate an increase
in liquidity, since in illiquid stocks, any trading that is performed can have a drastic effect on
the stock price because so few orders are placed and for this reason more sensible to price
18 7.1.1.2.Univariate analysis of changes in liquidity
In the Univariate analysis of changes in liquidity I use the bid offer spread and Amihud
measure as mention before. I computed both this liquidity measures in Real as well as in
percentage. In fact I focus on the relative spread and Amihud measure since they are
economically more significant to the dealers.
TABLE 3: Changes in the liquidity of the underlying Bovespa Stocks after the introduction of BOVA
Bid Offer
Spread (R$)
Bid Offer Spread%
Amihud Measure (R$)
Amihud Measure %
Pre-BOVA mean 0.2102 0.0107 1.3579 0.0532
Post-BOVA mean 0.1316 0.0067 1.0451 0.0394
Pre-BOVA median 0.1000 0.0068 0.3031 0.0211
Post-BOVA median 0.0600 0.0046 0.2089 0.0155
Pre-BOVA N 3,150 3,150 3,150 3,150
Post-BOVA N 3,206 3,206 3,199 3,199
Pre/Post Ratio Mean 1.6767 1.6141 1.5283 1.4149
Proportion <1 3% 5% 12% 11%
Ttest 10.7184*** 11.8072*** 3.5848*** 6.1101***
From Table 3, the bid-ask spreads decrease significantly in the period post the introduction of
BOVA, indicated this that liquidity of Bovespa underlying stocks increase after BOVA
inception. The mean of the relative bid-ask spread decrease from 0.0107% in the pre-BOVA
period to 0.0067% in the post-BOVA period, being this decrease highly significant as can be
verified by the t-test (t=11.8072). The bid-ask spread in reais presented a significant decrease
and only and also only 3% of Bovespa underlying stocks experience an increase after BOVA
introduction.
The mean (median) of relative Amihud measure experienced a significant decrease from a
0.0532% (0.0221%) to 0.0394% (0.0155%) after BOVA inception. Nevertheless the
corresponding mean Pre/Post Ratios are 1.4149 and only 11% of the Pre/Post ratios of the
underlying stocks are lower than the unity. This indicated that the liquidity increase since the
19 necessary a more volume order to change the price. Consistent with the previous univariate
analysis using the bid-ask spreads, the Amihud measure display an increase on the liquidity
of the ETF´s creation on the liquidity of the component securities. This indicates that there is
a lower adverse selection in the cost of trading that may result from the increasing ability of
traders to arbitrage across the market of underlying stocks due to the introduction of BOVA.
However the univariate analysis of changes in liquidity is not totally consistent with the
changes in trading activity analysis, since using the bid-ask spread, the Amihud Measure and
also by the volatility of the returns measures I conclude that the liquidity increase what is
consistent with the arbitrage theory and with previous study that also test that hypothesis,
such as Hegde and McDermott (2004). The conclusion obtained by using the turnover and
other volume is not the same, the univariate analysis of changes in trading activity analysis
indicates a decrease in liquidity what is not consistent with the previous conclusion and
theory. The reason for this may be the financial is that the variables used in univariate
analysis of changes in trading activity may be more sensible to other factors such as the lack
of confidence of the investors due to the financial crisis that may not be directly correlated
with changes in liquidity due to the ETF introduction.
Since the univariate analysis of changes in liquidity is not totally consistent with the changes
in trading activity analysis and to clarify the impact of the ETF´s creation on the liquidity of
the component securities I perform a multivariate analysis, to obtain I more accurate analysis
of how each component interact and how each one affected the liquidity.
7.1.2. Multivariate Analysis
20 As mention in this analysis I use the equation 4 and the dependent variables defined to measure the impact of the ETF´s creation on the liquidity of the component securities are: the relative bid-ask spread and the relative Amihud measure. The control variables used are Price, the Volume and the Volatility.
In the Literature is well establish that bid-ask spread increase with greater volatility and decrease with an increase in asset’s price and trading volume (e.g. Benston abd Hagerman, 1974; Tinic and West, 1972; Coperland and Galai, 1983; Richie and Madura (2007); Hegde and McDermott (2004)). This is expected to happen because dealers set wider bid-ask spreads to protect themselves against adverse price movements associated with highly volatile stocks while more liquid stocks, namely those which experience greater trading volume, would allow a dealer to set a tighter spread.
TABLE 4: A multivariate analysis of change in the Bid-Ask Spread (%) of underlying stocks after the introduction of BOVA
(1) (2) (3) (4) (5)
VARIABLES lnSPDbo lnSPDbo lnsSPDbol lnSPDbo lnSPDbo
lnVOL -0.103*** -0.106*** -0.102*** -0.105*** -0.106***
(-6.891) (-7.419) (-6.885) (-7.082) (-7.414)
lnPRC -0.0107 -0.110 -0.0112 -0.0193 -0.109
(-0.127) (-1.478) (-0.133) (-0.230) (-1.478)
lnVAR 0.711*** 0.494*** 0.711*** 0.605*** 0.494***
(12.10) (9.396) (12.10) (10.68) (9.383)
BOVA -0.273*** -0.269***
(-10.03) (-7.198)
ETF -1.615*** -1.787***
(-110.6) (-71.62)
BOVAETF -0.246*** -0.00813
(-6.436) (-0.157)
Constant -2.061*** -2.076*** -1.160*** -2.141*** -1.081***
(-5.685) (-6.528) (-3.215) (-6.068) (-3.434)
Observations 11,319 11,319 11,319 11,319 11,319
R-squared 0.040 0.056 0.041 0.048 0.056
Robust t-statistics in parentheses, *** p<0.01, ** p<0.05, * p<0.1
21 introduction of BOVA for the portfolio of 115 securities even after controlling for changes in price, volume and volatility. The Dummy ETF is negative (-1.787) and highly significant (t= -71.62) as well, which indicates that the fixed cost are less in the securities that compose the Bovespa Index. The Dummy BOVAETF coefficient is negative as well (-0.00813) what could indicate that the spread decreases even more in the period Post- BOVA introduction for their components securities, what indicates a decrease in the cost trading component of that securities, however the coefficient is not significant. Thus, I have evidence that the bid-ask spread is tighter in the components stock of the Bovespa Index and that there is a decrease in the bid-ask spread after the introduction of BOVA in all the 115 securities however this increase cannot be directly related with the ETF introduction. This because the decrease in the liquidity component cost of trading is not significant for the component securities for Bovespa in the post period of the ETF introduction.
The other liquidity measure used is Relative Amihud Measure (a depth proxy). In this measure it is also expects an increase with greater volatility and decrease with an increase in asset’s price and trading volume, for the control variables.
TABLE 5: A multivariate analysis of change in the Amihud Measure (%) of underlying stocks after the introduction of BOVA
(1) (2) (3) (4) (5)
VARIABLES lnAmihud lnAmihud lnAmihud lnAmihud lnAmihud
lnVOL -0.953*** -0.954*** -0.953*** -0.954*** -0.954***
(-64.48) (-65.63) (-64.47) (-65.63) (-65.74)
lnPRC 0.0705 0.0192 0.0704 0.0191 0.0189
(1.302) (0.368) (1.302) (0.366) (0.361)
lnVAR 1.836*** 1.717*** 1.836*** 1.717*** 1.717***
(23.88) (19.63) (23.88) (19.63) (19.62)
BOVA -0.144*** -0.145*** -0.145***
(-4.792) (-4.793) (-3.625)
ETF -0.109*** -0.200*** -0.199***
(-7.375) (-7.702) (-7.437)
Bovaetf 0.00106
(0.0267)
Constant 12.85*** 12.83*** 12.91*** 12.94*** 12.94***
(43.09) (44.93) (44.07) (46.47) (46.34)
Observations 10,928 10,928 10,928 10,928 10,928
R-squared 0.384 0.387 0.384 0.387 0.387
22 From Table 5 it possible to verify that similar to the relative bid-ask spread in the Relative Amihud Measure the control variables for volume, volatility and price have the anticipated
sign in all the regressions. However the coefficient of PRC is not significant in this case as
well.
The intercept term for the relative Amihud Measure is positive (12.94) and highly
significant (t = 26.77). The Dummy BOVA coefficient is negative (-0.145) and significant
(t= -3.625), meaning that the price sensitivity decrease for all 115 stocks in the post-BOVA period. The Dummy ETF is negative (-0.199) and highly significant (t= -7.437) as well,
which indicate that a stock that takes part of Bovespa Index is more liquid. The Dummy
BOVAETF coefficient is positive (0.00106), what could mean an increase in the illiquidity for the underlying stocks in the period Post-Bova but since the coefficient is not significant I
have no evidence to conclude that. Thus, the introduction of ETF had no impact in the price
impact component of liquidity measure by the relative Amihud Measure.
From the multivariate analysis I conclude that the introduction of BOVA has no impact on
the liquidity of the underlying stocks. This result is not consistent with any of the hypothesis
exposed in the section 3. Given the result, I have to reject the hypothesis related with the
Arbitrage Theory that liquidity increase in the underlying stocks after the ETF introduction
due to the increasing arbitrage opportunities via that emerge from the ETF conception via
creation and redemption mechanisms. This may happen because to exploit the arbitrage
opportunities are difficult in an illiquid ETF as BOVA due to the high minimum amount of 100,000 units required to create and to redeem an ETF share, and its respective charge cost.
In fact in more illiquid ETF the arbitrage opportunities are superior, although if there is not
enough trading volume to create or redeem shares these opportunities are not exploited. Nevertheless the hypothesis that liquidity decreases in underlying stocks because the less
23 expected, chance the investment focus of the less informed trader from the securities to a more diversified instrument that is an ETF due to low liquidity presented by BOVA.
7.2.Asymmetric impact of liquidity
From the analysis above I conclude that there is no impact of BOVA creation on the liquidity of the component securities. Despite of this I test in this section if that absence of impact is in
all the component securities or if the factor weight has impact on the liquidity. In other
words, I test the symmetry of the impact or absence of them across the underlying securities after the introduction of the ETF. In order to perform the analysis I use the Data relative just
to the 66 securities components of the Bovespa Index, since the goal of this analysis is to
understand if within the Index the absence of impact on liquidity is common to all stock or if the impact on liquidity changes dependently of the weight of stocks in the index
TABLE 6: A multivariate analysis of the Asymmetry of the liquidity impact of underlying stocks after the introduction of BOVA
(1) (2) (3) (4)
VARIABLES LnSPDbol lnSPDbo lnAmihud lnAmihud
lnVOL -0.177*** -0.177*** -0.873*** -0.873***
(-6.693) (-6.655) (-25.15) (-25.21)
lnPRC -0.118 -0.121 0.156** 0.160**
(-0.896) (-0.921) (2.027) (2.049)
lnVAR 0.618*** 0.617*** 2.111*** 2.112***
(9.948) (9.927) (26.23) (26.19)
BOVA -0.264*** -0.271*** -0.0267 -0.0159
(-7.000) (-6.217) (-0.850) (-0.438)
WEIGHT 4.102 4.475 -0.195 -0.756
(0.701) (0.758) (-0.0325) (-0.110)
BOVAWEIGHT 0.436 -0.658
(0.791) (-0.973)
Constant -1.231** -1.234** 11.90*** 11.90***
(-2.408) (-2.406) (19.44) (19.44)
Observations 6,271 6,271 6,210 6,210
R-squared 0.051 0.051 0.224 0.224
Number of ifs 63 63 63 63
Robust t-statistics in parentheses;*** p<0.01, ** p<0.05, * p<0.1
Table 3 shows relative bid-ask spread and Amihud measure into a microstructure component
24 regressions. Except for price that are negative but not significant in the relative spread bid-ask spread case and it is significant but positive in the relative Amihud measure case.
For both liquidity measures the post-BOVA dummy variable DBOVA is negative, which is
consistent with results previous findings, meaning that in the period Post-BOVA introduction the liquidity improved for all the component stocks.
In the relative bid-ask spread the WEIGHT variable is positive which may indicates that the
larger the weight of the component stock, the wider the relative spread. Contrary the Weight coefficient of the relative Amihud measure is negative which could indicates that the larger
the weight of the component stock, the smaller is the sensitivity of the price. However in
both case the variable WEIGHT is not significant meaning that the weight of the securities has no impact in the both components of liquidity.
The interaction of WEIGHT and BOVA allows understanding the symmetry of the impact or
absence of them across the underlying securities after the introduction of BOVA. Thus, if the
coefficient is positive as happen in the case of the relative spread bid offer which implies that though more heavily weighted stocks enjoy tighter spreads than less heavily weighted stocks,
the reduction in spreads for these stocks is less pronounced than for the lower weight stocks
in the post-BOVA market. Contrary the Amihud measure presents a negative coefficient. Nevertheless both are not significant, meaning that the weight of the securities also has no
impact in the both components of liquidity after BOVA inception.
In the sequence of the performed analysis I conclude that the absence of impact on the liquidity after the introduction of BOVA is symmetric across the underlying stocks, as
expected.
7.3Descriptive and Comparative Analysis of BOVA
Consistent with the previous analysis I use a sample of the 50 after the inception date of each ETF, this to minimizes the chance of other event (that is not controlled for) influence the
25
Table 7: Descriptive and comparative analysis of BOVA liquidity
Variables BOVA QQQ SPDR S&P 500 DIAMONDS Lyxor CAC 40
Trading Volume 182,116 10,838,760 209,762 825,810 515,439
Turnover 2.3791 16.2639 4.1789 19.9414 10.0565
Bid-Ask Spread 4.768% 0.357% 0.017% 0.018% 0.077%
Amihud Measure 0.5363% 0.0123% 0.0961% 0.0382% 0.1054%
Volatilitity 2.848% 2.289% 0.777% 0.752% 1.474%
The Trading Volume is the daily average number of shares trading; the Turnover is calculated by dividing the total number of shares traded over a period by the average number of shares outstanding.
From Table 7, I verified that BOVA is the ETF that presents worse results in terms of
liquidity. BOVA has the lowest turnover, which means that buy and sell in this ETF is
harder. The trading cost as measured by the bid-ask spread is the highest, what also happen
in the Amihud measure an illiquidity measure of price impact. Finally the volatility of the return are also higher compared with the other ETFs, which also indicates that BOVA is less
liquid than the comparable ETF.
These results are important to stress that the market microstructure in Brazil is different when compared to USA and European countries for instance. And also it is important because due
to these differences and due to the less liquidity presented by BOVA after its inception the
conclusion and results may be very different from previous studies on European countries and USA.
It is also important to mention that the level of the liquidity measures presented by BOVA
are just compared with the less liquid and less weight securities in the Bovespa Index,
meaning this that the liquidity in BOVA was very low in its first days.
In fact the low liquidity of BOVA is the main reason for the evidence found that the
introduction of BOVA have no impact on the liquidity of the underlying stocks. This low
liquidity in BOVA could be related with even more lack of confidence of the less informs trader due to the financial crises.
8. Conclusion
26 this study are not consistent with previous study as Richie and Madura (2007), Hegde and McDermott (2004) and De Winne, Gresse and Platten (2009) that show an increase in
liquidity after the ETF introduction or neither to those of Van Ness, Van Ness and Warr that
found an increase in bid-ask spread following the introduction of the fund. I found that there is no impact in the underlying stocks after the introduction of the ETF. And that this absence
of impact is symmetric across all the component of the underlying index. Thus, although the
univariate analysis reveals an improvement in the liquidity measures, namely the bid-ask spread and the Amihud measure, when performed the multivariate analyses I verified that
this improvement is not directly related to the introduction of the ETF, since that
improvement is verified in all the sample of stocks and not more specifically in the
underlying stocks of the ETF. Consequently, the hypothesis exposed fail, since according to Arbitrage Hypothesis the introduction of ETF increase the liquidity of underlying stock and
the Recognition Hypothesis (Merton 1987), also fail because the impact is symmetric across
the component stocks.
The reason because the results are not consistent with the Hypothesis neither with previous
studies can be the different market structure in Brazil and mainly the low liquidity of BOVA
compared to other ETF at the time of the inception. This last factor is very import to
determinate the absence of impact in liquidity after the Ishare IBovespa Index fund (BOVA)
9. References
Amihud, Y., (1980). “Illiquidity and stock returns: cross-section and time-series effects”
Demsetz, H. (1968). “The cost of transacting”. Quarterly Journal of Economics, 82, 33–53.
Hegde, S.,&McDermott, J. (2003). “The liquidity effects of revisions to the S&P 500 index: An empirical analysis”. Journal of Financial Markets, 6, 413–459.
27 Jegadeesh, N., & Subrahmanyam, A. (1993). “Liquidity effects of the introduction of the S&P 500 index futures contract on the underlying stocks”. Journal of Business, 66, 171–197.
Kumar, R., Sarin, A., & Shastri, K. (1998). “The impact of options trading on the market quality of the underlying security: An empirical analysis”. Journal of Finance, 53, 717–732.
Lee, C., Mucklow, B.,&Ready,M. (1993). “Spreads, depths, and the impact of earnings information: An intraday analysis”. Review of Financial Studies, 6, 345–376.
Merton, R. (1987). “A simple model of capital market equilibrium with incomplete information”. Journal of Finance, 42, 483–510.
Parkinson, M. (1980). “The extreme value method for estimating the variance of the rate of return”. Journal of Business, 53, 61–65.
Richie, N and Madura, Jeff (2007). “Impact of the QQQ on liquidity and risk of the underlying stocks”, Quarterly Review of Economics and Finance 47, 411-421.
Subrahmanyam, A. (1991). “A theory of trading in stock index futures”. Review of Financial
Studies, 4, 17–51.
Van Ness, Bonnie F., Robert A. Van Ness and Richard S. Warr, 2005. “The impact of the introduction of index securities on the underlying stocks: The case of the Diamonds and the