U-stage and EBSD technique as complementary methods
Cristiane Paula de Castro Gonçalves
1& Leonardo Evangelista Lagoeiro
1Abstract In the last years, the electronic microscopy has become an important tool to textural analyses of mineral aggregates. The electron backscattering diffraction (EBSD) has been used to determine preferred ori-entation patterns quickly in areas statistically representative. However, when the grain boundary geometry and their orientations are considered, there is not a way to determine the grain boundary orientation individually for EBSD, what is possible using U-stage mounted on a petrographic microscope. The geometry and grain bound-ary orientation pattern constitute important microstructural and textural parameters. They are directly related to deformational processes occurred during evolution and stabilization of mineral aggregates, as well as their physical properties. Therefore, when the microfabric is characterized is necessary, besides a complete charac-terization of crystallographic preferred orientation, to have individual control of geometry and grain boundary segments orientation. In this sense, the use of U-stage, although there are restrictions, is fundamental. This method allows the determination of grain boundary plane orientation, individually, while the EBSD permit a global analyze related to misorientation studies between those grains that share a boundary plane. Therefore, the methodology to characterization of grain boundary orientation patterns is presented. The referred methods are applied as complementary techniques, what allows the characterization of 5 degrees of freedom neces-sary to determine a boundary surface: the grain boundary plane orientation and the distribution of angle/axes misorientation pair. The data were obtained in quartz aggregates, which came from banded iron formation, in Quadrilátero Ferrífero (MG).
Keywords: texture, microstructures, grain boundary geometry, sample preparation for EBSD, U-stage.
R esum o Platina Universal e técnica de elétrons retroespalhados difratados como métodos com-plementares. Nos últimos anos, o uso de microscopia eletrônica para análise textural de agregados minerais, por difração de elétrons retroespalhados (EBSD), tem se tornado importante meio para se determinar padrões de orientações preferenciais de maneira rápida e estatisticamente representativa. Entretanto, ao se considerar a geometria de borda dos grãos, não há como determinar a orientação das superfícies de borda, individualmente, por EBSD, o que se pode fazer através de platina universal acoplada a um microscópio ótico. A geometria e padrão de orientação das bordas dos grãos constituem importantes parâmetros microestrutural e textural que estão diretamente relacionados aos processos deformacionais ocorridos durante evolução e estabilização de determinado agregado, bem como às suas propriedades físicas. Portanto, ao se caracterizar a microtrama de um agregado é necessário que além de uma completa determinação das orientações cristalográficas preferenciais, se tenha controle da geometria e orientação dos segmentos de borda que limitam os grãos. Para tal, o uso da platina universal, apesar das restrições, é fundamental, já que permite a determinação das orientações das su-perfícies de borda individualmente, enquanto por EBSD tem-se uma análise global da relação de desorientação entre os grãos que compartilham uma borda. Nesse contexto, apresenta-se a metodologia para caracterização de padrões de orientação de bordas, aplicando os referidos métodos como técnicas complementares, o que permite a caracterização dos 5 graus de liberdade necessários: orientação do plano de borda, distribuição e orientação do par eixo-ângulo de desorientação. Para tal foram utilizados agregados de quartzo provenientes de formações ferríferas bandadas do Quadrilátero Ferrífero (MG).
Palavras-chave:textura, microestruturas, geometria de borda, preparação de amostras para EBSD, platina universal.
1 - Departamento de Geologia, UFOP, Ouro Preto (MG), Brasil.
E-mails: [email protected] ou [email protected]; [email protected]
structures, crystallographic preferred orientation (CPO) and shape preferred orientation (SPO) must be carried out in the aggregates. On the other hand, the character-ization of microstructures must also take into account grain boundary properties, such as their spatial array and crystallographic orientation, since, in some cases, the boundaries may play an important role on the ac-INTR O D UcTIO N The microstructural and
micro-commodation of the deformation. However, the study of grain boundary properties became an important mat-ter in earth sciences only in the last decades, when grain boundary geometry in polycrystalline aggregates began to receive more attention.
Although at that time, grain boundary geom-etries, their relationship with the equilibrium of surface energy and their role in different geological situations remained poorly understood, there was a general agree-ment that their geometry might be used to determine physical and chemical properties of the aggregates as well as to infer metamorphic conditions (Randle 1992, Lloyd et al. 1997, Wheeler et al. 2001, Wheeler et al.
2003, Lloyd 2004). The poor knowledge about grain
boundary arrangements is due, mainly, to difficulties to
use optical methods to measure them, and for the
dif-ficulties to determine all parameters required for a com -plete boundary characterization. However, a com-plete investigation of how minerals behave under deforma-tion demands a detailed analysis of such properties, as pointed out by many authors (Lloyd & Freeman 1991, Randle 1992, Mainprice et al. 1993, Lloyd et al. 1997, Randle & Engler 2000, Lloyd 2004).
The grain boundaries are characterized by two
parameters with five degrees of freedom (Spry 1983,
Randle 1992): (i) the orientation of the boundary plane (parameter with two degrees of freedom, the plane azi-muth and its dip); (ii) the misorientation between two neighbor grains, which share the same boundary. In rocks and minerals in general (except isometric ones), these crystallographic information of grain boundar-ies can be obtained using serial sections and stereol-ogy (Randle 1992) or in a easier manner using only one section and applying U-stage and EBSD techniques as complementary methods (Kuntcheva et al. 2006). The U-Stage is mounted on a petrographic microscope, through which is possible to determine the boundary plane orientation, while the analysis of the misorienta-tion axis/angle pair is made via Electron Backscattering Diffraction – EBSD technique (Randle 1992, Dingley
et al. 1995, Prior et al. 1999, Humphreys 2001, Prior
et al. 2002). Both methods are useful in different as-pects on determination of grain boundary properties, and therefore, should be used as complementary tech-niques, in order to obtain a more complete analysis of such characteristics (Kuntcheva etal. 2006).
In this sense, the grain boundary microstruc-tures, their geometry and orientation patterns were car-ried out in quartz aggregates from tectonites of banded iron formation, which came from Quadrilátero Ferríf-ero (MG). As the quartz grains register even the lowest deformation levels, they are considered deformation markers, furthermore, the preferred orientation patterns for quartz grains associated to different deformational and metamorphic conditions are well knew and largely discussed in the literature (e.g. Tullis et al. 1973, Schmid
& Casey 1986, Law et al. 1990, Law 1990, Hirth & Tullis 1992, Kruhl 1996, Lloyd et al. 1997, Lagoeiro
1998, Hippertt et al. 2001, Stipp et al. 2002, Heilbron-ner & Tullis 2002). Therefore, the study of quartz
ag-gregates found in itabirites in the region of Quadrilátero Ferrífero constitute an important way to understand the deformational mechanisms through which the features and structures observed in these rocks were generated. Besides, the banded iron formations in the Quadriláte-ro FerrífeQuadriláte-ro (MG) are distributed aQuadriláte-round a large area and they register the most important deformational and metamorphic events occurred during the geological
time in this region (Alkmim & Marshak 1998). In ad -dition, the researchers have shown a metamorphic and deformational gradient from western to east portion of the area (Pires 1995, Rosière 2001) and, therefore, as the grain boundary geometry and their orientation pat-terns to mineral aggregates remain poorly understood the referred samples should be used to characterize the grain boundary arrangement in different tectonometa-morphic context.
For those reasons, the aim of this contribution is presenting the methodology used to characterize the grain boundary geometry and grain boundary orien-tation patterns, once there is not, in the literature, the description of the procedures used. The U-stage and EBSD system are presented as complementary tech-niques, being that the limitation and complementary of these two techniques are discussed in order to accom-plish a detailed characterization of the grain boundary array in recrystallized quartz grains. The data obtained, showing misorientation and grain boundary orientation patterns from samples in different metamorphic con-texts, illustrate the kinds of graphs and diagrams plot-ted and how they should be interpreplot-ted.
meThO D s
sa m ple Prepa rati on The first step is a careful proce -dure to sample preparation. Then, the samples were
se-lected according to some specific features. In all samples
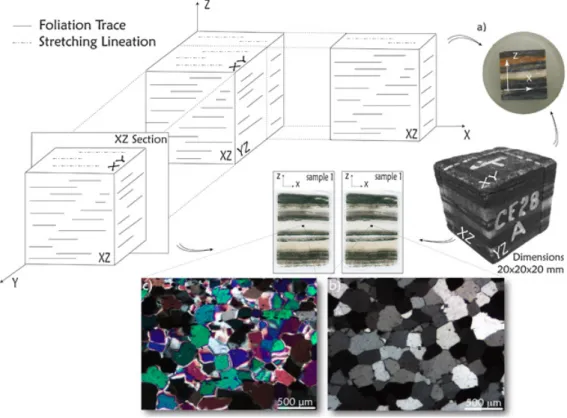
quartz bands are continuous (in range of several centi-meters) and thick (between 2 – 10 mm). The X, Y and Z reference system used in structural geology,
correspond-ing to the main axis of the finite strain ellipsoid (Twiss &
Moores 1992, Passchier & Trouw 1996), where X axis is parallel to the mineral elongation, Z axis normal to the foliation and Y-axis perpendicular to the XZ plane, was adopted. Then, cubic blocks of dimensions 20x20x20 mm were prepared for polishing (Fig. 1).
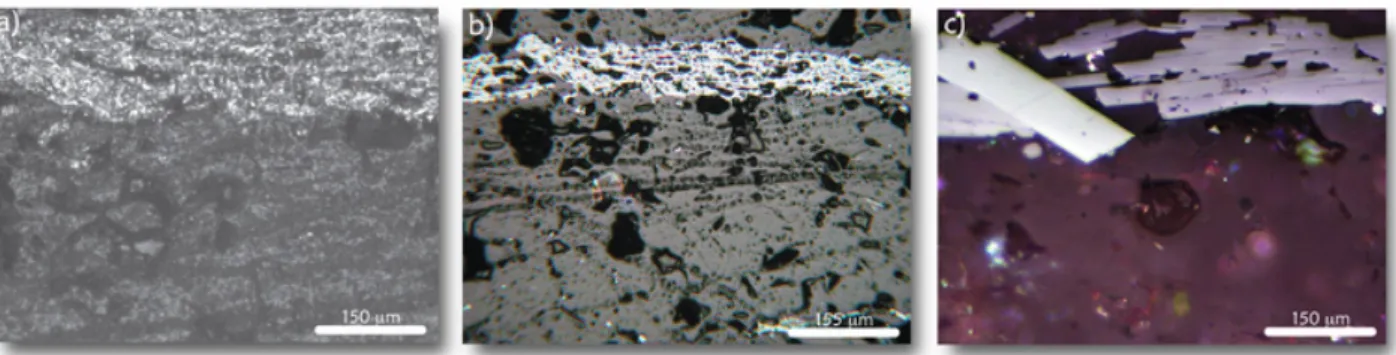
All samples were cut parallel to the stretching lineation (strain-X) and perpendicularly to the rock folia-tion (XZ plane) using a low-speed saw to prevent dam-aged on sample surfaces. Sections for EBSD and optical analyses were prepared in a closely match to minimize
the misfit of the observed areas (Fig. 2): (i) blocks of
15x15x7 mm were obtained and enclosed into an epoxy resin for EBSD analysis (Fig. 2a); (ii) regular thin
sec-tions (≈ 0,03mm – Fig. 2b) were prepared as well as (iii) thick sections (≈ 0,07mm), for U-stage measurements of
grain boundary plane orientation (Fig. 2c).
interference of these mineral phases during the recrystal-lization processes. Therefore quartz bands can be consid-ered pure and free of iron oxide minerals. Then, the blocks were enclosed in epoxy resin for EBSD analysis while the thick sections were used to measure the crystallographic orientations of grain boundaries, in the U-stage.
Sample preparation is crucial for EBSD
analy-sis. The analyzed sample surface must be perfectly flat
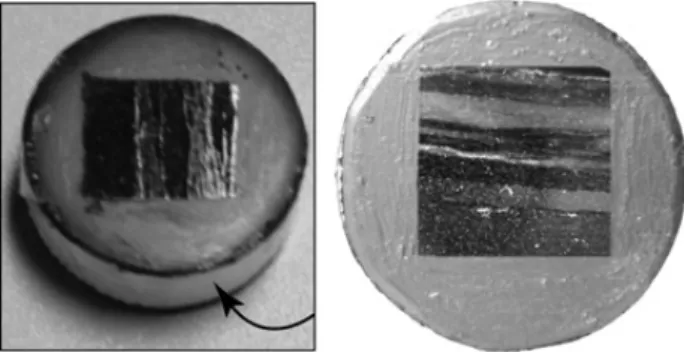
and free of any type of mechanical damage resulting from the polishing. To accomplish that, the MINIMET 1000 – Grinder Polisher was used. Initially, the samples were enclosed in epoxy resin and their sharp edge was removed using sandpaper (Fig. 3). This procedure is necessary to enhance the polishing process once it al-lows that the whole sample surface is in contact with
the grinder fluid paste.
Figure 1 - Sample of banded iron formation in which thicker quartz bands can be observed and a block from which the sections were prepared.
Figure 2 - Schematic figure illustrating the tree kinds of prepared samples. Blocks
with 20x20x20 mm blocks with 15x15x7 mm were cut and closed in epoxy resin (a);
thin sections with ‘normal’ thickness, ≈ 0,03mm, were made (b), as well as thicker sections, ≈ 0,07mm (c).
Initially, all excess of resin is removed from the sample surface what involves a mechanical polishing with a diamond disc of grain size of 45µm, an applied force of 2 or 3lb, and rotation of 30 rpm. The sample and polisher disc should be immersed in distilled water. The time re-quired for polishing varies, and depends on the material properties. Geological samples must be polished at least for 30 seconds or until the resin that covers the sample surface is completely removed (Fig. 4a). In this case, time consumption varies from 15 minutes up to 2 hours, de-pending on the thickness of the quartz band, as well as the proportion between quartz grains and iron oxides.
The next step is to polish the sample surface with a diamond disc of smaller grain size, 15µm in this case, whose aim is to soften the defects generated on the sur-face of the sample during the previous stage. This disc
should be used while amounts of resin can be identified
on the sample surface, but care should be taken with the time, since it should not exceed ten minutes (Fig. 4 a-b). The discs of grain size of 45 and 15µm can be substituted for silicon carbide-paper discs, a synthetic abrasive material. However, there are some
disadvan-tages in the use of silicon carbide: as the sample needs to be immersed in distilled water during the polishing, the durability of paper disc is lower and the time
re-quired to this first polishing stage is larger.
In the third step, the mechanical polishing should be done with diamond past in oil medium (AUTOMET Lapping Oil). The process started with diamond past of 9µm in a Nylon polisher cloth (Fig. 5a). A load of 5 lb was applied at 30 rpm. The running time was, in average, 45 minutes and it is recommendable does not exceed one hour. In average, about 45 minutes was spent for each size of diamond paste used: 9µm, 3µm, 1µm and 0.25µm, being that for the two last pastes a softer pol-isher clothe was used, a load of 3lb was applied at 30 rpm (Fig. 5b). Between each size intervals of diamond paste, the samples were ultrasonically cleaned, with distilled water, to eliminate any residue of the preceding paste. A visual inspection of the surface quality of the sample must be done in an optical incident light microscope.
In the final stage a mechanical and chemical
polishing must be accomplished to make sure that all imperfection and mechanical deformation induced
dur-Figure 4 - The illustration represents the first polishing stage; a) in the left side, sample enclosed in epoxy
resin without polishing, followed for a partially polished sample, in which an area, apparently, without epoxy resin is selected. However, the micrograph shows some stains (two are contoured) on the sample, which represents rests of epoxy resin. These stains should be removed by disc with 15 µm so that the
sample does not be too deformed, superficially; b) Photomicrograph showing the sample without resin,
after the use of the disc with 15 µm.
ing cutting is eliminated. The polishing must be made with an alkaline solution of colloidal silica, SYTON (Fynn & Powell 1979), of grain size of 20 nm. A soft polisher cloth must be used and the surface of the sam-ple must be comsam-pletely immersed in the solution, at a speed as lower as 30 rpm and with a minimum applied
load (~ 1lb). The lapping time required is around 8-10
hours, in average, for the studied samples (Fig. 5c). For non-conductive samples, it is necessary to cover the sample surface with a very thin layer of carbon of few nanometers of thickness. However, extra care is necessary because even a nanometric cover of carbon might interfere with the generation of the diffraction pattern, kikuchi bands (Prior et al. 1999). In this case, initially, the sample must be cleaned with acetone, after ultrasonically cleaned with distilled water, at least for 25 minutes, and the last polishing stage with colloidal silica must be repeated for about 4 hours (Fig. 6).
D a ta Acqu i siti on Initially, suitable quartz bands were selected for U-stage measurements. A mosaic of optical micrograph was composed and grain boundaries were mapped out manually. In the grain boundary map, grains were indexed for boundary orientation measurement and for determination of grain size distribution (Fig. 7).
In the thick sections, boundaries inclined to the section plane are visualized as diffuse strips. Shallow grain boundaries appear as broad diffuse bands (Fig.
8a). As the U-stage allows the rotation of inclined
boundaries to the vertical position, the attitude of grain boundary plane can be measured with precision of ~ 1o (Fig. 8b). These data combined with the EBSD re -sults will permit the complete characterization of grain boundary geometry.
Un i v ersal sta g e The technique was first applied, on
the study of grain boundaries, by Kruhl & Peternell (2002) and later by Kuntcheva et al. (2006) and it allows the determination of the three-dimensional orientation of grain boundary planes on the micrometer-scale with acceptable accuracy. The procedure is rotating the sec-tion according to the U-stage axes until those segments which appear as diffuse bands become straight lines. The segments are visualized as diffuse bands because the grain boundary plane is tilted. When the section is rotated, the grain boundary plane becomes normal to the section plane and then the boundary segment ap-pears as a sharp line. In this position, its orientation is represented by the angle that the tilted position makes with the microscopy stage (horizontal position).
In figure 9 the procedure to obtain the grain boundaries orientations is illustrated. The first step is to
select a pair of grains and measure the c-axis orienta-tion of both. After that, the grain boundary shared by the two neighbor grains is divided in straight segments (or bands); select one of these segments and rotate it around a vertical axis of U-stage until the segment
ap-Figure 6 - Ready samples for the EBSD analyses. As it is recommended that the samples should not be covered by carbon, they are surrounded by me-tallic tape (a) and in the surface of the sample the section is bordered by carbon paint (b), so the elec-trons are not concentrated on the sample.
pears parallel to the vertical line of the cross hair (Fig. 9a). Thus, we determine the azimuth of the plane, which contains the segment. To determine its dip, the section
is rotated according to one of the horizontal axes of U-stage (Fig. 9 b-d). This method provides: (i) the orien-tation of grain boundary pole; (ii) the angles between
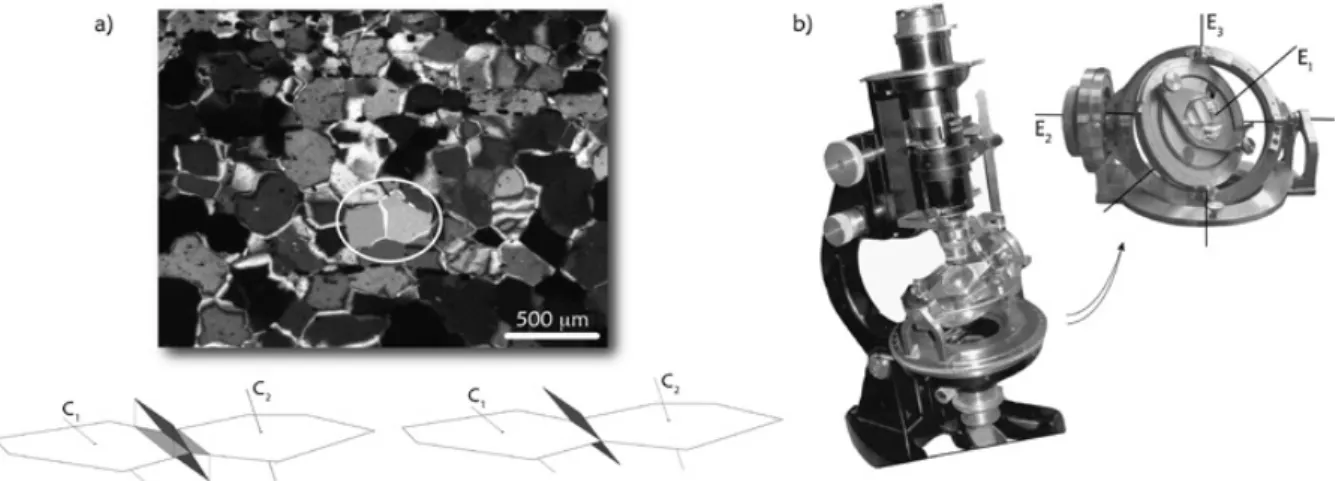
Figure 8 - a) Photomicrograph showing a region of a thicker section, in which two grains are circled and schematic illustrations of the relation between the grain boundary plane and the horizontal plane (section plane), reason due to which the boundary grain appears as diffuse bands; b) the U-stage coupled to the optical microscope, through which the grain boundary attitude can be determined.
Figure 9 - Photomicrographs and schematic illustrations of the procedure to obtain the grain bound-ary plane attitude; a) the grain boundbound-ary must be rotated until to be parallel to the vertical reticulum of the U-stage, 135º in the picture; b and c) the boundary is rotated according to horizontal axis of the u-stage, until to be orthogonal to the section plane, and then, visualized as straight lines (d – grain boundary pole attitude determined: 315/66); e) through of described routine, considering two neighbor grains, c-axes and the grain boundary pole attitude can be measured (C1, C2 and gbp); thus, the angular relations obtained are: the angles between the c-axes ; the angle
the c-axes of neighbor grains; (iii) the angle between grain boundary pole and the c-axes, and then, the an-gle between the plane that contains the grain boundary segment and the c-axes (Fig. 9e). Based on the angle between the c-axes of neighbor grains and the grain boundary pole it is possible to determine the crystal-lographic orientation of the grain interface with respect to each of the neighboring grains and as all measured parameters are indexed (Fig. 7), it is possible to estab-lish a safe correlation among the microstructures and texture of the aggregate.
RESTRICTIon oF THE METHoD Although through the optical method the spatial orientation of straight grain boundary segments can be measured, some re-strictions of measurements should be considered. As the u-stage tilting is restricted to, approximately, 45º, segments of planes dipping between 0 – 45º cannot be taken into the vertical position. Thus these segments
cannot be measured with sufficient accuracy. On the
other hand, if the grain boundaries are very irregular (lobated or serrated), the length of the grain boundary segment is too small, few micrometers, what can cause the interference between adjacent boundaries, mainly if these boundaries have low tilting angles. As these boundaries will be observed as diffuse belts, the limits of these belts cannot be determined precisely.
el ectron B a ck sca tterin g D i ffracti on The determi-nation of grain boundary orientation characterizes two
of the five degrees of freedom necessary to characterize
the grain boundary geometry. The other three are de-scribed for the angle/axis misorientation pair, between two neighbor grains, which share the same boundary. The misorientation axis is the axis according to which one lattice must be rotated so that it becomes coincident with the neighbor lattice, while the misorientation angle
is the angular difference between their spatial orienta-tions. To obtain these parameters we have used a Scan-ning Electron Microscope (JEOL 5510) equipped with an Electron Backscattering Diffraction system (HKL Technology), with the CHANNEL 5© application pack-age. The measurements of the crystallographic
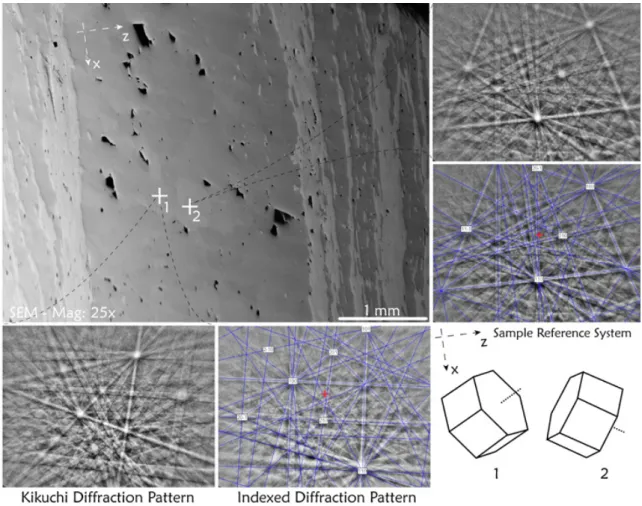
orienta-tions were made on a predefined surface of, approxi -mately, 15 mm2, at a magnification of 25X.
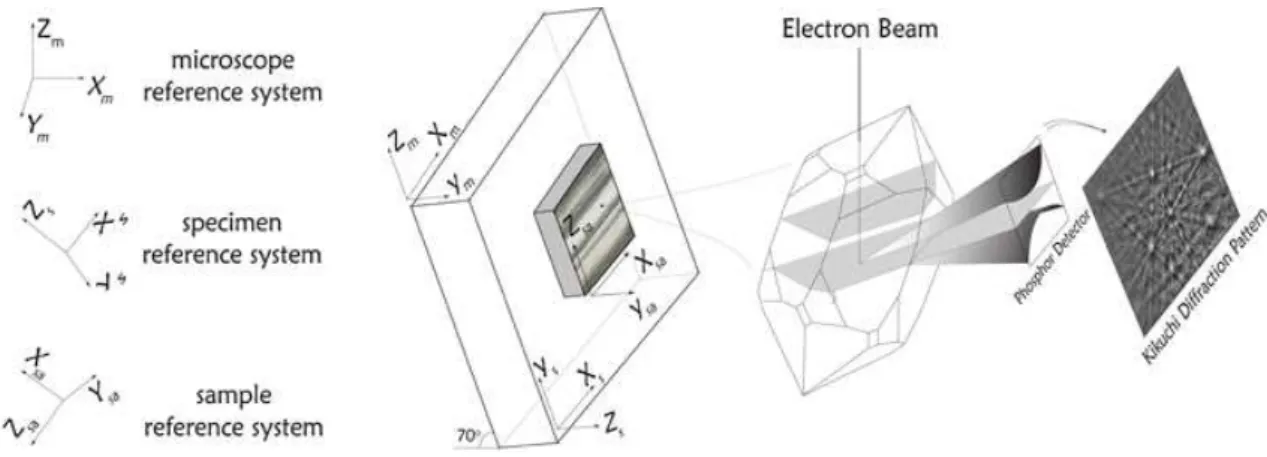
Initially, the sample must be carefully posi-tioned. It must be in front of the EBSD detector with an inclination of 70º (Prior et al. 1999, Humphreys 2001) and the three reference systems (sample reference sys-tem, specimen reference system and microscope refer-ence system) must be coincident or their angular rela-tions must be known (Fig. 10).
The EBSD technique allows a complete crys-tallographic orientation at the point struck by the elec-tron beam in the form of Euler angles. Initially, in each point, the data are resolved in a form of diffraction pattern, known as Kikuchi Diffraction Pattern (Ran-dle 1992 – Fig. 10). These diffraction patterns result from the interaction between the electron beam and the atomic planes of the crystal lattice. In a general way, the electrons interact with all crystallographic planes in each point hit by the beam, and backscattered elec-trons are diffracted and detected by the phosphor detec-tor. Then, the results are processed and represented in a form of Kikuchi bands, which are analyzed, indexed and processed by computational applications (Prior et al. 1999). So that the diffraction pattern can be indexed correctly, the equipment must be carefully calibrated. The distance between the sample and the point in which the electron beam is liberated, the work distance, must be carefully determined to assure the correct indexation. In this case we used a work distance of 35 mm and a
specific calibration was generated to this value.
The diffraction patterns acquired are compared
to a computer dataset allowing the determination of the crystallographic directions of crystal struck by the elec-tron beam. The crystallographic orientation is determined according to the sample reference system (coincident with specimen and microscope reference systems, in this case, Fig. 10). Therefore three angles are necessary to characterize crystal orientation in the space, which are known as the Euler angles (Randle 1992). Hence, the crystallographic orientation is represented as a set of
Euler angles, that correspond to specific rotations which
became possible to transform sample coordinate system into the crystal coordinate system and vice versa (Bunge
1982). The points are indexed consecutively and the step
size depends on the grain size, in this case the step size adopted was 10µm (Fig. 11).
The mathematical treatment of these data al-lows the determination of misorientation properties, to neighbor or random grains. The data can be presented
in a form of orientation contrast image, pole figures or inverse pole figures, in which orientation distribution
patterns of all crystallographic forms can be analyzed.
In the first case, the data is presented as an orientation
map with different colors to each pixel, depending on the crystallographic orientation of each indexed point. In the second situation, the crystallographic orientations are analyzed through diagrams in which they are
plot-ted according to sample reference system, as pole fig -ures diagram. In the last condition, the data are plotted according to the crystal reference system, i.e. as inverse
pole figures. In this case, it is necessary to fix any ex -ternal structure or an axis of the sample reference sys-tem, and then this parameter will be plotted according to the main crystallographic directions of the analyzed crystal. Lineation (X direction), foliation pole (Z direc-tion), grain boundary poles or any linear structure can
be plotted and presented as inverse pole figures. The figure 12 shows the representation of the main crystal -lographic forms of a quartz crystal.
Due to quartz symmetry, the crystallographic forms are repeated in six sectors, but only that which
appears in the right side of the figure is used in the in
-verse pole figures. The table 1 shows crystallographic forms plotted in the figure 12, as well as, their
Miller-Bravais indices and the angle between their poles and c-axis.
The interpolation between orientation data for consecutively indexed points allows the determi-nation of grain boundaries and grain boundary maps can be generated with an angular accuracy of 1º or less. Then, the degree of misorientation between those regions individualized as grains, neighbor or randomly, can be used to infer the grain boundaries
orientations (Humphreys 2001). The pair angle/axis of misorientation is used (Fig. 13).
According to Wheeler et al. (2001) and Lloyd (2004) the misorientation patterns should be analyzed as a microstructural parameter dependent on crystal-lography. The misorientation angles are represented as frequency histograms while the misorientation axes distribution should be evaluated according to sample
reference system (pole figures) and crystal reference systems (inverse pole figures).
The distribution pattern of angle/axis misorien-tation pair is common to any quartz aggregate (Wheeler
et al. 2001). What should vary in samples with different
grain boundaries configurations or samples submitted
to different deformational processes is the concentra-tion of misorientaconcentra-tion axis around determined crystal-lographic orientation. Therefore, the misorientation information is used to put some constrain on the defor-mation mechanism at grain scale. Physically and trigo-nometrically, these data represent the surface shared by two contiguous grains (Fig. 13) and then the pair axis/ angle of misorientation should be enough to character-ize, statistically, the grain boundary geometry (Randle 1992), although the grain boundaries orientations can be inferred from these data but not directly measured.
METHoD RESTRICTIon The main restriction of EBSD is that it is not possible to measure the
orien-tation of grain boundary yet. Therefore the use of U-stage is necessary for a complete data acquisition of
grain boundary configuration. Although through EBSD
technique is possible to analyze hundreds of grains in few hours, this technique only allows a statistic
treat-ment of the data, which is not sufficient to determine
precisely the grain boundary distribution, particularly when the boundary geometry is the aim of the study. Also, through the misorientation analysis, it is not pos-sible yet to generate a map where we can determine, to each grain boundary, its relative crystallographic orien-tation to the both grains limited for it, something that can be done with the u-stage.
When the EBSD technique is used, although the data acquisition is punctual, their treatment is global. Therefore, there is not a direct control between grain boundary morphology and its crystallographic orienta-tion, the mesotexture of the aggregate (Randle 1992). Besides, it is necessary to mention the procedures to sample preparation, once the surface of the analyzed samples through EBSD technique must be free of any irregularity. To attend this exigency the sample must be carefully prepared, increasing the costs of the procedure and the time required in the initial steps of the work.
U- sTAge AND eB sD As cO mPl emeNTAR y TechNIqUes When optical microscopy is used, through mosaics of photomicrographs, a segmented
im-Figure 12 - Main crystallographic forms to quartz grain, in detail the sector used to ana-lyze the distribution of rock structures according to main crystallographic forms to quartz
age is generated based on the grain boundaries, which allows that grain size distributions, the axial ratios and shape-preferred orientation are analyzed. On the other hand, using the U-stage, it is possible to measure the distribution patterns of crystallographic orientations of the grains and their boundaries, data presented through
pole figures (stereograms) and rosettes. As all grains
whose boundaries planes and c-axis were measured are indexed, as well as their boundaries segments (Fig. 7), their orientations can be analyzed individually or es-tablishing relations between them. The length of grain boundary segments and the angular relation between the measured parameters (grain boundary pole and c-axis) are represented in frequency histograms, which allows the separation of grain populations with similar charac-teristics, such as microstructures, crystallographic
ori-entations and grain boundary configuration. This is the
main advantage of the U-stage use, once through the angle between the grain boundary pole and the c-axis of
the grain limited for this boundary, the crystallographic plane represented for that boundary can be directly de-termined. However the EBSD can provide the complete orientation of a crystal, while in the u-stage only the optical axis orientation can be measured or, in some special circumstances, the a-axis orientation (Rosin et al. 2004). Hence, the combined use of both techniques allows the determination of grain boundary orientation, its crystallographic relation with both grains limited by it and the characterization of slip systems active dur-ing the deformational processes (Wheeler et al. 2001, Kruhl & Peternell 2002, Lloyd 2004, Kuntcheva et al. 2006). In the figure 14, there is a convention that can be
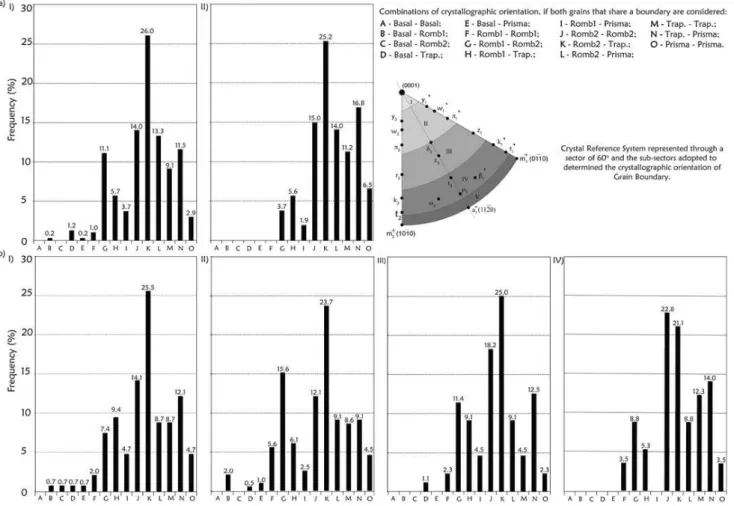
adopted to determine the crystallographic orientation of grain boundary plane from u-stage data. The sector
showed in the figure 12 was divided in sub-sectors ac -cording to intervals of angles used to analyze the ob-tained data in the u-stage, based on the angular relation between the pole of crystallographic plane and c-axis.
Then, all crystallographic forms in sub-sector II and III are considered rhombohedral forms, although Nicolas & Poirier (1976) consider as sub-basal forms, those surfaces with angular relation up to 30o; poles in sub-sector IV are considered trapezohedral forms and those in sub-sector V are prismatic forms. As the pre-sented sector is used to analyze the distribution pattern of any linear structure in the mineral aggregate accord-ing crystal reference system, is important to correlate it with the angular intervals used to treat the data obtained via u-stage, so that the results achieved with the u-stage and EBSD can be correlated.
Therefore, although the orientation of all crys-tallographic planes can be measured, with the EBSD, the orientation of the grain boundary plane cannot be obtained directly and individually. Then, in this case, it is necessary to analyze the misorientation relation be-tween the grains. Thus, the pair angle/axis misorienta-tion should be measured and analyzed, because their distribution pattern jointly with the distribution patterns of crystallographic forms allow the determination of ac-tivated slip system and, consequently, the interpretation
Table 1 - The crystallographic forms showed in figure
12 (*angles between the pole of crystallographic form and the c-axis) (nicolas & Poirier 1976, Linker & Kir-by 1984, nesse 2000, Lloyd 2004).
of grain boundary orientation (considering plastically deformed aggregates, Lloyd 2004).
Even that the integration of all those data ob-tained via EBSD allows a complete analysis of the relationships between crystal lattices, grain boundary orientations are treated indirectly, because the interfa-cial boundary cannot be measured in the EBSD. Grain boundaries are mapped out automatically in the EBSD, but the equipment cannot resolve spatially the orienta-tion of grain boundary once they are interpolated be-tween two neighboring phases with pre-determined
orientation contrast (> 10˚, for example). Therefore, to
overcome this limitation of the EBSD technique the U-stage should be used, since it allows the spatial control of orientations of grain boundary interfaces and then, these techniques should be treated as complementary and not as substitutive methods.
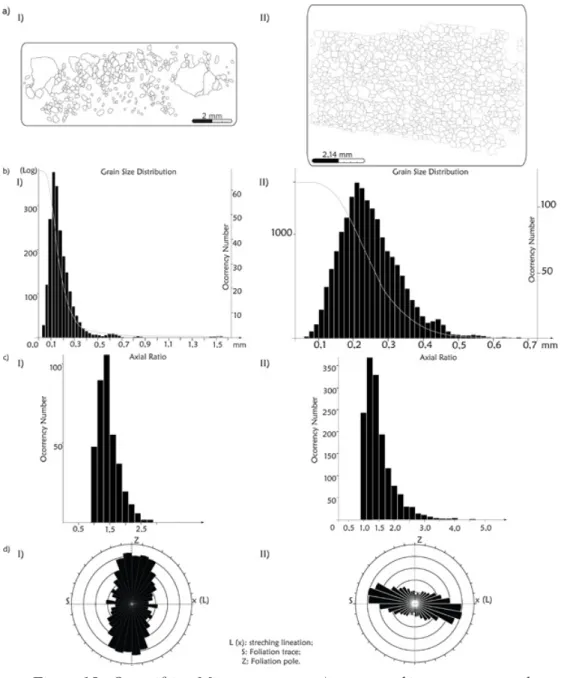
AN eXAmPl e O F gR AIN B O UND AR y PAT-TeR N chAR AcTeR IZATIO N Quartz aggregates, which came from banded iron formation of Quadri-látero Ferrífero region, were analyzed, considering the metamorphic gradient from west to eastern areas of the region that has been characterized for researchers (Pires 1995, Rosière 2001). The data relative to microstruc-tural features are presented through mosaics, frequency histograms and rosettes (Fig. 15). Taking into account the quartz aggregates from different metamorphic and deformational contexts, the aim is to compare the grain size distribution (Fig. 15 b, I-II), the axial ratio of the grains (Fig. 15 c, I-II), as well as their shape-preferred orientation (Fig. 15 d, I-II) and associate these data with the grain boundary geometry and its orientation pattern
(Castro 2007, Castro & Lagoeiro 2008). Through the
presented data, it is clear that the grains become larger and the axial ratio decreases from lowest temperature condition to higher temperature levels. As for the anal-ysis of grain boundary microstructures it is necessary to combine the U-stage and EBSD data these data will be treated separately.
The distribution patterns of crystallographic
ori-entation must also reflect the increase in the metamor -phic conditions. Then, the preferred orientations must become stronger from lower to higher temperature lev-els and the crystal plastic processes responsible for the
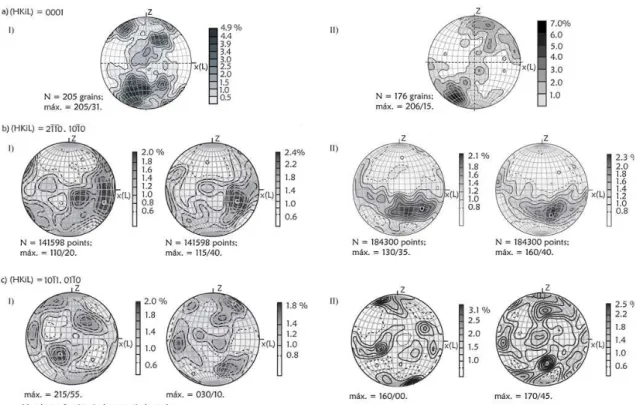
recrystallization of the aggregates must reflect the re -gional deformational conditions. These data, obtained mainly via EBSD once only c-axes distribution patterns can be easily determined using U-stage, are presented
in the figure 16, as pole figures. It is clear that the
c-axes distribution pattern become more concentrated for the higher metamorphic conditions and it indicates that the metamorphism increases once a Type II crossed gir-dle become an asymmetrical single girgir-dle for the higher
temperature levels (Schmid & Casey 1986) (Fig. 16 a, I-II). The distribution patterns identified for the poles of
prismatic planes are in agreement with the metamorphic gradient (Fig. 16 b, I-II). In the lower temperature condi-tions, the poles are distributed according to wide girdle, with broad spreading, but the maximum concentration is close to stretching lineation (Fig. 16 b, I). This textural pattern is compatible with the activation of slip system according to basal planes, what is in agreement with the c-axes distribution pattern, whose maxima concentration forms high angle with the rock foliation (Fig. 16 a, I). This is a typical crystal plastic process in low
metamor-phic condition (Schmid & Casey 1986, Law et al. 1990, Law 1990, Hirth & Tullis 1992, Stipp et al. 2002). In the higher metamorphic condition the preferred orientations become stronger once the girdle generated for the poles
of prisms is better defined (Fig. 16 b, II). The orientation
patterns of poles of rhombohedral planes, although show a wide dispersion, become stronger in the domain with higher temperature condition, in agreement with the fur-ther textural data (Fig. 16 c, I-II).
Besides pole figures, orientation contrast imag -es and orientation contrast maps can be generate, which can illustrate the preferred orientation of the grains (Fig. 17 a-b). It’s necessary to consider that in the orientation contrast image, or forescattering image, the differences
Figure 14 - Angular intervals used to determine the crystallographic orientation of grain
in gray scale represents different crystallographic ori-entations, but the color intensity is not directly related
with the angular misfit. Other factors interfere in the
gray scale, for example, the depth reached for the elec-tron beam in the sample. However, for the orientation contrast map, the colors are directly related with the angular difference among the grains. In addition to the mentioned data, the rock structures can be plotted
ac-cording to crystal reference system, as inverse pole fig -ures. Then, it is possible to analyze according to what crystallographic direction a rock structure, lineation or foliation pole, for example, is oriented. In this case, the mineral lineation is preferentially oriented according to poles of trapezohedral planes for lower metamorphic conditions and rhombohedral planes for the higher lev-els, although wide spreading is observed (Fig. 17 c-d).
To determine the five parameters required for the
grain boundaries arrangement characterization we have used the U-stage and EBSD simultaneously. Two of the
five parameters are determined when the geometry and
orientation patterns of boundary surfaces are character-ized, using the U-stage. Considering the straight grain boundary segments the orientations of their correspon-dent grain boundary surfaces are determined and then the orientation patterns of boundary poles and rosettes showing the orientation of grain boundary segments are
analyzed (Fig. 18 a-b, I-II). Besides, the length of grain
boundary segments are measured and plotted as
histo-grams (Fig. 18 a-b, III). Based on the figure 18, it is
clear that in the higher metamorphic condition, the grain
boundary become larger (Fig. 18 a-b, III) and boundar -ies at high angle with the rock foliation appear, while in the lower temperature conditions those boundaries parallel to the rock foliation predominate widely (Fig.
Figure 16 - Crystallographic orientation patterns, according to sample reference
sys-tem: x(L) – stretching lineation; Z – foliation pole; a) orientation patterns of c-axes; b)
orientation patterns of poles of prisms; c) orientation patterns of poles of rhombs; I)
lower metamorphic conditions; II) higher metamorphic conditions.
18 a-b, I-II). Moreover, if the c-axes distribution pattern
is considered (Fig. 16 a-b, I) the grain boundaries orien-tations evince the preferential occurrence of boundaries at high angle with the c-axes in the low metamorphic condition and the arising of boundaries forming lower angles with the c-axes in the higher temperature levels.
This configuration becomes clearer when the angles be -tween the c-axes and grain boundary poles are analyzed
(Fig. 18 a-b, IV).
The histograms in the figure 18 (a-b, IV) show
that, virtually, the poles of grain boundaries can present any angular relation with the c-axes. This orientation pattern indicates grain boundary planes oriented accord-ing to any crystallographic form. However, when the grain boundary plane orientation is analyzed for each grain delimited for it, such boundary represents prefer-entially a rhomb plane to one grain and a trapezohedral to its neighbor (Fig. 19). Besides, as the grain boundary segments lengths are measured it is possible to analyze the grain boundary orientation to different intervals
of their lengths, what is represented in the figure 19.
Comparing the histograms, we observe that a bound-ary never represents a basal plane for both grains that share it. Moreover, those boundaries, which represent rhombohedral (Rhomb2 – Fig. 14) and trapezohedral planes, become larger in detriment of those oriented ac-cording to basal and Rhomb 1 (Fig. 14) planes. In the higher metamorphic domain, where the larger boundar-ies measured occur, there is a tendency to the boundary represent the same crystallographic plane for the grains that share it (Fig. 19 - IV), what can indicate the occur-rence of twin surfaces between the lattices.
Two of the five parameters required to grain
boundary characterization were determined, but the other three are related with the misorientation among the grains, obtained by EBSD technique. The misori-entation angles should be analyzed for neighbor and random grains once the difference in their distribution indicates the correlation between neighbor grains due to recrystallization, nucleation, growth twinning or
chanical twinning (Wheeler et al. 2001). Then, using histograms (Fig. 20 a-b), we observe that the difference in the misorientation angles distribution between neigh-bor and random grains become stronger in the high metamorphic level. Besides, there is a maxima point at 55-60o, being that for this angles the misorientation axes are parallel to the c-axes (inverse pole figures in the figure 20), what correspond to the operation of Dau -phiné twin. On the other hand, for angles between 35 and 40o the misorientation axes can be oriented accord-ing to <a> direction, what is not waited once this must be the main slip direction for the crystallographic pat-terns observed (Lloyd 2004). This pattern should indi-cate the occurrence of secondary processes, here inter-preted as bulging process (Stipp et al. 2002). As this is a typical process of lower metamorphic condition, the occurrence of misorientation axes orientated according to <a> direction should decrease in the higher
tempera-ture levels, what is observed when the inverse pole fig
-ures in the figure 20 (a-b) are compared.
cO Ncl UsIO Ns The aim of all processes devel-oped during the deformation of mineral aggregates is to recover stabler energy stages and in this sense the grain boundary arrangement is fundamental. The grain
bound-ary surfaces represent the adjustment between neighbor lattices and as they should be treated as discontinuities
between adjacent crystals, they have a wide influence
on the physical, chemical and mechanical properties of mineral aggregates. However, the characterization of grain boundaries geometry and their preferred ori-entation in different deformational and metamorphic contexts remain poorly understood, due, mainly, to
difficulties to determine all parameters required for a
complete boundary characterization. In this sense, the methodology presented should become a useful method for grain boundary analysis once a complete boundary characterization is made:
i) Analysis of grain boundary geometry and their orientation, according to sample reference system and crystal reference system; ii) Determination and analysis of misorientation relations: angle/axis misori-entation pair; iii) Characterization of those textural pa-rameters for different metamorphic and deformational contexts, what allows to recognize grain boundaries arrangement for different tectometamorphic condition; iv) Association between physical properties of the ag-gregates and different grain boundaries arrangement; v) Determination of grain boundary arrangements that imply lowest energy levels for the mineral aggregates;
R eferen ces
Alkmim F.F. & Marshak S. 1998. Transamazonian Orogeny in the Southern São Francisco Craton Region Minas Gerais Brazil: evidence for Paleoproterozoic collision and collapse in the Quadrilátero Ferrífero. Precambrian Research, 90:29-58.
Bunge H.J. 1982. Texture Analysis in Materials Science. London: Butterworths. (Reprint: Cuvillier Verlag, Göt-tingen. 1993).
Castro C.P. 2007. Microestruturas e Textura de Equilíbrio em Quartzo Recristalizado. Dissertação de Mestrado, Ufop, 150p.
Castro C.P. & Lagoeiro L.E. 2008. Grain Boundary Patterns in Dynamically Recrystallized Quartz Aggregates. In: Rollett A. D. Applications of Texture Analysis: Ceramics
Transactions, 2 01:251-260.
Dingley D.J., Baba-Kishi K.Z., Randle V. 1995. Atlas of Backscattering Kikuchi Diffraction Patterns. Institute of Physics Publishing, Bristol and Philadelphia, 135p. Fynn G.W. & Powell W.J.A. 1979. The Cutting and
Polish-ing of Electro-optic Materials. Adams Hilger, London, 216p.
Heilbronner R. & Tullis J. 2002. The effect of static anneal-ing on microstructures and crystallographic preferred orientations of quartzites experimentallyy deformed in axial compression and shear. In: de Meer S., Drury M.R., de Bresser J.H.P., Pennock G.M. (eds.) Deforma-tion mechanisms, Rheology and Tectonics: current status and future perspectives. Geological Society of London, vi) Characterization of grain boundary geometry and its
orientation pattern for aggregates submitted to different recovery processes.
Acknowledgment The authors would like to thank Luiz Fernando Grafulha Morales and Leonardo
Eu-stáquio for helpful discussions as well as for the
as-sistance during sample preparation. The financial
support by the National Council for research and Technology Development (CNPq) is gratefully ac-knowledged.
Special Publication, 2 00:191-218.
Hippertt J., Lana C., Takesgita T. 2001. Deformation parti-tioning during folding of banded iron formation. Journal of Structural Geology 2 3:819-834.
Hirth G. & Tullis J. 1992. Dislocation creep regimes in quartz aggregates. Journal of Structural Geology, 14 :145-159. Humphreys F. J. 2001. Review – Grain and subgrain
charac-terization by electron backscatter diffraction. Journal of Material Science, 36:3833-3854.
Kruhl J.H. 1996. Prism- and basal-plane glide parallel sub-grain boundaries in quartz: a microstructural geothermo-batometer. Journal of Metamorphic Geology, 14 :581-589.
Kruhl J.H. & Peternell M. 2002. The equilibration of high-angle grain boundaries in dynamically recrystallized quartz: the effect of crystallographic and temperature. Journal of Structural geology 2 4:1125-1137.
Kuntcheva B., Kruhl J.H., Kunze K. 2006. Crystallographic orientations of high-angle grain boundaries in dynami-cally recrystallized quartz: first results. Tectonophisics 4 2 1:331-346.
Lagoeiro L. 1998. Transformation of magnetite to hematite and its influence on the dissolution of iron oxide miner-als. Journal of Metamorphic Geology, 16:415-423. Law R.D. 1990. Crystallographic fabrics: a selective review
of their applications to research in structural geology. In: Knipe R.J. & Rutter E.H. (eds.) Deformation Mecha-nisms, Rheology and Tectonics. The Geological Society of London Special Publication, p. 335-352.
Law R.D., Schmid S.M., Wheeler J. 1990. Simple shear de-formation and crystallographic fabrics: a possible nat-ural example from the Torridon area of NW Scotland. Journal of Structural Geology, 12(1):29-45.
Linker M.F., Kirby S.H. 1984. Effects of compression di-rection on the plasticity and rheology of hydrolitically weakened synthetic quartz crystals at atmospheric pres-sure. Journal of Geophysical Research, 89:4241-4255. Lloyd G. E. & Freeman B. 1991. SEM electron channeling
analysis of dynamic recrystallization in a quartz grain. Journal of Structural Geology, 13(8):945-953.
Lloyd G. E., Farmer A.B., Mainprice D. 1997. Misorientation Analysis and the formation and orientation of subgrains and grain boundaries. Tectonophysics, 2 79:55-78. Lloyd G.E. 2004. Microstructural evolution in a mylonitic
quartz simple shear zone: the significant roles of dau-phine twinning and misorientation. In: Alsop G.I., Hold-sworth R.E., McCaffrey K.J.W., Hand M. (eds.) Flow Processes in Faults and Shear zone. Geological Society, London, Special Publication 2 2 4:39-61.
Mainprice D. H., Lloyd G. E., Casey M. 1993. Individual orientation measurements in quartz polycrystals – ad-vantages and limitations for texture and petrophysical property determinations. Journal of Structural Geology, 15:1169-1187.
Nesse W.D. 2000. Introduction to Mineralogy. New York, Oxford University Press, 442p.
Nicolas A. & Poirier J. P. (eds.) 1976. Crystalline Plasticity and Solid State Flow in Metamorphic Rocks. London, John Wiley & Sons, 444p.
Passchier C.W. & Trouw R.A.J. (eds.) 1996. Microtectonics.
2nd., Springer Berling, 289p.
Pires F.R.M. 1995. Textural and Mineralogical variations dur-ing metamorphism of the proterozoic Itabira iron Forma-tion in the Quadrilátero Ferrífero, Minas Gerais, Brazil. Anais Academia Brasileira de Ciências 67(1):77-105. Prior D.J., Boyle A.P., Brenker F., Cheadle M.C., Day A.,
Lopez G., Potts G.J., Reddy S., Spiess R., Timms N., Trimby P., Wheeler J., Zetterstrom L. 1999. The appli-cation of electron backscatter diffraction and orienta-tion contrast imaging in the SEM to textural problems in rocks. American Mineralogist, 84 :1741-1759.
Prior D.J., Wheeler J., Peruzzo L., Spiess R., Storey C. 2002. Some garnet microstructures: an illustration of the po-tential of orientation maps and misorientation analysis in microstructural studies. Journal of Structural Geology, 2 4:999-1011.
Randle V. 1992. Mirostexture determination and its applica-tions. Bourne Press, Great Britain, 174p.
Randle V. & Engler O. 2000. Introduction to Texture Analy-sis. Macrotexture, Microtexture & orientation Mapping. London, CRC, p. 408.
Rosière C.A., Siemes H., Quade H., Brokmeier H.G., Jan-sen E.M. 2001. Microstructure, texture and deformation mechanism in hematite. Journal of Structural Geology, 2 3:1429-1440.
Rosin S. M., Johnson E. L., Mancktelow N. 2004. An opti-cal method for the determination of <a> axis orientations in deformed aggregates of quartz. Journal of Structural Geology, 2 6:2059-2064.
Schmid S.M. & Casey M. 1986. Complete fabric analysis of some commonly observed quartz c-axis patterns. In: Hobbs B.E. & Heard C. (eds.) Mineral and Rock De-formation: Laboratory Studies – The Paterson Volume. American Geophysical Union, Geophysical Monograph, 36:263-286.
Spry A. 1983. Metamorphic Textures. Inglaterra, Pergamon Press, 352p.
Stipp M., Stünitz H., Heilbronner R., Schmid S.M. 2002. The eastern Tonale fault zone: a ‘natural laboratory’ for crystal plastic deformation of quartz over a temperature range from 250 to 700° C. Journal of Structural Geol-ogy, 2 4:1861-1884.
Tullis J., Christie J.M., Griggs D.T. 1973. Microstructures and preferred orientations of experimentally deformed quartzites. Geological Society of America Bulletin, 84:297-314.
Twiss R. J. & Moores E. M. 1992. Structural Geology. New York, W.H. Freeman and Company, 532p.
Wheeler J., Prior D.J., Jiang Z., Spiess R., Trimby P.W. 2001. The petrological significance of misorientations between grains. Contrib. Mineral Petrology, 14 1:109-124. Wheeler J., Jiang Z., Prior D.J., Tullis J., Drury M.R., Trimby
P.W. 2003. From Geometry to dynamics of microstruc-ture: using boundary lengths to quantify boundary mis-orientations and anisotropy. Tectonophysics, 376:19-35.
ma n u scrito ID 984 1 su bm eti do em 27 de nov em bro de 2007