QUANTITATIVE ASSAY OF
ALMOTRIPTAN MALATE IN PURE
DRUG AND PHARMACEUTICAL
PREPARATIONS USING SIMPLE AND
CONVENIENT VISIBLE
SPECTROPHOTOMETRIC METHODS
U. VIPLOVA PRASAD*1, M. SYAM BAB1, B. KALYANA RAMU21. Department of Organic Chemistry& Analysis of Foods Drugs &water Laboratories, School of Chemistry, Andhra University, Visakhapatnam-530003 Andhra Pradesh (India)
2. Department of Chemistry, Maharaja’s College (Aided & Autonomous), Vizianagaram-535002, AP (India) [email protected]
2. ABSTRACT
Two direct, simple and sensitive visible spectrophotometric methods (M1&M2) are described for the assay of
almotripan malate in pure and solid dosage forms. The method M1 involves oxidative coupling of drug with
brucine in presence of sodium meta periodate and purple red colored species is formed and exhibits absorption maxima at 520nm. The method M2 is based on the formation of yellowish brown colored species by the drug
with Folin reagent and exhibits absorption maxima at 450nm. Regression analysis of Beer-Lambert plots showed good correlation in the concentration ranges (8.0-24) µg/ml for method M1, (16-48) µg/ml for method
M2 respectively. The proposed methods are applied to commercial available tablets and the results are
statistically compared with those obtained by the reported UV reference method and validated by recovery studies. The results are found satisfactory and reproducible. These methods are applied successfully for the estimation of the almotriptan malate in the presence of other ingredients that are usually present in dosage forms. These methods offer the advantages of rapidity, simplicity and sensitivity and normal cost and can be easily applied to resource-poor settings without the need for expensive instrumentation and reagents.
3. Key words: Anti-migraine, BCN-IO4-, Folin reagent, Nucleophillic substitution, Oxidative coupling,
Statistical analysis, Triptans.
4. INTRODUCTION
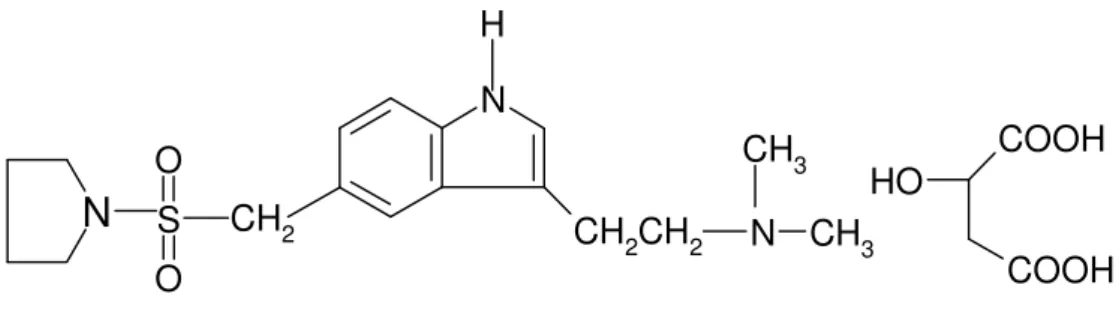
Almotriptan malate (AM) (Fig.1) is a selective and potent serotonin 5-hydroxy trytamine1B/1D (5-HT 1B/1D) receptor agonist. It is chemically designated as 1[[[3-[2-(Di methyl amine) ethyl]-1H-indol-5-yl] methyl] sulfonyl] pyrrolidine ± - hydroxy butanedioate1 (1:1). Its empirical formula is C17H25N3O2S.C4H6O5
N
CH
2CH
2CH
2N CH
3
H
S
O
O
CH
3N
H
O
COOH
COOH
Fig. 1: Chemical structure of Almotriptan malate
In literature, several analytical methods such as HPLC2-3, HPTLC4, HPLC-MS/MS5, LC-ESI-MS/MS6, UV Spectrometric 7-8 and Fluorometric and Coloricmetric9 have been reported for the determination of AM in biological fluids (considerable more) and formulations (less). Even though there is one visible spectrophotometric method using TCNQ reported for the determination of the drug they are tedious and less specificity and the functional groups present in the drug not fully exploited. For routine analysis, simple, rapid and cost effective visible spectrophotometric methods are required and preferred. Nevertheless, there still exists a need for development of sensitive accurate and flexible visible spectrophotometric methods for the determination of AM in pharmaceutical preparations. So the authors have made some attempts in this direction and succeeded in developing two methods based on the reaction between the drug and BCN-IO4- reagent 10 (M1)
or Folin reagent 11 (M2) under specified experimental conditions.
The proposed methods for AM determination have many advantages over other analytical methods due to its rapidity, normal cost and environmental safety. Unlike HPLC, HPTLC procedures, the instrument is simple and is not costly. Economically, all the analytical reagents are inexpensive and available in any analytical laboratory. These methods can be extended for the routine quality control analysis of pharmaceutical products containing AM.
5. MATERIALS & METHODS (EXPERIMENTAL) Apparatus and chemicals
A Milton Roy UV/Visible spectrophotometer model-1201 with 10mm matched quartz cells was used for all spectral measurements. A Systronics digital pH meter mode-361 was used for pH measurements. All the chemicals used were of analytical grade. AXERT tablets procured from Ortho Mc Nell Pharmaceuticals, USA. Aqueous solution of brucine ( Loba, 0.2%, 506.7x10⁻³M prepared by dissolving 200mg of brucine initially in minimum amount of 0.16M sulphuric acid and then made up to 100ml with distilled water), sodium metaperiodate (BDH, 0.2%, 9.35x10⁻³M prepared by dissolving 200mg of sodium metaperiodate in 100ml distilled water and standardized iodometrically) and sulphuric acid (Qualigens,1.2M prepared by diluting 126ml of conc. H2SO4 to 100ml of distilled water initially, followed by diluting to 1000ml with distilled water) were
prepared for method M1.
Folin reagent (NQS) solution (Loba, 0.5%, 1.92x10⁻²M prepared by dissolving 500mg of NQS in 100 ml of distilled water ), pH 8.0 buffer solution (prepared by mixing 30ml of potassium hydrogen phosphate (0.067M) and 970ml of disodium hydrogen phosphate (0.067M) and the pH of the solution was adjusted to 8.0) were prepared for method M2.
Preparation of Standard stock solution: The standard stock solution (1mg/ml) of AM was prepared by dissolving 100mg of AM in 100 ml distilled water. The working standard solutions of AM were obtained by appropriately diluting the standard stock solution with the same solvent (M1- 200 µg/ml & M2- 400 µg/ml). The
prepared stock solution was stored at 4⁰ C protected from light. From this stock solution, a series of standards were freshly prepared during the analysis day.
Preparation of Sample solution: About 20 tablets were weighed to get the average tablet weight and pulverized. The powder equivalent to 100mg of AM was weighed, dispersed in 25ml of Isopropyl alcohol, sonicated for 15 minutes and filtered through Whatman filter paper No 41.The filtrate was evaporated to dryness and the residue was dissolved as under standard solution preparation.
Determination of wavelength maximum (λmax):
Method M1:The 3.0ml of working standard solution of AM (200µg/ml) was taken in 25ml calibrated tube. To
this, 3.0ml brucine, 1.5ml of NaIO4 solution and 2.0ml of sulphuric acid were added successively and the
development .The solution was cooled to room temperature and the volume was made up to the mark with distilled water. In order to investigate the wavelength maximum, the above colored solution was scanned in the range of 400-660 nm UV-Visible spectrophotometers against a reagent blank. From the absorption spectra (Fig.2), it was concluded that 520 nm is the most appropriate wavelength for analyzing AM with suitable sensitivity.
Fig.2: Absorption spectra of AM-BCN-IO4-
Method M2: The 3.0 ml ofworking standard solution of AM (400µg/ml) was taken in 25ml standard flask. To
this, 1.0ml of folin reagent (1.092x10⁻²M), 5.0 ml of buffer pH 8.0 and 1.5ml of distilled water were added and kept aside for 15 min for complete color development. Then the volume was made up to 25 ml using distilled water and sonicated for 1 min. In order to investigate the wavelength maximum, the above standard stock solution was scanned in the range of 360-560nm by UV-Visible spectrophotometer. From the spectra (Fig.3), it was concluded that 450nm is the most appropriate wavelength for analyzing AM with suitable sensitivity.
Fig.3: Absorption spectra of AM-NQS
Preparation of calibration curve: Aliquots of the standard AM solution [1.0-3.0ml, 200µg/ml (method M1),
400µg/ml (method M2)] were placed in a series of 25ml standard flask. Then 3.0ml brucine, 1.5ml of NaIO4
solution and 2.0ml of sulphuric acid were added successively and the volume was brought up to 10ml with distilled water and kept in boiling water bath for 15min. for complete color development. The solution was cooled to room temperature and the volume was made up to the mark with distilled water (method M1)or
1.0ml of folin reagent (1.092x10⁻²M), 5.0 ml of buffer pH 8.0 and 1.5ml of distilled water were added and kept aside for 15 min for complete color development. Then the volume was made up to 25 ml using distilled water
0 0.1 0.2 0.3 0.4
380 430 480 530 580
Absorbance
Wavelength
AM-BCN-IO4
-blank vs water
Drug vs Blank
0 0.05 0.1 0.15 0.2 0.25
360 410 460 510 560
Absorbance
Wavelength AM-NQS
blank vs water
and sonicated for 1 min. (methodM2) The absorbance was measured at 520nm (method M1) or 450 nm (method
M2) against a reagent blank within the stability period (5minutes to 30min). The calibration graph was
constructed by plotting the drug concentration versus absorbance (Fig.4&5). The amount of drug was computed from its calibration graph.
Fig.4: Beer’s Law plot of AM-BCN-IO4- Fig.5: Beer’s Law plot of AM-NQS
6. RESULTS AND DISCUSSION
In the present investigation, the presence of cyclic imino group in indole moiety of AM permits the development of visible spectrophotometric methods for its determination through the oxidative coupling reaction with BCN-IO4- reagent (M1) or the nucleophillic substitution with folin reagent (M2).
Optimum operating conditions used in the procedure were established adopting variation of one variable at a time (OVAT) method. The effect of various parameters such as time, volume and strength of reagents, the order of addition of reagents, pH buffer solutions and solvent for final dilution of the colored species were studied. The other oxidants such as Fe (III), Cr (IV), IO3-, and S2O8-2 were tried in place of NaIO4 and found to be
inferior incase of method M1. Distilled water was found to be best solvent for final dilution. Other water
miscible solvents like methanol, ethanol, propan-2-ol and acetonitrile have no additional advantage in increasing the intensity of the color in both methods. The optical characteristics such as Beer’s law limit, Sandell‘s sensitivity, molar absorptivity, percent relative standard deviation, (calculated from the six measurements containing 3/4th of the amount of the upper Beer’s law limits), Regression characteristics like standard deviation of slope (Sb), standard deviation of intercept (Sa), standard error of estimation (Se) and % range of error (0.05
and 0.01 confidence limits) were calculated and the results are summarized in Table-1.
Commercial formulations containing AM were successfully analyzed by the proposed methods. The values obtained by the proposed and reference methods for formulations were compared statistically by the t-and F-test and found not to differ significantly. As an additional demonstration of accuracy, recovery experiments were performed by adding a fixed amount of the drug to the pre analyzed formulations at three different concentration levels. MS Excel Software-2007 used for calculations and graphs. These results are summarized in Table-2. Chemistry of colored species: In method M1, the dimethoxy benzene nucleus of brucine is attacked by IO4
-with the formation of o-quinone (bruciquinone) which in turn undergo nucleophillic attack on the most electron-rich position of the coupler (cyclic imino group in indole moiety of AM) to give 1-monosubstituted bruciquinone derivative(purple red colored species) . In method M2, yellowish brown colored species (N-alkyl
amino napthaquinone) was formed by replacement of the sulphonate group of the napthaquinone sulphonic acid by a secondary amino group of drug. The formation of colored species with these reagents may be assigned through above analogy as shown in Scheme (Fig.6).
y = 0.021x - 0.102 R² = 0.998
0 0.05 0.1 0.15 0.2 0.25 0.3 0.35 0.4 0.45
0 10 20 30
Absorbance
Concentration
AM-BCN-IO4-y = 0.011x - 0.075 R² = 0.998
0 0.05 0.1 0.15 0.2 0.25 0.3 0.35 0.4 0.45 0.5
0 20 40 60
Absorbance
N
MeO
MeO
O
O
O
O
N
O
O
N
Brucine
NaIO
4H
2SO
4N
Bruciquinone
O
O
N
N
N
O
O
R1
+
Bruciquinone
R
AM
Drug analyte
1-mono substituted Bruciquinone derivative
(Colored species)
O
O
SO
3Na
N
R
R1
H
N
O
O
R
R1
CH
2.CH
2.N(CH
3)
2CH
2SO
2N
+
NQS
N-alkyl amino napthaquinone
R=
R1=
(Folin reagent)
AM
Colored species
(
)
Drug analyte
7. CONCLUSION
The proposed methods applicable for the assay of drug, the advantage of wider range under Beer’s law limits, validated as per ICH guide lines and possess reasonable precision, accuracy, and simple, sensitive. These methods can be extended for the routine assay of AM formulations.
8. ACKMOWLEDGEMENTS
The authors (MS Bab & BKR) are thanks to the University Grants Commission, New Delhi for providing financial assistance under teacher fellow ship and also thanks to University authorities for providing necessary facilities in this work.
9. REFERENCES
[1] Maryadele JON. The Merck Index 14 th ed., Merck &Co Inc., New Jersey, 2006.
[2] Suneetha A and Syamsundar B. A validated RP-HPLC method for estimation of almotriptan maleate in pharmaceutical dosage form.
Journal of the Chinese Chemical society. 57 (5A); 2010: 1067-1070.
[3] Kumar AP, Ganesh VRL, Subba Rao DV, Anil B, Venu gopal rao B, Hari Krishna VS. A validated RP-HPLC method for
determination of process related impurities in almotriptan maleate API. Journal of Pharmaceutical & Biomedical Analysis. 46(4); 2008: 792-798.
[4] Suneetha A and Syamsundar B. Development and validation of HPTLC method for the estimation of almotriptan maleate in tablet
dosage form. Indian Journal of Pharmaceutical Sciences. 72(5); 2010: 629-32.
[5] Ravi kumar K, Reddy BS Ch, Babu rao Ch, Chandra sekhar KB. Method development & validation of almotriptan maleate in human
plasma by HPLC-tandem mass spectrophotometry: Application to pharmacokinetic study. Scientia Pharmaceutica http//dx. Doi. Org/10.3797/2010 Sci. Pharm./1112-01.
[6] Nageshwar rao R, Guruprasad K, Gangu naidu Ch, Raju B, Srinivas R. LC_ESI-MS/MS determination of in vivo metabolites of
almotriptan maleate in rat plasma, urine and feces: application to pharmokinetics. Journal of Chromatography B Analytical Technol Biomedical Life Sciences. 891-892; 2012: 44-51.
[7] Suneetha A and Syamsundar B. New simple UV spectrophotometric method for estimation of almotriptan maleate in bulk and
pharmaceutical dosage form. Asian journal of Research in Chemistry. 3(1); 2010: 142-144.
[8] Suneetha A, Kathirvel S, Prathyusha A and Anusha K. Spectrophotometric estimation of almotriptan maleate in bulk and
pharmaceutical formulations by multivariateTechnique. Scientificipca. Org/paper/2011/09/13/201109131246120A. docx.
[9] Ramzia I. EI-Bagary, Mohammed NG, Nasr HA. Fluorimetric and colorimetric methods for the determination of some anti -migraine
drugs. Journal of Chemical and Pharmaceutical Research. 3(4); 2011: 304-314.
[10] 10.D.L Massart, B.G.M Vandegingtc, S.M Perming, Y. Michotte and L. Kaufman, Chemometrics, A text book, Elsevier, Amsterdam,
283 (1988).
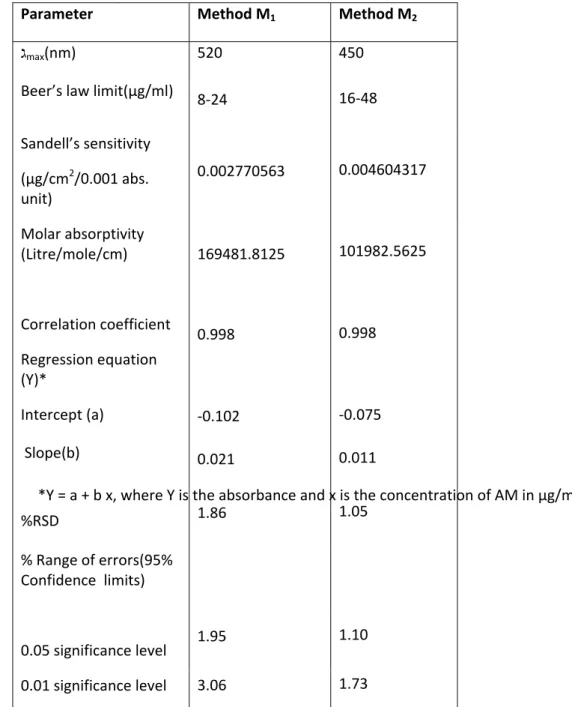
TABLE 1: OPTICAL CHARACTERISTICS, PRECISION AND ACCURACY OF PROPOSED METHODS
*Y = a + b x, where Y is the absorbance and x is the concentration of AM in µg/ml
Parameter Method M1 Method M2
גmax(nm) 520 450
Beer’s law limit(µg/ml)
8-24 16-48
Sandell’s sensitivity
(µg/cm2/0.001 abs. unit)
0.002770563 0.004604317
Molar absorptivity
(Litre/mole/cm) 169481.8125 101982.5625
Correlation coefficient
Regression equation (Y)*
0.998 0.998
Intercept (a) -0.102 -0.075
Slope(b) 0.021 0.011
%RSD 1.86 1.05
% Range of errors(95% Confidence limits)
0.05 significance level
0.01 significance level
1.95 1.10
TABLE-2 ANALYSIS OF ALMOTRIPTAN MALATE IN PHARMACEUTICAL FORMULATIONS BY PROPOSED AND REFERENCE METHODS.
Method *Formulations Labeled Amount (mg)
Found by Proposed Methods
Found by Reference Method ± SD
#% Recovery by Proposed Method ± SD **Amount
found ± SD
t F
M
1AXERT
TABLET
6.25 6.20
±
0.034
0.896 1.01 6.21±
0.034
99.23 ± 0.54
12.5
12.39 ±
0.072
0.773 4.42 12.44±
0.15
99.17 ±
0.574
M
2AXERT
TABLET
6.25 6.19
±
0.051
2.27 2.23 6.21±
0.034
98.96 ± 0.808
12.5 12.24
±
0.310
2.14 4.23 12.44±
0.15
97.96 ± 2.48
* AXERT tablets of Ortho Mc Nell Pharmaceuticals, USA
**Average ± Standard deviation of six determinations, the t- and f-values refer to comparison of the proposed method with reference method. (UV). Theoretical values at 95% confidence limits t =2.57 and f = 5.05.