CPD
8, 1737–1762, 2012Magnitude and timing of Equatorial
Atlantic surface warming
S. Weldeab
Title Page
Abstract Introduction
Conclusions References
Tables Figures
◭ ◮
◭ ◮
Back Close
Full Screen / Esc
Printer-friendly Version Interactive Discussion
Discussion
P
a
per
|
Dis
cussion
P
a
per
|
Discussion
P
a
per
|
Discussio
n
P
a
per
Clim. Past Discuss., 8, 1737–1762, 2012 www.clim-past-discuss.net/8/1737/2012/ doi:10.5194/cpd-8-1737-2012
© Author(s) 2012. CC Attribution 3.0 License.
Climate of the Past Discussions
This discussion paper is/has been under review for the journal Climate of the Past (CP). Please refer to the corresponding final paper in CP if available.
Magnitude and timing of Equatorial
Atlantic surface warming during the last
glacial bipolar oscillations
S. Weldeab
Department of Earth Science, University of California, Santa Barbara, USA Received: 19 April 2012 – Accepted: 3 May 2012 – Published: 21 May 2012 Correspondence to: S. Weldeab ([email protected])
CPD
8, 1737–1762, 2012Magnitude and timing of Equatorial
Atlantic surface warming
S. Weldeab
Title Page
Abstract Introduction
Conclusions References
Tables Figures
◭ ◮
◭ ◮
Back Close
Full Screen / Esc
Printer-friendly Version Interactive Discussion
Discussion
P
a
per
|
Dis
cussion
P
a
per
|
Discussion
P
a
per
|
Discussio
n
P
a
per
|
Abstract
We present core top and down core sample analyses of Mg/Ca in tests of planktonic foraminifer Globigerinoides ruber (variety pink) from the eastern Tropical-Equatorial Atlantic. Multivariate analysis of the core top data shows that Mg/Ca varies by 8±2 %
and 1±0.9 % per unit sea surface temperature (SST) (◦C) and salinity (psu) changes,
5
respectively, indicating that temperature exerts the most dominant control on planktonic foraminiferal Mg/Ca variation. A centennially resolved record of Mg/Ca-based SST es-timates from the Eastern Equatorial Atlantic (EEA) exhibits a close correlation between episodes of equatorial surface water warming, the onset of massive melt-water inputs into the North Atlantic (Heinrich events H3–H6), and rapid drop of air temperature over
10
Greenland, indicating that the Eastern Equatorial Atlantic responded very sensitively to millennial-scale bipolar oscillations of the last glacial and marine isotope stage 3. Rapid EEA SST rise between 0.8◦C and 2◦C synchronous with the onset of Heinrich events is consistent with the concept of Tropical Atlantic warmth in response to meltwater-induced perturbation of Atlantic meridional ocean circulation (AMOC). The persistence
15
of elevated EEA SST after the abrupt termination of Heinrich events and the spatial heterogeneity pertaining the direction, magnitude, and duration of thermal changes in the Equatorial Atlantic, as indicated by our and other proxy records, is at variance with model results that suggest a basin-wide SST rise during and rapid surface cooling af-ter the end of Heinrich events. Our study emphasizes that changes in wind fields and
20
wind-induced low latitude zonal surface currents were crucial in shaping the spatial heterogeneity and duration of Equatorial Atlantic surface water warmth.
1 Introduction
The last glacial and marine isotope stage 3 were marked by millennial-scale and re-curring northern high latitude ice sheet instabilities and associated meltwater influxes
25
CPD
8, 1737–1762, 2012Magnitude and timing of Equatorial
Atlantic surface warming
S. Weldeab
Title Page
Abstract Introduction
Conclusions References
Tables Figures
◭ ◮
◭ ◮
Back Close
Full Screen / Esc
Printer-friendly Version Interactive Discussion
Discussion
P
a
per
|
Dis
cussion
P
a
per
|
Discussion
P
a
per
|
Discussio
n
P
a
per
respectively (Bond et al., 1997; Blunier and Brook, 2001; Dansgaard et al., 1993; Hein-rich, 1988; Johnsen, 1992; NGRIP-members, 2004; Rashid et al., 2003; Vidal, 1997). North Atlantic and Northern Hemisphere mid latitude surface water cooled by several degrees during the episodes of meltwater influx (Bard, 2000; Bond et al., 1997; Cacho et al., 1999; Martrat et al., 2004; Patton et al., 2011; Hodell et al., 2010). Consistent
5
with the concept of bipolar oscillation (Knutti et al., 2004; Stocker, 1998; Toggweiler and Lea, 2011; Timmermann et al., 2005), southern high latitude marine and Antarctic ice records indicate air and surface water warming, southward retreat of sea-ice, and intensification of upwelling at time of northern high latitude cooling (Anderson et al., 2009; Barker et al., 2009; Blunier and Brook, 2001; Kanfoush et al., 2000; Sachs and
10
Anderson, 2005). Much of our current understanding of Tropical Atlantic response to the melt-water influx in the North Atlantic is largely derived from proxy- and model-based records of the Young Dryas (YD) and Heinrich event 1 (H1) (Chang et al., 2008; Chiang et al., 2003, 2008; Krebs and Timmermann, 2007; Lee et al., 2011; Liu et al., 2009; Lohmann, 2003; Flower et al., 2004; H ¨uls, 2000; Jaeschke et al., 2007; Lea et al.,
15
2003; N ¨urnberg et al., 2008; R ¨uhlemann et al., 1999; Weldeab et al., 2007, 2006; Zhao et al., 1995; Schmidt and Lynch-Stieglitz, 2011; Schmidt et al., 2004; and references in Clark et al., 2012). The YD and H1 events and ensuing rapid temperature changes occurred, however, in the backdrop of rising atmospheric CO2 (Monnin et al., 2001).
Consequently, the contribution of meltwater-induced AMOC perturbation on the
Trop-20
ical Atlantic SST rise during the YD and H1 events is difficult to isolated from those related to an increase in atmospheric greenhouse gasses (Lea et al., 2000; Shakun et al., 2012). In the absence of large-scale changes in atmospheric greenhouse gasses (Ahn and Brook, 2008), SST reconstruction from western equatorial Atlantic suggests surface water cooling during episodes of last glacial Heinrich events (Jaeschke et al.,
25
CPD
8, 1737–1762, 2012Magnitude and timing of Equatorial
Atlantic surface warming
S. Weldeab
Title Page
Abstract Introduction
Conclusions References
Tables Figures
◭ ◮
◭ ◮
Back Close
Full Screen / Esc
Printer-friendly Version Interactive Discussion
Discussion
P
a
per
|
Dis
cussion
P
a
per
|
Discussion
P
a
per
|
Discussio
n
P
a
per
|
provides insight into the timing and pace of thermal changes in EEA and zonal patterns across Equatorial Atlantic during and after termination of last glacial Heinrich events.
2 Oceanographic setting
We focus on marine sediment sequence MD03-2707 that was recovered from the East-ern Gulf of Guinea (2◦30.11′N, 9◦23.68′E, 1295 m), Easternmost Equatorial Atlantic
5
Ocean (Fig. 1). Variation of seasonal SST in the Gulf of Guinea is associated with changes in the strength of Guinea Current (Jouanno et al., 2011a). In summer (July– September), when the Guinea Current is strong, the Gulf of Guinea SST is low (zonal average 26.1◦C) and sea surface salinity (SSS) is relatively high (32.2 practical salin-ity unit – psu) (Antonov et al., 2010; Locarnini et al., 2010) (Fig. 2). Summer surface
10
water cooling in the Gulf of Guinea is not linked to a wind-induced upwelling, but is associated with velocity shear caused by the Guinea Current, bringing subsurface wa-ter to 10–40 m below surface wawa-ter (Grodsky et al., 2008; Jouanno et al., 2011a,b). In winter (January–March), warm surface water (28.9◦C) and low SSS (29 psu) (Antonov et al., 2010) prevail due to a weak Guinea Current (Jouanno et al., 2011a). The SSS
15
in the Eastern Gulf of Guinea is strongly determined by the large volume of runoff (∼280 km3yr−1) from river systems that drain large portions of the West African
mon-soon area. Current-induced mixing explains that SSS in the Eastern Gulf of Guinea is relatively high (32.16 psu) during summer monsoon as compared during the winter (29 psu) when the West African monsoon is relatively weak. The proximity of the
MD03-20
CPD
8, 1737–1762, 2012Magnitude and timing of Equatorial
Atlantic surface warming
S. Weldeab
Title Page
Abstract Introduction
Conclusions References
Tables Figures
◭ ◮
◭ ◮
Back Close
Full Screen / Esc
Printer-friendly Version Interactive Discussion
Discussion
P
a
per
|
Dis
cussion
P
a
per
|
Discussion
P
a
per
|
Discussio
n
P
a
per
3 Methods
We analyzed Mg/Ca in tests of Globigerinoides ruber (variety pink) from 59 core top and 320 new down core samples (Fig. 2a, b). The core top samples were re-trieved from the Gulf of Guinea across SST and SSS gradients (Lutze et al., 1988) (Fig. 2). Mean annual SST and SSS above the core top sites vary between 26.3◦C
5
and 28◦C and 29.6 psu and 35.4 psu, respectively (Antonov et al., 2010; Locarnini et al., 2010). Water depth of the core top samples ranges from 175 m to 4449 m, which corresponds to carbonate ion concentrations, expressed as ∆CO23−, between
−0.97 and 93.9 µmol kg−1, respectively. 58 of 59 core top samples were recovered
from sea floor that is bathed by bottom water that is saturated with respect to
car-10
bonate ion concentration. 25–30 individuals of Globigerinoides ruber variety pink were selected, gently crushed, and cleaned using the oxidative and reductive stan-dard foraminifera cleaning procedure (Martin and Lea, 2002). Dissolved samples were analyzed by the isotope dilution/internal standard method using a Thermo Finnigan Element2 sector field ICP-MS (Martin and Lea, 2002). Analytical reproducibility of
15
Mg/Ca, assessed by analyzing consistency standards matched in concentration to dis-solved foraminifera solutions and analyzed over the course of entire study, is estimated at 0.7 % (±0.014 Mg/Ca mmol mol−1), respectively. Pooled standard deviation (1σ) of
replicate analyses of core top samples is 0.06 mmol mol−1; higher sample standard de-viation relative to the consistency standard is most likely due to sample heterogeneity.
20
We also simultaneously analyzed Al/Ca, Fe/Ca, and Mn/Ca and other trace elements in order to assess the cleaning efficiency and detect possible diagenetic influences. Only 12 of 570 samples show Al/Ca greater than 80 µmol/mol, indicating that detrital material was successfully removed, and that Mg contribution from silicate phases to the analyzed Mg/Ca is negligibly low. Fe/Ca and Mn/Ca are slightly elevated, generally
25
CPD
8, 1737–1762, 2012Magnitude and timing of Equatorial
Atlantic surface warming
S. Weldeab
Title Page
Abstract Introduction
Conclusions References
Tables Figures
◭ ◮
◭ ◮
Back Close
Full Screen / Esc
Printer-friendly Version Interactive Discussion
Discussion
P
a
per
|
Dis
cussion
P
a
per
|
Discussion
P
a
per
|
Discussio
n
P
a
per
|
SST and SSS as well as to carbonate ion concentration. The latter was calculated from the data set compiled by Key et al. (2004) and using a software developed by Robbins et al. (2010). The saturation state of bottom water with respect to carbonate ion con-centration is expressed as∆CO23−=CO3 in situ2− −CO23 saturation− . With the exception of one
site at bottom water depth of 4449 m (∆CO23−=−0.9), the bottom water that bathes the
5
sites of our core top sediment collection is saturated with respect to carbonate ion con-centration (Table S1 in the Supplement). Consequently, we find no correlation between ∆CO23− and core top Mg/Ca. SST and SSS are exponentially correlated to Mg/Ca as follow: Mg/Ca(mmol mol−1
)=0.31·exp((0.080±0.02)·T(◦C)+(0.01±0.009)·SSS(psu)),
indicating that a unit change in SST and SSS is manifested by 8±2 % and 1±0.9 %
10
changes in foraminiferal Mg/Ca, respectively. The significance of this correlation with r2=0.22 is, however, weak (see discussion in the results section). Our core top Mg/Ca data are better correlated to the mean summer SST in the Gulf Guinea (Fig. 2a–c) as compared to annual and winter SST and SSS. The summer SST-Mg/Ca plot falls within the global calibration curve and its area of uncertainty (Anand et al., 2003; Dekens
15
et al., 2002) (Fig. 2c), indicating that SST has the most dominant control in the uptake of Mg in foraminiferal calcite which is consistent with the result of our multivariate anal-ysis. The Mg/Ca time series is converted into SST estimate using the global calibration equation (Mg/Ca(mmol mol−1
)=0.38·exp(0.090·T(◦C)) (Anand et al., 2003; Dekens
et al., 2002).
20
4 Results
4.1 Core tops
We analyzed Mg/Ca in tests of G. ruber pink from core top samples to assess its quantitative relationship to SST, SSS, and carbonate ion concentration (Fig. 2). Core top Mg/Ca varies between 3.02 and 4.81 mmol mol−1. The range of Mg/Ca in the core
25
CPD
8, 1737–1762, 2012Magnitude and timing of Equatorial
Atlantic surface warming
S. Weldeab
Title Page
Abstract Introduction
Conclusions References
Tables Figures
◭ ◮
◭ ◮
Back Close
Full Screen / Esc
Printer-friendly Version Interactive Discussion
Discussion
P
a
per
|
Dis
cussion
P
a
per
|
Discussion
P
a
per
|
Discussio
n
P
a
per
basis of visual sample inspections and the saturation state of bottom water with respect to carbonate ion concentration (Table S1), it is unlikely that preferential Mg dissolution is the main cause of the large range of Mg/Ca in the core top samples. Multivariate analysis of the core top data indicates that SST exerts the dominant control on the variability, with 8±2 % Mg/Ca changes per degree Celsius as compared to 1±0.9 %
5
changes in Mg/Ca per unit SSS changes. However, the correlation is weak, showing r2 of 0.22. Though they most likely do not represent the main cause, the following constraints may have contributed to the relatively weak correlation. First, the spatial resolution of core top sampling across the SST and SSS gradients in the Gulf of Guinea (Fig. 3a, b) is much higher than that of SST and SSS in the WOA09 data set (0.5◦×0.5◦)
10
(Antonov et al., 2010; Locarnini et al., 2010), possibly preventing precise assignment of SST and SSS to the individual Mg/Ca measurements. Secondly, while around 90 % of the core top samples were recovered within the sites of high sedimentation rate, a few core top samples from greater water depth may be older than the modern due to relatively low sedimentation rate, a problem that is inherent to all core top studies.
15
Of much more relevance to the understanding of our core top Mg/Ca is the nutrient availability that accompanies seasonal temperature variation. We compared the core top Mg/Ca data with mean summer and winter SSTs. The comparison reveals that the variability of Mg/Ca data better match to the spatial patterns of summer SST that show a range of 3.16◦C (27.32–24.16◦C) over the core to sampling sites (Fig. 2). A main
20
seasonal feature that most likely explains the better match between the core top Mg/Ca data and mean summer SST is the significantly enhanced nutrient availability during the summer (Grodsky et al., 2008; Jouanno et al., 2011a,b; Okumura and Xie, 2006). According to Jouanno et al. (2011a) the strengthening of the Guinea Current during summer causes velocity shear and, as consequence, shoaling of the thermocline and
25
CPD
8, 1737–1762, 2012Magnitude and timing of Equatorial
Atlantic surface warming
S. Weldeab
Title Page
Abstract Introduction
Conclusions References
Tables Figures
◭ ◮
◭ ◮
Back Close
Full Screen / Esc
Printer-friendly Version Interactive Discussion
Discussion
P
a
per
|
Dis
cussion
P
a
per
|
Discussion
P
a
per
|
Discussio
n
P
a
per
|
foraminiferal production toward the summer season, as suggested by the better match between the core top Mg/Ca data and summer SST.
Culture experiments suggest that changes in planktonic foraminiferal Mg/Ca of 2.3 % (Due ˜nas-Bohorquez et al., 2009), 4±3 % (Lea et al., 1999), 5±3 % (Kisak ¨urek et al.,
2008), and∼7 % (N ¨urnberg et al., 1996) correspond to a change in salinity unit. In
con-5
trast, some Mg/Ca analyses of core top samples from tropical and subtropical oceans show significantly higher values that are attributed to the effect of higher salinity (Ar-buszewski et al., 2010; Ferguson et al., 2008; Mathien-Blard and Bassinot, 2009). Sev-eral studies provide equations to quantify the magnitude of Mg/Ca changes inG. ru-ber that can be potentially attributed to the salinity effect (Arbuszewski et al., 2010;
10
Kisak ¨urek et al., 2008; Mathien-Blard and Bassinot, 2009). Applying these equations to the summer SSTs, summer SSSs, and carbonate ion concentrations over our core top sampling sites, we calculated the predicted Mg/Ca and compared these values with our analyzed core top Mg/Ca data (Fig. 2d). The equations proposed by Arbuszewski et al. (2010) and Mathien-Blard and Bassinot (2009) significantly underestimate and
15
overestimate the analyzed values, showing ranges between 2.05 and 2.3 mmol mol−1 and a pooled standard deviation (1σ) of ±0.53 mmol mol−1 (n=59) (Fig. 2d).
Over-all, the applicability of the above equations is inadequate for the Gulf of Guinea core top data. The equation developed by Kisak ¨urek et al. (2008) yields a relatively narrow range (1.7) and a pooled standard deviation of±0.33 mmol mol−1. Similarly, the global
20
equation with no correction for salinity effect (Anand et al., 2003; Dekens et al., 2002) yields predicted Mg/Ca values that are relatively closer to the measured values with a range of 1.7 mmol mol−1 and pooled standard deviation of
±0.38 mmol mol−1. It is
important to note that in the salinity range between 32.75 and 34.3 psu (Fig. 2d) the expected Mg/Ca, as obtained from the global equation, is much close to the analyzed
25
CPD
8, 1737–1762, 2012Magnitude and timing of Equatorial
Atlantic surface warming
S. Weldeab
Title Page
Abstract Introduction
Conclusions References
Tables Figures
◭ ◮
◭ ◮
Back Close
Full Screen / Esc
Printer-friendly Version Interactive Discussion
Discussion
P
a
per
|
Dis
cussion
P
a
per
|
Discussion
P
a
per
|
Discussio
n
P
a
per
4.2 Time series
We combine the 320 new measurements with 222 Mg/Ca measurements from a pre-vious study (Weldeab et al., 2007a). We note that the new sampling significantly en-hanced the temporal resolution and unravels centennial- and millennial-scale past cli-mate variability that was not recognized in the relatively low resolved overview study
5
(Weldeab et al., 2007a).
Throughout the investigated interval, Mg/Ca varies between 2.75 and 4.02 mmol mol−1 (Fig. 4c). The multi-decadally resolved Mg/Ca record shows high frequency oscillation most likely due to seasonal, annual, and decadal imprints as well as due to bioturbation (Fig. 4c). We focus on centennial-scale variation
10
that is highlighted by a 5-point running average. We tested the applicability of the Mg/Ca-SST-SSS equation experimentally developed by Kisak ¨urek et al. (2008) as well as the one derived from the Gulf of Guinea core top data, and compared the results with those obtained using the global Mg/Ca-SST calibration equation (Anand et al., 2003; Dekens et al., 2002). We used foraminiferal Ba/Ca-based runoff-induced SSS
15
estimates (Weldeab, 2012) in the calculation of the salinity effect. Time series of SST estimates obtained using equations that include correction for salinity effects show glacial SST that exceed modern annual and summer SSTs by several degree Celsius (Fig. S1 in the Supplement). It is obvious that the anomalously high SST estimates reflect a large-scale overestimation of the salinity effect. Due to the inadequacy of
20
existing equations for the correction of the salinity effect and, more importantly, the fact that Gulf of Guinea core top data are well described by the global calibration curve (Fig. 2c, d), we apply the latter to convert our Mg/Ca time series in to SST estimates.
The Mg/Ca-based SST estimates reveal numerous millennial-scale oscillations whose magnitude and duration vary between 0.8 and 2◦C and 2 and 4.5 kyr,
re-25
spectively. Prominent episodes of temperature rises include time intervals between 74.6±0.4 and 72.7±0.4 kyr BP showing SST increase from 23.4±0.2◦C to 25.5±0.5◦C
CPD
8, 1737–1762, 2012Magnitude and timing of Equatorial
Atlantic surface warming
S. Weldeab
Title Page
Abstract Introduction
Conclusions References
Tables Figures
◭ ◮
◭ ◮
Back Close
Full Screen / Esc
Printer-friendly Version Interactive Discussion
Discussion
P
a
per
|
Dis
cussion
P
a
per
|
Discussion
P
a
per
|
Discussio
n
P
a
per
|
to 24.8±0.1◦C. Similarly, SST changes from 23.2±0.3◦C to 24.4±0.7◦C between
46.8±0.3 and 45.5±0.2 kyr BP and from 23.1±0.2◦C to 24.2±0.3◦C between 31.3±0.4
and 29.4±0.4 kyr BP (Figs. 5 and 6) are evident. Prior to 60 kyr BP Mg/Ca increase
is correlated with negative swings in the δ18O record. After 60 kyr BP, the onset of centennial-scale increase of Mg/Ca is generally accompanied by an increase inδ18O.
5
5 Discussion
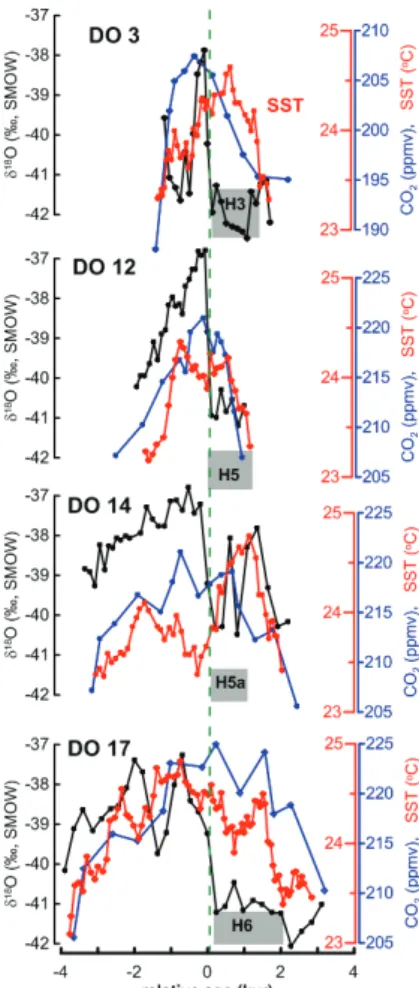
Comparison of the Gulf of Guinea SST time series with both Greenland and Antarctic ice core records (Ahn and Brook, 2008; Blunier and Brook, 2001) shows that the timing of abrupt EEA SST rises is synchronous, within the age model uncertainty, with the onsets of Heinrich events and rapid drop in air temperature over Greenland (Figs. 5
10
and 6) (Blunier and Brook, 2001; Heinrich, 1988; Rashid et al., 2003; Vidal, 1997). Furthermore, Gulf of Guinea SST rises were paralleled by a rise in atmospheric CO2
concentration ranging from 12 to 20 ppmv (Ahn and Brook, 2008). We suggest that this magnitude (12–20 ppmv) of atmospheric CO2changes is too small to account for the
observed rise of SST in the EEA. Nonetheless, the temporal correlation between EEA
15
SST and CO2indicates that both the Equatorial Atlantic and deep ocean carbon reser-voir (Anderson et al., 2009; Toggweiler and Lea, 2011) responded very sensitively to the rapid interhemispheric atmospheric reorganization. Rapid EEA SST rise concomi-tant with the onset of Heinrich events is consistent with results of modeling studies that postulate warming of the Tropical Atlantic in response to melt-water influx into the
20
North Atlantic and ensuing reduction of northward heat transport (Chang et al., 2008; Chiang et al., 2008; Knutti et al., 2004; Krebs and Timmermann, 2007; Lee et al., 2011; Liu et al., 2009; Lohmann, 2003). Our study shows, however, that, with the exception of H5a, the termination of the EEA warm episodes lags the timing of rapid temperature rise over Greenland by∼2.2 kyr,∼2.3 kyr,∼1.3 kyr, and ∼1.2 kyr during DO events 3,
25
CPD
8, 1737–1762, 2012Magnitude and timing of Equatorial
Atlantic surface warming
S. Weldeab
Title Page
Abstract Introduction
Conclusions References
Tables Figures
◭ ◮
◭ ◮
Back Close
Full Screen / Esc
Printer-friendly Version Interactive Discussion
Discussion
P
a
per
|
Dis
cussion
P
a
per
|
Discussion
P
a
per
|
Discussio
n
P
a
per
with the notion that the end of each Heinrich event was accompanied by a sudden re-lease of heat that was accumulated in the tropical ocean Atlantic (Knutti et al., 2004; Liu et al., 2009). In order to explore possible zonal differences within the Equatorial At-lantic, we compare our results with those from Western Tropical Atlantic that presents the main route of meridional heat and surface water mass exchange (Ganachaud,
5
2000). In strong contrast to the EEA SST record, the Western Equatorial Atlantic time series (Jaeschke et al., 2007) shows rapid SST changes that are synchronous, within the age model uncertainty, with the onset and termination of Heinrich events, respec-tively (Fig. 5). Farther to the north in the Caribbean Sea, SST reconstruction indicates surface warmth during the onset of the Heinrich events (H ¨uls, 2000). The feature that
10
emerges from the comparison is a spatially and temporally heterogeneous pattern of Tropical Atlantic thermal response to the millennial-scale high latitude climate oscilla-tions (Fig. 5). We suggest that the thermal heterogeneity of Equatorial Atlantic may be related to changes in wind fields that at a regional level could have reinforced and counteracted a possible basin-wide surface warming due to reduced northward heat
15
transport (Chang et al., 2008; Chiang et al., 2003, 2008; Krebs and Timmermann, 2007; Lee et al., 2011; Lohmann, 2003). In the Gulf of Guinea, a weakening of the Guinea Current could have contributed to the EEA surface water warming. In the mod-ern climate, a southward displacement of the intertropical convergence zone (ITCZ) and weak summer monsoon is accompanied by weakening of the Guinea Current that
20
leads to warming of Gulf of Guinea surface water (Philander, 1986; Schott et al., 2002). However, the abrupt strengthening of the West African monsoon at the end of Heinrich events, as indicated by theδ18O record (Fig. 4) (Weldeab, 2012), is not paralleled by an equally rapid decline in SST. The decoupling of EEA SST and West African monsoon changes could suggest a less prominent role of the Guinea Current.
25
Changes in wind fields and surface currents across the Equatorial Atlantic may pro-vide a viable mechanism for the observed zonal SST patterns (Fig. 2). Proxy records off the Brazilian continental margin (∼5◦S) (Arz et al., 1998; Jennerjahn et al., 2004) and
CPD
8, 1737–1762, 2012Magnitude and timing of Equatorial
Atlantic surface warming
S. Weldeab
Title Page
Abstract Introduction
Conclusions References
Tables Figures
◭ ◮
◭ ◮
Back Close
Full Screen / Esc
Printer-friendly Version Interactive Discussion
Discussion
P
a
per
|
Dis
cussion
P
a
per
|
Discussion
P
a
per
|
Discussio
n
P
a
per
|
Heinrich events that are interpreted to reflect large-scale southward displacement of the mean position of the ITCZ. In contrast, the West African monsoon was severely weakened (Weldeab, 2012), but the average seasonal position of the ITCZ most likely remained north of the Gulf of Guinea coast (∼6–4◦N), as no SST drops are observed
during Heinrich events that would have otherwise occurred due to trade wind-induced
5
upwelling. If this inference is correct, then there existed a highly asymmetric shift of the ITCZ over the Gulf of Guinea and the Western Equatorial Atlantic (WEA). Instrumental data covering periods of extreme southward shift of the ITCZ over the WEA show that the associated southward shift of the SE trade winds weakens the North Brazil Current (NBC) and promotes the development of an easterly current of warm surface water
10
that causes a rapid heat build-up in the EEA (Fig. 1) (Philander, 1986; Schott et al., 2002). Similarly, fresh water hosing experiments simulating Heinrich event-like condi-tions (Knutti et al., 2004; Lohmann, 2003) suggest that the development of easterly equatorial surface current and a warmer EEA relative to the WEA is a robust feature of model outcomes, providing a potentially viable explanation for the proxy-based
ob-15
servation of the thermal asymmetry across the Equatorial Atlantic during the Heinrich events. The difference in the timing and pace of SST changes in Western (Jaeschke et al., 2007) and Eastern Equatorial Atlantic (this study) immediately after the suspen-sion of fresh water flux into North Atlantic presents a marked zonal feature. Following the cessation of melt-water flux into the North Atlantic, a rapid resumption of a
vigor-20
ous AMOC (Knutti et al., 2004; Liu et al., 2009) and a northward shift of southeasterly winds (Lohmann, 2003) could have strengthened the NBC and weakened the eastward surface current and the Equatorial Undercurrent (EUC) that, under modern conditions, forms as a retroflection of the NBC (Fig. 1). Though somewhat speculative, a gradual weakening of the easterly surface current may explain the gradual decline of heat in
25
CPD
8, 1737–1762, 2012Magnitude and timing of Equatorial
Atlantic surface warming
S. Weldeab
Title Page
Abstract Introduction
Conclusions References
Tables Figures
◭ ◮
◭ ◮
Back Close
Full Screen / Esc
Printer-friendly Version Interactive Discussion
Discussion
P
a
per
|
Dis
cussion
P
a
per
|
Discussion
P
a
per
|
Discussio
n
P
a
per
perturbation during the last glacial. The zonal SST gradient and temporal heterogene-ity within the Equatorial Atlantic demands, however, a considerable thermal modulation by regional wind-driven surface currents.
6 Summary and conclusion
Mg/Ca analyses onG. ruber (variety pink) tests selected from 59 Gulf of Guinea core
5
top samples indicate that Mg/Ca data reflect mean summer SST. We suggest this is due to current-induced shoaling of the summer nutricline along the east-west trend-ing coastal waters (Jouanno et al., 2011a) where most of the samples were collected. A multivariate analysis shows that one unit of SST and SSS change corresponds to 8±2 % and 1±0.9 % changes in Mg/Ca, respectively. We found that the available
equa-10
tions with salinity correction (Arbuszewski et al., 2010; Kisak ¨urek et al., 2008; Mathien-Blard and Bassinot, 2009) are inadequate for the Gulf of Guinea data because they significantly under- and over-estimate the analyzed Mg/Ca values. Our core top data show that the global calibration (Anand et al., 2003; Dekens et al., 2002) reliably de-scribes the relationship between Mg/Ca inG. ruber and SST of Equatorial Atlantic.
15
We established for the first time a centennially resolved and continuous sea surface temperature record of Eastern Equatorial Atlantic (EEA) over time periods of rapid cli-mate oscillations. The EEA SST record provides evidence that the Tropical Atlantic was highly sensitive to millennial-scale episodes of ice sheet and atmospheric instabil-ities and responded very differently than upwelling-dominated low latitude continental
20
margins (Jaeschke et al., 2007; Lea et al., 2003; Zhao et al., 1995). EEA SST rises between 0.8◦C to 2◦C concomitant with the timing of meltwater flux into the North Atlantic. Reduced heat export from the Tropical Atlantic to the northern high latitude, as suggested by modeling studies, may provide a partial explanation for the EEA sur-face water warmth. The persistence of elevated SST after the abrupt termination of
25
CPD
8, 1737–1762, 2012Magnitude and timing of Equatorial
Atlantic surface warming
S. Weldeab
Title Page
Abstract Introduction
Conclusions References
Tables Figures
◭ ◮
◭ ◮
Back Close
Full Screen / Esc
Printer-friendly Version Interactive Discussion
Discussion
P
a
per
|
Dis
cussion
P
a
per
|
Discussion
P
a
per
|
Discussio
n
P
a
per
|
considerable modulation of Equatorial Atlantic SST by regional processes. We hypoth-esize that changes of wind-induced low latitude zonal surface currents have signif-icantly contributed to the heterogeneous patterns of Equatorial Atlantic SST. While a broad areal coverage of highly resolved Tropical Atlantic SST records is required to reach a conclusive assessment, our findings suggest a limited contribution of the
5
Equatorial Atlantic to the rapid temperature rise in northern high latitude following the termination of Heinrich events.
Supplementary material related to this article is available online at:
http://www.clim-past-discuss.net/8/1737/2012/cpd-8-1737-2012-supplement.zip.
Acknowledgements. I thank Dorothy K. Pak and David W. Lea for discussion, suggestion, and
10
comments. I thank G. Paradis for ICP-MS operation, James P. Kennett, Alex Simms, and Gerrit Lohmann for discussion, Wolfgang Kuhnt for providing core top samples. A generous start-up package and UCSB career development award is greatly acknowledged.
References
Ahn, J. and Brook, E. J.: Atmospheric CO2and climate on millennial time scales during the last
15
glacial period, Science, 322, 83–85, doi:10.1126/science.1160832, 2008.
Anand, P., Elderfield, H., and Conte, M. H.: Calibration of Mg/Ca thermometry in plank-tonic foraminifera from a sediment trap time series, Paleoceanography, 18, 1050, doi:10.1029/2002PA000846, 2003.
Anderson, R. F., Ali, S., Bradtmiller, L. I., Nielsen, S. H. H., Fleisher, M. Q., Anderson, B. E.,
20
and Burckle, L. H.: Wind-driven upwelling in the Southern Ocean and the deglacial rise in atmospheric CO2, Science, 323, 1443–1448, 2009.
Antonov, J. I., Seidov, D., Boyer, T. P., Locarnini, R. A., Mishonov, A. V., Garcia, H. E., Bara-nova, O. K., Zweng, M. M., and Johnson, D. R.: World Ocean Atlas 2009, Vol. 2, Salinity, in: NOAA Atlas NESDIS 69, edited by: Levitus, S., US Government Printing Office,
Washing-25
CPD
8, 1737–1762, 2012Magnitude and timing of Equatorial
Atlantic surface warming
S. Weldeab
Title Page
Abstract Introduction
Conclusions References
Tables Figures
◭ ◮
◭ ◮
Back Close
Full Screen / Esc
Printer-friendly Version Interactive Discussion
Discussion
P
a
per
|
Dis
cussion
P
a
per
|
Discussion
P
a
per
|
Discussio
n
P
a
per
Arbuszewski, J., deMenocal, P., Kaplan, A., and Farmer, E. C.: On the fidelity of shell-derived
δ18O seawater estimates, Earth Planet. Sc. Lett., 300, 185–196, 2010.
Arz, H. W., P ¨atzold, J., and Wefer, G.: Correlated millennial-scale changes in surface hydrogra-phy and terrigenous sediment yield infered from Last-Glacial marine deposits off Northeast-ern Brazil, QuatNortheast-ernary Res., 50, 157–166, 1998.
5
Bard, E., Rostek, F., Turon, J.-L., and Gendreau, S.: Hydrological impact of Heinrich events in the subtropical Northeast Atlantic, Science, 289, 1321–1323, 2000.
Barker, S., Diz, P., Vautravers, M. J., Pike, J., Knorr, G., Hall, I. R., and Broecker, W. S.: Inter-hemispheric Atlantic seesaw response during the last deglaciation, Nature, 457, 1097–1102, doi:10.1038/nature07770, 2009.
10
Blunier, T. and Brook, E. J.: Timing of millennial-scale climate change in Antarctica and Green-land during the last glacial period, Science, 291, 109–112, 2001.
Bond, G., Showers, W., Cheseby, M., Lotti, R., Almasi, P., deMenocal, P., Priore, P., Cullen, H., Hajdas, I., and Bonani, G.: A pervasive millennial-scale cycle in North Atlantic Holocene and glacial climates, Science, 278, 1257–1566, 1997.
15
Cacho, I., Grimalt, J. O., Pelejero, C., Canals, M., Sierro, F. J., Flores, J. A., and Shackleon, N.: Dansgaard-Oeschger and Heinrich event imprints in Alboran Sea paleotemperatures, Pale-oceangraphy, 14, 698–705, 1999.
Chang, P., Zhang, R., Hazeleger, W., Wen, C., Wan, X., Ji, L., Haarsma, R. J., Breugem, W.-P., and Seidel, H.: Oceanic link between abrupt changes in the North Atlantic Ocean and the
20
African monsoon, Nat. Geosci., 1, 444–448, 2008.
Chiang, J. C. H., Biasutti, M., and Battisti, D. S.: Sensitivity of the Atlantic Intertropical Con-vergence Zone to Last Glacial Maximum boundary conditions, Paleoceanography, 18, 1094, doi:10.1029/2003pa000916, 2003.
Chiang, J. C. H., Cheng, W., and Bitz, C. M.: Fast teleconnections to the Tropical
At-25
lantic sector from Atlantic thermohaline adjustment, Geophys. Res. Lett., 35, L07704, doi:10.1029/2008gl033292, 2008.
Clark, P. U., Shakun, J. D., Baker, P. A., Bartlein, P. J., Brewer, S., Brook, E., Carlson, A. E., Cheng, H., Kaufman, D. S., Liu, Z., Marchitto, T. M., Mix, A. C., Morrill, C., Otto-Bliesner, B. L., Pahnke, K., Russell, J. M., Whitlock, C., Adkins, J. F., Blois, J. L., Clark, J., Colman, S. M.,
30
CPD
8, 1737–1762, 2012Magnitude and timing of Equatorial
Atlantic surface warming
S. Weldeab
Title Page
Abstract Introduction
Conclusions References
Tables Figures
◭ ◮
◭ ◮
Back Close
Full Screen / Esc
Printer-friendly Version Interactive Discussion
Discussion
P
a
per
|
Dis
cussion
P
a
per
|
Discussion
P
a
per
|
Discussio
n
P
a
per
|
the last deglaciation, P. Natl. Acad. Sci., 109, E1134–E1142, doi:10.1073/pnas.1116619109, 2012.
Dansgaard, W., Johnsen, S. J., Clausen, H. B., Dahl-Hvidberg, C. S., Steffensen, J. P., Sveinbj ¨ornsdottir, A. E., Jouzel, J., and Bond, G.: Evidence for general instability of past climate from a 250-kyr ice-core record, Nature, 364, 218–220, 1993.
5
Dekens, P. S., Lea, D. W., Pak, D. K., and Spero, H. J.: Core top calibration of Mg/Ca in tropi-cal foraminifera: refining paleotemperature estimation, Geochem. Geophy. Geosy., 3, 1022, doi:10.1029/2001GC000200, 2002.
Due ˜nas-Bohorquez, A., da Rocha, R. E., Kuroyanagi, A., Bijma, J., and Reichart, G. J.: Effect of salinity and seawater calcite saturation state on Mg and Sr incorporation in cultured
plank-10
tonic foraminifera, Mar. Micropaleontol., 73, 178–189, doi:10.1016/j.marmicro.2009.09.002, 2009.
Ferguson, J. E., Henderson, G. M., Kucera, M., and Rickaby, R. E. M.: Systematic change of foraminiferal Mg/Ca ratios across a strong salinity gradient, Earth Planet. Sc. Lett., 265, 153–166, 2008.
15
Flower, B. P., Hasting, D. W., Hill, H. W., and Quinn, T. M.: Phasing of deglacial warming and Laurentide ice sheet meltwater in the Gulf of Mexico, Geology, 32, 597–600, 2004.
Ganachaud, A. and Wunsch, C.: Improved estimates of global ocean circulation,heat transport and mixing from hydrographic data, Nature, 408, 453–457, 2000.
Grodsky, S. A., Carton, J. A., and McClain, C. R.: Variability of upwelling and chlorophyll in the
20
Equatorial Atlantic, Geophys. Res. Lett., 35, L03610, doi:10.1029/2007gl032466, 2008. Heinrich, H.: Origin and consequences of cyclic ice rafting in the Northeast Atlantic Ocean
during the past 130 000 yr, Quaternary Res., 29, 142–152, 1988.
Hodell, D. A., Evans, H. F., Channell, J. E. T., and Curtis, J. H.: Phase relationships of North Atlantic ice-rafted debris and surface-deep climate proxies during the last glacial period,
25
Quaternary Sci. Rev., 29, 3875–3886, doi:10.1016/j.quascirev.2010.09.006, 2010.
H ¨uls, M. and Zahn, R.: Millennial-scale sea surface temperature variability in the Western Trop-ical North Atlantic from planktonic foraminiferal, Paleoceangraphy, 15, 659–678, 2000. Jaeschke, A., R ¨uhlemann, C., Arz, H., Heil, G., and Lohmann, G.: Coupling of
millennial-scale changes in sea surface temperature and precipitation off Northeastern Brazil with
30
CPD
8, 1737–1762, 2012Magnitude and timing of Equatorial
Atlantic surface warming
S. Weldeab
Title Page
Abstract Introduction
Conclusions References
Tables Figures
◭ ◮
◭ ◮
Back Close
Full Screen / Esc
Printer-friendly Version Interactive Discussion
Discussion
P
a
per
|
Dis
cussion
P
a
per
|
Discussion
P
a
per
|
Discussio
n
P
a
per
Jennerjahn, T., Ittekkot, V., Arz, H., Behling, H., P ¨atzold, J., and Wefer, G.: Asynchrony of pre-served terrestrial and marine signals of climate change in the tropics during the Heinrich events, Science, 306, 2236–2239, 2004.
Johnsen, S. J.: Irregular glacial interstadials recorded in a new Greenland ice core, Nature, 359, 311–313, 1992.
5
Jouanno, J., Marin, F., du Penhoat, Y., Molines, J. M., and Sheinbaum, J.: Seasonal modes of surface cooling in the Gulf of Guinea, J. Phys. Oceanogr., 41, 1408–1416, doi:10.1175/jpo-d-11-031.1, 2011a.
Jouanno, J., Marin, F., du Penhoat, Y., Sheinbaum, J., and Molines, J.-M.: Seasonal heat bal-ance in the upper 100 m of the Equatorial Atlantic Ocean, J. Geophys. Res.-Oceans, 116,
10
C09003, doi:10.1029/2010jc006912, 2011b.
Kanfoush, S. L., Hodell, D. A., Charles, C. D., Guilderson, T. P., Mortyn, P. G., and Ninne-mann, U. S.: Millennial-scale instability of the Antarctic Ice Sheet during the Last Glaciation, Science, 288, 1815–1818, 2000.
Key, R. M., Kozyr, A., Sabine, C. L., Lee, K., Wanninkhof, R., Bullister, J. L., Feely, R. A.,
15
Millero, F. J., Mordy, C., and Peng, T. H.: A global ocean carbon climatology: results from Global Data Analysis Project (GLODAP), Global Biogeochem. Cy., 18, GB4031, doi:10.1029/2004gb002247, 2004.
Kisak ¨urek, B., Eisenhauer, A., B ¨ohm, F., Garbe-Sch ¨onberg, D., and Erez, J.: Controls on shell Mg/Ca and Sr/Ca in cultured planktonic foraminiferan,Globigerinoides ruber (white), Earth
20
Planet. Sc. Lett., 273, 260–269, 2008.
Knutti, R., Fluckiger, J., Stocker, T. F., and Timmermann, A.: Strong hemispheric coupling of glacial climate through freshwater discharge and ocean circulation, Nature, 430, 851–856, 2004.
Krebs, U. and Timmermann, A.: Tropical air-sea interactions accelerate the recovery of the
25
Atlantic meridional overturning circulation after a major shutdown, J. Climate, 20, 4940– 4956, doi:10.1175/JCLI4296.1, 2007.
Lea, D. W., Mashiotta, T. A., and Spero, H. J.: Controls on magnesium and strontium uptake in planktonic foraminifera determined by live culturing, Geochim. Cosmochim. Acta, 63, 2369– 2379, 1999.
30
CPD
8, 1737–1762, 2012Magnitude and timing of Equatorial
Atlantic surface warming
S. Weldeab
Title Page
Abstract Introduction
Conclusions References
Tables Figures
◭ ◮
◭ ◮
Back Close
Full Screen / Esc
Printer-friendly Version Interactive Discussion
Discussion
P
a
per
|
Dis
cussion
P
a
per
|
Discussion
P
a
per
|
Discussio
n
P
a
per
|
Lea, D. W., Pak, D. K., Peterson, L. C., and Hughen, K. A.: Synchronity of tropical and high-latitude Atlantic temperatures over the last glacial termination, Science, 301, 1361–1364, 2003.
Lee, S.-Y., Chiang, J. C. H., Matsumoto, K., and Tokos, K. S.: Southern Ocean wind response to North Atlantic cooling and the rise in atmospheric CO2: modeling perspective and
pa-5
leoceanographic implications, Paleoceanography, 26, PA1214, doi:10.1029/2010pa002004, 2011.
Liu, Z., Otto-Bliesner, B. L., He, F., Brady, E. C., Tomas, R., Clark, P. U., Carlson, A. E., Lynch-Stieglitz, J., Curry, W., Brook, E., Erickson, D., Jacob, R., Kutzbach, J., and Cheng, J.: Tran-sient simulation of last deglaciation with a new mechanism for Bolling-Allerod warming,
Sci-10
ence, 325, 310–314, doi:10.1126/science.1171041, 2009.
Lohmann, G.: Atmospheric and oceanic freshwater transport during weak Atlantic overturning circulation, Tellus A, 55, 438–449, 2003.
Lutze, G. F., Agwu, C. O. C., Altenbach, A., Henken-Meliies, U., Kothe, C., Muehlhan, N., Pflau-mann, U., Samtleben, C., Sarnthein, M., Segl, M., Soltwedel, T., Stute, U., TiedePflau-mann, R.,
15
and Weinholz, P.: Report of R.V. METEOR cruise M5-6 Dakar-Libreville 15 January– 16 February 1988, 22, 1988.
Martin, P. A. and Lea, D. W.: A simple evaluation of cleaning procedures on fossil ben-thic foraminiferal Mg/Ca, Geochem. Geophy. Geosy., 3, 8401, doi:10.1029/2001GC000280, 2002.
20
Martrat, B., Grimalt, J. O., Lopez-Martinez, C., Cacho, I., Sierro, F. J., Flores, J. A., Zahn, R., Canals, M., Curtis, J. H., and Hodell, D. A.: Abrupt temperature changes in the Western Mediterranean over the Past 250 000 years, Science, 306, 1762–1765, 2004.
Mathien-Blard, E. and Bassinot, F.: Salinity bias on the foraminifera Mg/Ca thermometry: cor-rection procedure and implications for past ocean hydrographic reconstructions, Geochem.
25
Geophy. Geosy., 10, Q12011, doi:10.1029/2008gc002353, 2009.
Monnin, E., Indermuhle, A., Dallenbach, A., Fluckiger, J., Stauffer, B., Stocker, T. F., Ray-naud, D., and Barnola, J.-M.: Atmospheric CO2 concentrations over the last glacial termi-nation, Science, 291, 112–114, 2001.
NGRIP-members: High-resolution record of Northern Hemisphere climate extending into the
30
CPD
8, 1737–1762, 2012Magnitude and timing of Equatorial
Atlantic surface warming
S. Weldeab
Title Page
Abstract Introduction
Conclusions References
Tables Figures
◭ ◮
◭ ◮
Back Close
Full Screen / Esc
Printer-friendly Version Interactive Discussion
Discussion
P
a
per
|
Dis
cussion
P
a
per
|
Discussion
P
a
per
|
Discussio
n
P
a
per
N ¨urnberg, D., Bijma, J., and Hemleben, C.: Assessing the reliability of magnesium in foraminiferal calcite as a proxy for water mass temperatures, Geochim. Cosmochim. Acta, 60, 803–814, 1996.
N ¨urnberg, D., Ziegler, M., Karas, C., Tiedemann, R., and Schmidt, M. W.: Interacting loop cur-rent variability and Mississippi River discharge over the past 400 kyr, Earth Planet. Sc. Lett.,
5
272, 278–289, 2008.
Okumura, Y. and Xie, S.-P.: Some overlooked features of Tropical Atlantic climate leading to a New Ni ˜no-like phenomenon, J. Climate, 19, 5859–5874, doi:10.1175/jcli3928.1, 2006. Patton, G. M., Martin, P. A., Voelker, A., and Salgueiro, E.: Multiproxy comparison of
oceano-graphic temperature during Heinrich events in the Eastern Subtropical Atlantic, Earth Planet.
10
Sc. Lett., 310, 45–58, doi:10.1016/j.epsl.2011.07.028, 2011.
Philander, S. G. H.: Unsual conditions in the Tropical Atlantic Ocean in 1984, Nature, 322, 236–238, 1986.
Rashid, H., Hesse, R., and Piper, D. J. W.: Evidence for an additional Heinrich event between H5 and H6 in the Labrador Sea, Paleoceanography, 18, 1077, doi:10.1029/2003pa000913,
15
2003.
Robbins, L. L., Hansen, M. E., Kleypas, J. A., and Meylan, S. C.: CO2 calc – a user-friendly seawater carbon calculator for Windows, Max OS X, and iOS (iPhone): US Geological Survey Open-File Report 2010–1280, USGS St. Petersburg, 2010.
R ¨uhlemann, C., Mulitza, S., M ¨uller, P. J., Wefer, G., and Zahn, R.: Warming of the Tropical
20
Atlantic Ocean and slowdown of thermohaline circulation during the last deglaciation, Nature, 402, 511–514, 1999.
Sachs, J. P. and Anderson, R. F.: Increased productivity in the subantarctic ocean during Hein-rich events, Nature, 434, 1118–1121, 2005.
Schmidt, M. W. and Lynch-Stieglitz, J.: Florida Straits deglacial temperature and salinity
25
change: implications for tropical hydrologic cycle variability during the Younger Dryas, Pa-leoceanography, 26, PA4205, doi:10.1029/2011pa002157, 2011.
Schmidt, M. W., Spero, H. J., and Lea, D. W.: Links between salinity variation in the Caribbean and North Atlantic thermohaline circulation, Nature, 428, 160–163, 2004.
Schott, F. A., Brandt, P., Hamann, M., Fischer, J., and Stramma, L.: On the boundary flow off
30
Brazil at 5–10◦S and its connection to the interior Tropical Atlantic, Geophs. Res. Lett., 29,
CPD
8, 1737–1762, 2012Magnitude and timing of Equatorial
Atlantic surface warming
S. Weldeab
Title Page
Abstract Introduction
Conclusions References
Tables Figures
◭ ◮
◭ ◮
Back Close
Full Screen / Esc
Printer-friendly Version Interactive Discussion
Discussion
P
a
per
|
Dis
cussion
P
a
per
|
Discussion
P
a
per
|
Discussio
n
P
a
per
|
Shakun, J. D., Clark, P. U., He, F., Marcott, S. A., Mix, A. C., Liu, Z., Otto-Bliesner, B., Schmit-tner, A., and Bard, E.: Global warming preceded by increasing carbon dioxide concentrations during the last deglaciation, Nature, 484, 49–54, doi:10.1038/nature10915, 2012.
Stocker, T. F.: Climate change: the seesaw effect, Science, 282, 61–62, 1998.
Timmermann, A., Krebs, U., Justino, F., Goosse, H., and Ivanochko, T.: Mechanisms for
5
millennial-scale global synchronization during the last glacial period, Paleoceanography, 20, Pa4008, doi:10.1029/2004pa001090, 2005.
Toggweiler, J. R. and Lea, D. W.: Temperature differences between the hemispheres and ice age climate variability, Paleoceanography, 25, PA2212, doi:10.1029/2009pa001758, 2011. Vidal, L., Labeyrie, L., Cortijo, E., Arnold, M., Duplessy, J. C., Michel, E., Becque, S., and Van
10
Weering, T. C. E.: Evidence for changes in the North Atlantic Deep Water linked to metwater surges during the Heinrich events, Earth Planet. Sc. Lett., 146, 13–27, 1997.
Wang, X., Auler, A. S., Edwards, R. L., Cheng, H., Cristalli, P. S., Smart, P. L., Richards, D. A., and Shen, C.-C.: Wet periods in Northern Brazil over the past 210 kyr linked to distant climate anomalies, Nature, 432, 740–743, 2004.
15
Weldeab, S.: Bipolar modulation of millennial-scale West African monsoon variability during the last glacial (75 000–25 000 years ago), Quaternary Sci. Rev., 40, 21–29, doi:10.1016/j.quascirev.2012.02.014, 2012.
Weldeab, S., Schneider, R. R., and Koelling, M.: Deglacial sea surface temperature and salinity increase in the Western Tropical Atlantic in synchrony with high latitude climate instabilities,
20
Earth Planet. Sc. Lett., 241, 699–706, 2006.
Weldeab, S., Lea, D. W., Schneider, R. R., and Andersen, N.: 155 000 years of West African monsoon and ocean thermal evolution, Science, 316, 1303–1307, 2007.
Zhao, M., Beveridge, N. A. S., Shackleton, N. J., Sarnthein, M., and Eglinton, G.: Molecu-lar stratigraphy of cores offNorthwest Africa: sea surface temperature history over the last
25
CPD
8, 1737–1762, 2012Magnitude and timing of Equatorial
Atlantic surface warming
S. Weldeab
Title Page
Abstract Introduction
Conclusions References
Tables Figures
◭ ◮
◭ ◮
Back Close
Full Screen / Esc
Printer-friendly Version Interactive Discussion
Discussion
P
a
per
|
Dis
cussion
P
a
per
|
Discussion
P
a
per
|
Discussio
n
P
a
per
|
Fig. 2. Mean summer SST (A) and SSS (B) in the Gulf of Guinea (Locarnini et al., 2010; Antonov et al., 2010) plotted using software Ocean Data View (Schlitzer, 2012). Black diamonds and a blue square indicate locations of core top sampling and MD03-2707, respectively. (C)
CPD
8, 1737–1762, 2012Magnitude and timing of Equatorial
Atlantic surface warming
S. Weldeab
Title Page
Abstract Introduction
Conclusions References
Tables Figures
◭ ◮
◭ ◮
Back Close
Full Screen / Esc
Printer-friendly Version Interactive Discussion
Discussion
P
a
per
|
Dis
cussion
P
a
per
|
Discussion
P
a
per
|
Discussio
n
P
a
per
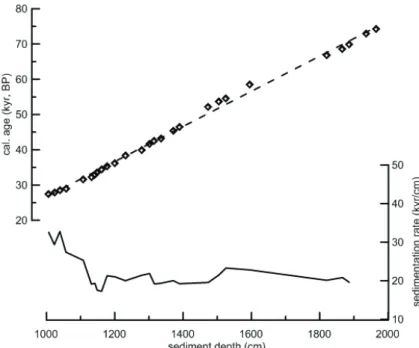
Fig. 3. Ages of tie points (diamonds) plotted versus sediment depth, as obtained by tuning
δ18OG. ruber record in MD2707 (Weldeab, 2012; Weldeab et al., 2007) versus δ18Oice GIPS2
CPD
8, 1737–1762, 2012Magnitude and timing of Equatorial
Atlantic surface warming
S. Weldeab
Title Page
Abstract Introduction
Conclusions References
Tables Figures
◭ ◮
◭ ◮
Back Close
Full Screen / Esc
Printer-friendly Version Interactive Discussion
Discussion
P
a
per
|
Dis
cussion
P
a
per
|
Discussion
P
a
per
|
Discussio
n
P
a
per
|
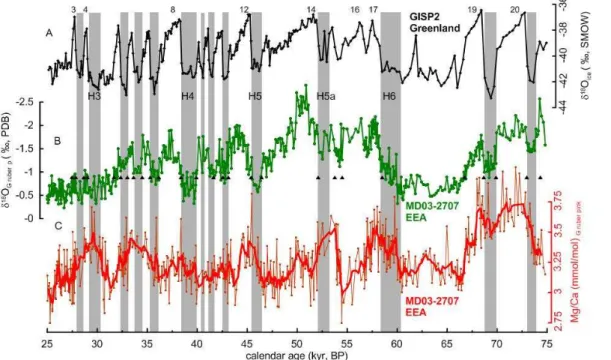
Fig. 4. (A)GISP2 δ18Oice record compared with the δ18O (Weldeab, 2012) (B)and Mg/Ca records(C)analyzed inGlobigerinoides ruber (pink).(C)Orange and bold red lines present individual Mg/Ca measurements and a 5-point running average, respectively. Triangles mark tie points used to align d18O shifts in the MD03-2707 record(B)with the GISP2 d18Oicerecord
CPD
8, 1737–1762, 2012Magnitude and timing of Equatorial
Atlantic surface warming
S. Weldeab
Title Page
Abstract Introduction
Conclusions References
Tables Figures
◭ ◮
◭ ◮
Back Close
Full Screen / Esc
Printer-friendly Version Interactive Discussion
Discussion
P
a
per
|
Dis
cussion
P
a
per
|
Discussion
P
a
per
|
Discussio
n
P
a
per
|