BGD
10, 15951–16001, 2013
Physical and remineralization processes govern the
cobalt distribution
G. Dulaquais et al.
Title Page
Abstract Introduction
Conclusions References
Tables Figures
◭ ◮
◭ ◮
Back Close
Full Screen / Esc
Printer-friendly Version
Interactive Discussion
Discussion
P
a
per
|
D
iscussion
P
a
per
|
Discussion
P
a
per
|
Discuss
ion
P
a
per
|
Biogeosciences Discuss., 10, 15951–16001, 2013 www.biogeosciences-discuss.net/10/15951/2013/ doi:10.5194/bgd-10-15951-2013
© Author(s) 2013. CC Attribution 3.0 License.
Open Access
Biogeosciences
Discussions
This discussion paper is/has been under review for the journal Biogeosciences (BG). Please refer to the corresponding final paper in BG if available.
Physical and remineralization processes
govern the cobalt distribution in the deep
western Atlantic ocean
G. Dulaquais1, M. Boye1, M. J. A. Rijkenberg2,3, and X. Carton4
1
Laboratoire des Sciences de l’Environnement Marin UMR6539, Institut Universitaire Européen de la Mer UMS3113, Technopôle Brest Iroise, Place Nicolas Copernic, 29280 Plouzané, France
2
Department of Marine Biology, University of Groningen, P.O. Box 14, 9750 AA Haren, the Netherlands
3
Department of Marine Chemistry and Geology, Royal Netherlands Institute for Sea Research, P.O. Box 59, 1790 AB Den Burg, the Netherlands
4
Laboratoire de Physique des Océans, Université de Bretagne Occidentale – UFR Sciences, 6 avenue Le Gorgeu, C.S. 93837, 29238 Brest Cedex 3, France
Received: 6 September 2013 – Accepted: 11 September 2013 – Published: 16 October 2013
Correspondence to: G. Dulaquais ([email protected])
BGD
10, 15951–16001, 2013
Physical and remineralization processes govern the
cobalt distribution
G. Dulaquais et al.
Title Page
Abstract Introduction
Conclusions References
Tables Figures
◭ ◮
◭ ◮
Back Close
Full Screen / Esc
Printer-friendly Version
Interactive Discussion
Discussion
P
a
per
|
D
iscussion
P
a
per
|
Discussion
P
a
per
|
Discuss
ion
P
a
per
|
Abstract
The distributions of the bio-essential trace element dissolved Co (DCo) and the appar-ent particulate Co (PCo) are presappar-ented along the GEOTRACES-A02 deep section from 64◦N to 50◦S in the West Atlantic Ocean. PCo was determined as the difference
be-tween total cobalt (TCo, unfiltered samples) and DCo. DCo concentrations ranged from
5
14.7 pM to 94.3 pM, and PCo concentrations from undetectable values to 18.8 pM. The lowest DCo concentrations were observed in the subtropical domains, and the highest in the low-oxygenated Atlantic Central Waters (ACW) that appeared to be the major reservoir of DCo in the West Atlantic. In the Antarctic Bottom Waters, the enrichment in DCo with ageing of the water-mass can be related to suspension and redissolution of
10
bottom sediments a well as diffusion of DCo from abyssal sediments. Mixing and dilu-tion of deep water-masses, rather than scavenging of DCo onto settling particles, gen-erated the meridional decrease of DCo along the southward large-scale circulation in the deep West Atlantic. Furthermore the apparent scavenged profile of DCo observed in the deep waters likely resulted from the persistence of relatively high concentrations
15
in intermediate waters and low DCo concentrations in underlaying bottom waters. We suggested that the 2010 Icelandic volcanic eruption can be a source of DCo that could have been transported in the core of the North-East Atlantic Deep Waters. At intermedi-ate depths, the high concentrations of DCo recorded in the ACW linearly correlintermedi-ated with the apparent utilization of oxygen (AOU), indicating that remineralization of DCo can
20
be significant (representing up to 29 % of the DCo present). Furthermore the preferen-tial remineralization of phosphate (P) compared to Co in these low-oxygenated waters suggested a decoupling between the deep cycles of P and Co. The vertical diffusion of DCo from the ACW appeared to be a significant source of DCo into the surface waters of the equatorial domain. Summarizing the dilution and mixing processes rather than
25
BGD
10, 15951–16001, 2013
Physical and remineralization processes govern the
cobalt distribution
G. Dulaquais et al.
Title Page
Abstract Introduction
Conclusions References
Tables Figures
◭ ◮
◭ ◮
Back Close
Full Screen / Esc
Printer-friendly Version
Interactive Discussion
Discussion
P
a
per
|
D
iscussion
P
a
per
|
Discussion
P
a
per
|
Discuss
ion
P
a
per
|
1 Introduction
In the context of the international GEOTRACES program, unprecedent efforts are un-derway to map the distribution of trace elements and isotopes in the global oceans. Cobalt (Co) is among the important micro-nutrients highlighted in this program. Dis-solved cobalt (DCo) typically occurs at concentrations lower than 150 pM in the open
5
ocean (Knauer et al., 1982; Martin et al., 1990; Fitzwater et al., 2000; Saito and Moffett, 2001; Saito et al., 2004; Ellwood, 2008; Noble et al., 2008; Pohl et al., 2011; Bown et al., 2011), requiring sensitive analytical techniques for its detection (Vega and van den Berg, 1997; Cannizzaro et al., 2000; Saito and Moffett, 2001; Milne et al., 2010; Shelley et al., 2010). Previous studies suggest that DCo can be an hybrid-type metal (Bruland
10
and Lohan, 2003; Noble et al., 2008), with a nutrient-like distribution in surface waters (Martin et al., 1993; Saito and Moffett, 2002; Saito et al., 2004; Jakuba et al., 2008; Noble et al., 2008; Saito and Goepfert, 2008; Bown et al. 2011) and a scavenged-type distribution in the deep ocean (Knauer et al., 1982; Wong et al., 1995; Noble et al., 2008; Boyd and Elwood, 2010). In surface waters, the organic complexation of cobalt
15
can limit its scavenging onto settling particles and increase its bioavailability, notably to cyanobacteria (Saito and Moffett, 2001; Bown et al., 2012a). Cobalt and manganese (Mn) often cycle together through a removal pathway of co-oxidation with manganese driven by microbes, but the biological assimilation of DCo can uncouple the Mn-Co relationship in surface waters (Moffett and Ho, 1996). Furthermore, previous studies
20
showed high DCo concentration in oxygen-depleted waters (Saito et al. 2004, 2005; Noble et al., 2012) that can be due to unfavorable microbial oxidation of DCo decreas-ing its scavengdecreas-ing rate (Noble et al., 2012). Moreover an experimental study on the oxidation processes of cobalt showed that the oxidation of Co is only occurring in the solid phase under anoxic and reductive conditions resulting in the desorption of Co
25
BGD
10, 15951–16001, 2013
Physical and remineralization processes govern the
cobalt distribution
G. Dulaquais et al.
Title Page
Abstract Introduction
Conclusions References
Tables Figures
◭ ◮
◭ ◮
Back Close
Full Screen / Esc
Printer-friendly Version
Interactive Discussion
Discussion
P
a
per
|
D
iscussion
P
a
per
|
Discussion
P
a
per
|
Discuss
ion
P
a
per
|
the thermohaline circulation (Bruland and Lohan, 2003), and to interpret the apparent scavenged-type profile of DCo observed in the deep ocean (Aparicio-Gonzalez et al., 2012). In fact the scavenging of DCo onto settling particles and its stabilization in solu-tion by the complexasolu-tion with organic binding ligands could be the two major pathways controlling the internal cycling of Co in the deep ocean (Saito et Moffett, 2001, 2002).
5
A residence time of 40–120 yr has been estimated for DCo in the deep ocean, that is more than two orders of magnitude longer than its residence time in surface waters (e.g. 0.32 yr; Saito and Moffett, 2002).
Despite these major findings our understanding of the biogeochemical cycle of cobalt in the ocean is still limited, notably in the West Atlantic Ocean where observations of
10
the deep distribution of DCo are scarce. Biological uptake, recycling, scavenging and remineralization processes are suspected to strongly impact the distribution of DCo in the ocean (Saito and Moffett, 2002; Bown et al., 2011; Noble et al., 2008, 2012). Advec-tion of water masses enriched in DCo following contact with continental margins can be a significant source of DCo to intermediate and deep waters (Wong et al., 1995;
15
Saito et al., 2004; Noble et al., 2008; Bown et al., 2011). Others important sources of DCo to surface waters are river (Tovar-Sanchez et al., 2011) and atmospheric de-positions (Shelley et al., 2012). Hydrothermal vents (Bruland and Lohan, 2003) and sediment resuspension can be important sources of DCo to the deep ocean (Bown et al., 2012a).
20
In this study the vertical and meridional distributions of DCo and apparent particulate cobalt (PCo), are presented along the GEOTRACES-A02 section in the West Atlantic Ocean from the East coast of the Greenland (64◦N) to the Malvinas Plateau (50◦S).
The GEOTRACES-A02 transect is revisiting the Atlantic GEOSECS section of 1972, crossing distinct biogeochemical areas such as subtropical, equatorial or subpolar
do-25
distribu-BGD
10, 15951–16001, 2013
Physical and remineralization processes govern the
cobalt distribution
G. Dulaquais et al.
Title Page
Abstract Introduction
Conclusions References
Tables Figures
◭ ◮
◭ ◮
Back Close
Full Screen / Esc
Printer-friendly Version
Interactive Discussion
Discussion
P
a
per
|
D
iscussion
P
a
per
|
Discussion
P
a
per
|
Discuss
ion
P
a
per
|
tions of DCo. In order to understand the vertical DCo distribution, its transportation across the entire West Atlantic Ocean is studied. Additionnaly, mechanisms governing the fractionation of Co between particulate and dissolved fractions are investigated. Finally, the impact of the meso-scale dynamics on the distribution of cobalt in surface waters is also discussed. The cycle and budget of DCo in the surface waters along the
5
section are discussed elsewhere (Dulaquais et al., 2013). This large and deep section together with the relatively high spatial resolution gave us the opportunity to present, for the first time, the largest comprehensive dataset of cobalt in the West Atlantic ocean.
2 Methods
2.1 Cruise track and sampling 10
The samples were collected along the GEOTRACES-A02 section in the West Atlantic ocean, the longest section of the international GEOTRACES program. Four expeditions conducted between 2010 and 2012 were necessary to complete this section spreading from 64◦N to 50◦S along the West Atlantic Ocean (Fig. 1). Three cruises were operated aboard the Dutch R/VPelagia (Legs 1-2-4) and one cruise aboard the British R.S.S.
15
James Cook (Leg 3). The first cruise started in May 2010 from 64◦N to Bermuda in the Sargasso Sea (St. 1–19), followed by the second leg from the station BATS to the Equator (St. 21–41). The section in the South West Atlantic (Leg 3) from 50◦S to the Equator was achieved in 2011 (St. 1b–18b). An additional cruise (Leg 4) was operated in 2012 to complete the first leg fragmented due to bad weather (St. 3c–7c).
20
A total of 47 stations with a vertical resolution of 12–16 depths between 9 m and 5930 m were sampled for dissolved cobalt analyses (DCo), and 15 stations for total (unfiltered) cobalt determinations (TCo). The apparent particulate cobalt concentra-tions (PCo) were calculated by substraction of DCo from TCo. The complete dataset of cobalt (dissolved, total, and apparent particulate) at all stations will be available at the
25
BGD
10, 15951–16001, 2013
Physical and remineralization processes govern the
cobalt distribution
G. Dulaquais et al.
Title Page
Abstract Introduction
Conclusions References
Tables Figures
◭ ◮
◭ ◮
Back Close
Full Screen / Esc
Printer-friendly Version
Interactive Discussion
Discussion
P
a
per
|
D
iscussion
P
a
per
|
Discussion
P
a
per
|
Discuss
ion
P
a
per
|
Samples were taken using the TITAN-CTD frame of NIOZ (Netherlands), with 24 ultra-clean sampling bottles of 24.4 L each made of PVDF plastic (de Baar et al., 2008). The frame was placed in a Class-100 container for sub-sampling (de Baar et al., 2008). Unfiltered samples were transfered into acid cleaned 250 mL Nalgene® LDPE bottles for TCo analyses. The samples for DCo analyses were collected after filtration using
5
0.2 µm Sartobran®300 (Sartorius) cartridges under pure N2pressure (filtered 99.99 % N2, 0.7 atm) in acid cleaned 250 mL or 500 mL Nalgene
®
LDPE bottles. All samples were acidified at pH∼2 using ultrapure HCl®(Merck) immediately after their collection.
Then the acidified samples were stored in double bags at dark and ambient tempera-ture, before their analyses in the shore-based laboratory.
10
2.2 Analytical method for cobalt analyses
2.2.1 Method
Prior to the analyses, the samples were UV-digested (Saito and Moffet, 2002; Shelley et al., 2010) for 3 h in acid clean silica tubes using a 600 W high-pressure mercury vapor lamp (Bown et al., 2011), and left for an equilibration time of 48 h. Preliminary
15
tests indicated that 3 h of UV-digestion were required to fully recover Co in surface and deep samples (data not shown).
Dissolved and total cobalt concentrations were determined by Flow-Injection Analy-sis (FIA) and chemiluminescence detection following the method adapted from Shel-ley et al. (2010), as described in Bown et al. (2011). In this method, cobalt catalyzes
20
the oxidation reaction of pyrogallol with hydrogen peroxide in an alkaline solution in the presence of cetylmethylammoniumbromide (CTAB) and methanol. A chemilumi-nescent emission in the visible wavelengths proportional to the cobalt concentration is produced during this reaction. The system consists of one 10-ports injection valve (VICI valves from VALCO instruments) which operates as an autosampler, and of two
25
BGD
10, 15951–16001, 2013
Physical and remineralization processes govern the
cobalt distribution
G. Dulaquais et al.
Title Page
Abstract Introduction
Conclusions References
Tables Figures
◭ ◮
◭ ◮
Back Close
Full Screen / Esc
Printer-friendly Version
Interactive Discussion
Discussion
P
a
per
|
D
iscussion
P
a
per
|
Discussion
P
a
per
|
Discuss
ion
P
a
per
|
inject the sample and the reagents using Tygon®tubes. The flow injection is provided by a peristaltic pump (205 CA, Watson Marlow).
The reagents are prepared with trace metals quality reagents, as described in Bown et al. (2011). All reagents are prepared under a laminar flow hood (ADS Laminaire, ISO 5 class) in 1 L LDPE Nalgene® bottles with ultrapure water (MiliQ, 18.2 mΩ) the
5
day before the analysis and kept at room temperature for an overnight equilibration. The sample is buffered online with ammonium acetate (0.3 M, ACS Reagents), and load on an IDA-Toyopearl chelating resin to preconcentrate the cobalt contained in the sample. Then a HCl solution (0.1 M, Suprapur®Merck) is injected through the column to elute Co. The elutant is warmed in a 60◦C thermostatic bath to limit the interferences 10
in the detection system due to bubbles (Shelley et al., 2010). The detection system consists of a photomultiplier detector (Hamamatsu, H9319 Series). The injection valves and the photomultiplier detector are operated on a laptop by a modified Labview® 8.4 interface (E. Duvieilbourg and M. Boye, LEMAR). The electrical devices are connected to a modulator of current (ELLIPSEMAX 600, MGE/UPS Systems).
15
The Co concentrations were calibrated against two calibration curves made with standard additions of cobalt of 0, 12.5, 25, 50 and 75 pM to seawater, and performed before and after each series of 8 or 12 samples. TCo and DCo concentrations are based on triplicate analyses of each sample using the mean peak height of the chemi-luminescent signal, and they are corrected with respect to blank analyses. Two to four
20
reagent blanks including the buffer blank were analyzed per series of 8–12 samples at the beginning and at the end of the series, in acidified MilliQ water instead of the sam-ple (Bowie and Lohan, 2009; Bown et al., 2010). DCo and PCo concentrations shown in this study are corrected with their respective reagent blanks.
The final standard deviation of the measurement is calculated by an error
propa-25
er-BGD
10, 15951–16001, 2013
Physical and remineralization processes govern the
cobalt distribution
G. Dulaquais et al.
Title Page
Abstract Introduction
Conclusions References
Tables Figures
◭ ◮
◭ ◮
Back Close
Full Screen / Esc
Printer-friendly Version
Interactive Discussion
Discussion
P
a
per
|
D
iscussion
P
a
per
|
Discussion
P
a
per
|
Discuss
ion
P
a
per
|
ror on PCo is calculated by combining uncertainties of DCo and TCo measurements (SDPCo=(SD
2
DCo+SD 2 TCo)
0.5 ).
2.2.2 Analytical performance
The mean reagent blank (based on all blank determinations) was 4.2±2.1 pM
of Co in MilliQ (n=180). The limit of detection of the method estimated as the
5
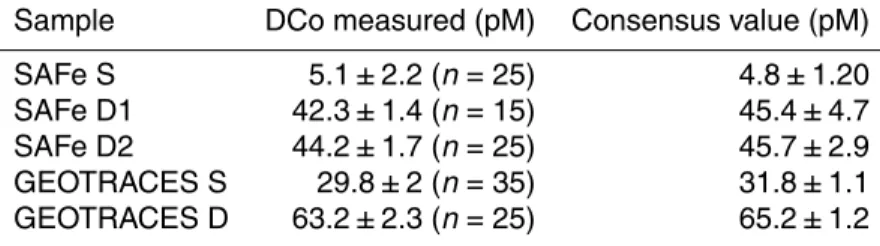
mean reagent blank added to three times the standard deviation (e.g. 6.3 pM) is thus on average 10.5 pM of Co (n=180). Each series of samples was cali-brated by running one or two samples collected during the Sampling and Anal-ysis of iron (SAFe) program or GEOTRACES program. SAFe and GEOTRACES samples were UV-digested for 3 h prior to analysis and the results of DCo
con-10
centrations are reported in Table 1. The DCo concentrations we measured in the SAFe and GEOTRACES reference-samples are in excellent agreement with the con-sensus values http://www.geotraces.org/science/intercalibration/322-standards-and-reference-materials. The DCo value obtained in the S-SAFe sample also falls in the consensus value despite the concentration being lower than the detection limit. The
15
analytical precision of the method was determined from repeated analyses of the sur-face S-GEOTRACES reference-sample, yielding an uncertainty of±3.8 % expressed
as relative standard deviation on the mean (n=15).
2.3 Hydrography
Hydrological parameters (S, T ◦, O2, conductivity, fluorescence and turbidity) were
20
measured using a SBE9+ underwater sensor, a SBE3+thermometer (±0.001◦C), a
SBE4 conductivity sensor (±0.3 mS s−1), a SBE43 dissolved oxygen sensor ±2 %), a
Chelsea Aquatracka MKIII fluorometer±0.2 µg L−1), and a Wetlabs C-Star
BGD
10, 15951–16001, 2013
Physical and remineralization processes govern the
cobalt distribution
G. Dulaquais et al.
Title Page
Abstract Introduction
Conclusions References
Tables Figures
◭ ◮
◭ ◮
Back Close
Full Screen / Esc
Printer-friendly Version
Interactive Discussion
Discussion
P
a
per
|
D
iscussion
P
a
per
|
Discussion
P
a
per
|
Discuss
ion
P
a
per
|
2.4 Macronutrients analysis
Nutrient samples were collected in 125 mL polypropylene bottles using a CTD-rosette (Seabird® equipped with Niskin bottles. The analyses were performed onboard from surface to deep waters samples. All the nutrients were analyzed by colorimetric meth-ods following the methmeth-ods of Riley and Murphy (1962) for phosphate (HPO2−
4 ), of
Strick-5
land and Parsons (1968) for silicate (Si(OH)−4), and of Grasshoffet al. (1983) for nitrate (NO−3) and nitrite (NO2).
3 Results
3.1 Circulation and dynamic structures
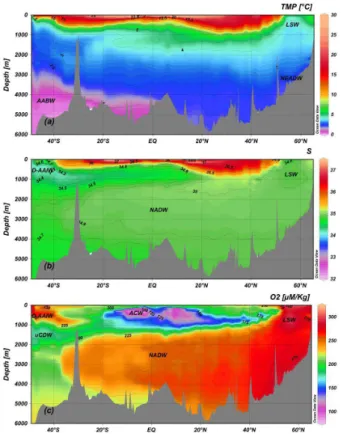
In the North, the section crossed the Sub-Arctic Gyre (SAG) between 64◦N and 50◦N,
10
where the Labrabor Sea Water (LSW) dives to form, with the Arctic Bottom Water, the Western North Atlantic Deep Water (WNADW). Deeper, the Eastern North Atlantic Deep Water (ENADW) is also isolated in the SAG and forms, further south, with the WNADW the North Atlantic Deep water (NADW) (Fig. 2). The well oxygenated and dense waters of the subarctic gyre are separated, in the south, from to relatively
low-15
oxygenated, saline and warm waters of the North Atlantic Subtropical Gyre (NASG) by the North Subtropical Front (NSTF) at ∼45◦N. The NSTF is characterized by a
high anomaly of temperature (+5◦C) and by a strong eastward geostrophic current in surface waters (data not shown) which is likely to be the North Atlantic Drift (Reid, 1994).
20
In the NASG, low-density waters occur in the top 600 m due to relatively high salinity and temperature (T ◦> 10◦C;S> 35) (Fig. 2). However at 15◦N and in a lesser extend at 4◦N these saline waters were covered by relativey fresh waters (Fig. 2), originating
from the Amazon plume. The waters influenced by the Amazon plume were character-ized by relatively high Si : N ratio and turbidity (data not shown).
BGD
10, 15951–16001, 2013
Physical and remineralization processes govern the
cobalt distribution
G. Dulaquais et al.
Title Page
Abstract Introduction
Conclusions References
Tables Figures
◭ ◮
◭ ◮
Back Close
Full Screen / Esc
Printer-friendly Version
Interactive Discussion
Discussion
P
a
per
|
D
iscussion
P
a
per
|
Discussion
P
a
per
|
Discuss
ion
P
a
per
|
Leaving the NASG southwards, the section enters in the equatorial area. Here the zonal geostrophic velocities indicate the presence of several jets at near of the surface, such as the North Equatorial Current (NEC, at 5–10◦N), the North Equatorial Counter-Current (NECC, at ∼3◦N), the South Equatorial Current (SEC, at 5–10◦S) and the
South Equatorial Under-Current (SEUC, at∼5◦S, 200 m depth) as described by Peter-5
son and Stramma (1991). The equatorial domain is bordered by the NEC in the North and by the SEC in the South, both of which were characterized by westward surface geostrophic propagating vectors and similar speed (respectively 0.2 and 0.15 m s−1). Below 100 m, the salinities and temperatures were lower than in the NASG reveal-ing denser waters. An oxygen minimum zone (OMZ; O2< 150 µM) was also observed
10
under these surface currents, between 150 and 600 m (Fig. 2c). Part of this low O2 -signature was due to the advection of the poorly oxygenated Atlantic Central Waters (O2< 50 µM; Noble et al., 2012), flowing westward from the African border across the Atlantic basin.
Southward the section enters into the South Atlantic Subtropical Gyre (SASG)
char-15
acterized, like in the North, by low-density waters associated with relatively high salin-ities and temperatures (Fig. 2a–b). Despite strong eddy activity in this area, clearly observed in the geostrophic current field, the Malvinas-Brazil confluence (MBC), an eastward jet resulting from the Brazil current flowing southward and the Malvinas cur-rent flowing northward, can be located in the Argentine basin around 40◦S (e.g. at 20
station 6b; data not shown). The MBC separates the SASG with saline and relative oxygen-poor waters from the Subantarctic Waters (SAW).
Several water-masses involved in the large-scale ocean circulation were character-ized at depth (Fig. 2). For instance the LSW was charactercharacter-ized by 34.9 <S> 34.8 and O2> 275 µmol kg−
1
in the Subarctic Gyre at 60◦N (Fig. 2). The ENADW (S> 34.925)
25
BGD
10, 15951–16001, 2013
Physical and remineralization processes govern the
cobalt distribution
G. Dulaquais et al.
Title Page
Abstract Introduction
Conclusions References
Tables Figures
◭ ◮
◭ ◮
Back Close
Full Screen / Esc
Printer-friendly Version
Interactive Discussion
Discussion
P
a
per
|
D
iscussion
P
a
per
|
Discussion
P
a
per
|
Discuss
ion
P
a
per
|
(AABW) characterized byS< 34.8 andT◦< 1◦C is formed in the Weddell Sea (Reid,
1989; Gladyshev et al., 2008) and spreads at the bottom of the ocean below 4000 m. The AABW enters the Atlantic Ocean by the south and follows the topography until 3◦N. To the north the bottom waters are a mix between AABW, Arctic Bottom
Wa-ters (ABW) and NADW (Tomczak and Godfrey, 2003). In the southern hemisphere,
5
the relative fresh Antarctic Intermediate Waters entering from the Drake Passage (D-AAIW;S> 34.2) are identified at intermediate depths between 500 and 1000 m. Finally, the oxygen distribution enables to distinguish the different components of the Circum-polar Deep Waters (CDW; Whitworth and Nowlin, 1987), with its upper component (UCDW) at about 1500 m marked by O2< 190 µmol kg−1, and its intermediate com-10
ponent (ICDW) at about 2500 m with O2> 210 µmol kg− 1
(Fig. 2c). The intermediate waters in the equatorial domain are formed by a mix of AAIW and UCDW that both flow northward and of the Atlantic Central Waters (ACW) originated from the East At-lantic basin (Poole and Tomczak, 1999). However it has to be noted that the transitions between the different water masses vary with the latitude (Fig. 2).
15
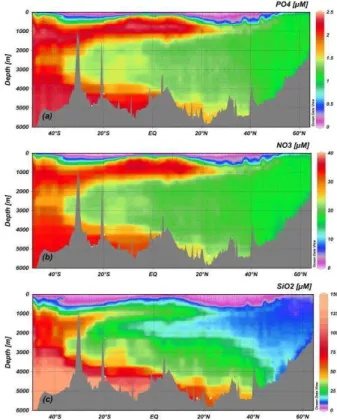
3.2 The nutrients distribution along the section
Different biogeochemical domains were characterized in surface waters along the sec-tion (Fig. 3). The surface waters of the SAG were marked by relatively high phos-phate and nitrate concentrations (NO3 > 10 µM; PO4> 0.8 µM). In the two subtrop-ical domains the extremely low nutrients concentrations (such as observed in the
20
NASG where PO4< 0.5 µM, NO3< 5 µM, Si < 5 µM) were characteristic of oligotrophic conditions. However a greater depletion of nitrogen relative to phosphate was ob-served in the upper 300 m of the SASG (N : P < 10) compared to the NASG (N : P > 25) probably due to a greater proportion of N2 fixers, such as diazothrophic cyanobac-teria, in the NASG than in the SASG (Mather et al., 2008). In the equatorial area,
25
BGD
10, 15951–16001, 2013
Physical and remineralization processes govern the
cobalt distribution
G. Dulaquais et al.
Title Page
Abstract Introduction
Conclusions References
Tables Figures
◭ ◮
◭ ◮
Back Close
Full Screen / Esc
Printer-friendly Version
Interactive Discussion
Discussion
P
a
per
|
D
iscussion
P
a
per
|
Discussion
P
a
per
|
Discuss
ion
P
a
per
|
Atlantic. South of the South Subtropical Front, the nutrients distribution showed, as for oxygen, the influence of the AAIW and UCDW with relative high nutrient concen-trations in the top 200 m depths (NO3 > 20 µM, PO4> 1.2 µM). In the deep ocean the nutrients distribution reflected a combination of ageing and advection of water-masses (Fig. 3). The spreading of young NADW can be followed with the low-nutrients
sig-5
nature (Si < 35 µM; NO3< 20 µM; PO4< 1.5 µM). Phosphate and nitrate concentrations increase southward in the deep ocean (Fig. 7), due to mixing of Arctic waters (poor in nutrients) with nutrients-enriched Antarctic waters. The AABW is characterized by relatively high nutrients concentrations (Si > 130 µM; NO3> 30 µM; PO4> 2 µM) that de-crease northward. The nutrient concentrations in the Circumpolar Deep Waters are
10
similar to those of AABW, but the concentrations in the ICDW were a little bit lower than those in the UCDW. The silicate levels are depleted in the AAIW compared to others Antarctic waters.
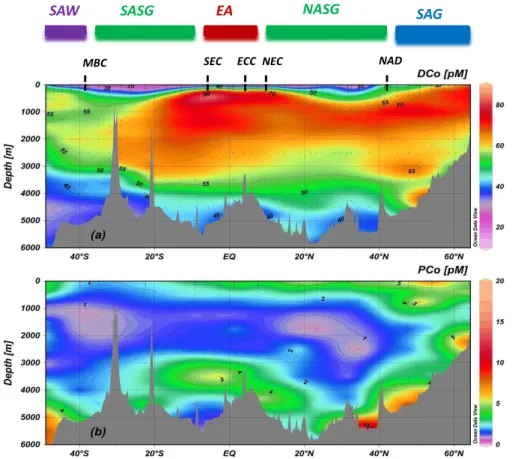
3.3 The comprehensive distribution of cobalt in the West Atlantic
The meridional and vertical distributions of DCo along the section are presented in
15
Fig. 4a. Dissolved cobalt concentrations range from 14.72±1.43 to 93.27±3.31 pM
along the section. The lowest concentration was observed in surface waters of the SASG (e.g. at 9 m depth at St.#11b–26◦S) whereas the highest were recorded in the
OMZ of the equatorial area (e.g. at St.#15b–9◦S at 290 m depth). The vertical dis-tributions of the apparent particulate cobalt concentrations (PCo) calculated as the
20
difference between the unfiltered and the filtered (< 0.2 µm) analyzed fractions, are presented in Fig. 4b. The apparent particulate cobalt concentrations ranged from near undetectable values (e.g. the difference between unfiltered and filtered samples anal-yses is not significant) to 18.85±3.97 pM (e.g. at St.#17–34.3◦N at 5510 m depth).
PCo / DCo ratio range from 0.06 % (St. 17; 2500 m) to 44 % (St. 26, 25 m),with a mean
25
of 7 % (n=192).
BGD
10, 15951–16001, 2013
Physical and remineralization processes govern the
cobalt distribution
G. Dulaquais et al.
Title Page
Abstract Introduction
Conclusions References
Tables Figures
◭ ◮
◭ ◮
Back Close
Full Screen / Esc
Printer-friendly Version
Interactive Discussion
Discussion
P
a
per
|
D
iscussion
P
a
per
|
Discussion
P
a
per
|
Discuss
ion
P
a
per
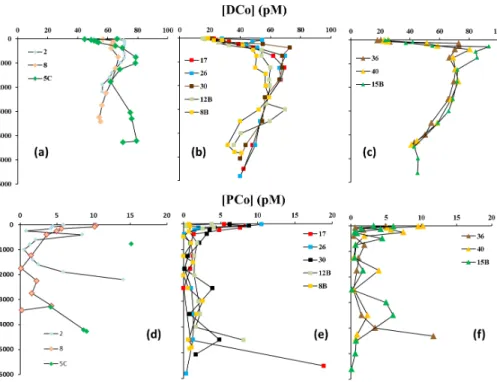
|
northern subarctic gyre (Figs. 4a–5a), with relatively higher concentrations in surface waters (DCoupper 200 m> 70 pM) compared to deeper waters (DCobelow 2000 m< 60 pM). In this domain, lower surface DCo concentrations were recorded in 2012 during leg-4 (e.g. 42.1±2.15 pM at St.#3c, and 44.23±1.26 pM at St.#4c, at 25 m depth) compared to
those observed in 2010 during leg-1 (e.g. mean DCo=64.56±5.25 pM at 25 m (n=4), 5
with a DCo maximum of 68.2±1.08 pM at St.#5). At intermediate depths (500–1000 m)
the LSW was characterized by relatively high DCo concentrations (DCo∼70 pM)
com-pared to those found in the ENADW (DCo ∼55 pM below 2000 m). In this domain,
the apparent particulate cobalt distribution showed relative PCo maxima in the sub-surface (ranging from 5.9±1 to 10.4±1.96 pM), and decreasing concentrations with 10
depth (until undetectable levels around 1500 m depth). Maxima of PCo (> 10 pM) were then observed near the bottom (at St.#2&11).
In contrast, DCo was depleted in the surface waters of the two subtropical domains and increased with depth below the nutricline, featuring a nutrient-like distribution (Figs. 4a–5b). However, DCo are slightly lower and shallower in the SASG (mean DCo
15
value of 23.01±4.17 pM, n=9) compared to those found in the NASG (mean DCo
value of 28.8±4.8 pM,n=15). Subsurface relative maxima of DCo were observed at
about 10 m depth at a few stations in the NASG. Deep relative DCo maxima were also observed at around 1250–1750 m depth in the NASG, that are in the core of NADW and below the oxygen minima. On the contrary relative DCo maxima and oxygen minima
20
were often locate at the same depth in the SASG, within the core of the mixed NADW. In the AABW of the SASG, DCo was on average equal to 42.8±2.23 pM (n=15).
In the two subtropical gyres, the PCo concentrations ranged from undetectable value (e.g. at 2500 m of St.#17) to 18.85±3.97 pM (at 5510 m−34.3◦N). Like in the
north-ern latitudes, relatively high PCo concentrations were observed in the surface waters,
25
BGD
10, 15951–16001, 2013
Physical and remineralization processes govern the
cobalt distribution
G. Dulaquais et al.
Title Page
Abstract Introduction
Conclusions References
Tables Figures
◭ ◮
◭ ◮
Back Close
Full Screen / Esc
Printer-friendly Version
Interactive Discussion
Discussion
P
a
per
|
D
iscussion
P
a
per
|
Discussion
P
a
per
|
Discuss
ion
P
a
per
|
In the equatorial area, the DCo distribution was characterized by low concentrations in the top 100 m (mean DCoR100 m=29.6±9 pM, n=44), a sharp increase between 100 and 250 m (mean DCoR100−250 m=61.7±13 pM,n=10), that continued to increase to reach maximum values at about 400 m depth (mean DCoR250−400 m=73.2±10 pM,
n=19) (Figs. 4–5c). These maximum concentrations were the highest values recorded
5
along the section and reached values up to 93.27±3.31 pM (at 9◦S). Furthermore
these DCo maxima strongly correlated with the oxygen depletion (∆DCo/∆O2=
−0.28 µM M−1, R2> 0.66). Between 1000 and 2500 m depth, the DCo
concentra-tions were in the same range as those observed at 100–250 m depths (mean DCoR1000−2500 m=67.6±5.8 pM, n=33). Deeper DCo concentrations decrease to a
10
mean value of 41±4 pM (n=15) below 4000 m. The distribution of PCo in the
equa-torial domain was similar to that observed in the other domains, with several ex-tremely low (undetectable) values in deep waters and relatively higher concentrations (PCo < 5 pM) in surface waters, up to a maximum value of 10.24±2.1 pM observed at
10 m at St.#40 (1.15◦N). A different pattern was however observed in the deep
wa-15
ters at 8◦N (St. 36), where significant and increasing PCo concentrations were de-tected between 3500 m (1.52±0.7 pM) and 4315 m (11.73±1.9 pM), as well as at 3◦S
(St.#17b) where extremely high PCo concentrations were measured at 3500 m depth (12.53±2.4 pM). In the surface waters, high PCo concentration (∼10 pM) is measured
at 1◦N (St.#40) in the Amazon plume. 20
In the area of the Brazil-Malvinas confluence, DCo increased southward in the sur-face waters. The vertical distribution showed the highest DCo concentrations in the core of D-AAIW (100–600 m; Fig. 4a), whereas DCo levels decrease in deeper wa-ters, generating an apparent scavenged-type distribution at latitudes of 49–49.5◦S (St.#1b–2b). The DCo concentrations observed in the youngest-AABW flowing in this
25
BGD
10, 15951–16001, 2013
Physical and remineralization processes govern the
cobalt distribution
G. Dulaquais et al.
Title Page
Abstract Introduction
Conclusions References
Tables Figures
◭ ◮
◭ ◮
Back Close
Full Screen / Esc
Printer-friendly Version
Interactive Discussion
Discussion
P
a
per
|
D
iscussion
P
a
per
|
Discussion
P
a
per
|
Discuss
ion
P
a
per
|
(PCo > 6 pM), and, as for the other domains, undetectable PCo concentrations in deep-waters, except at 5000 m where PCo reached a maximum (11.8±3.4 pM).
4 Discussion
The scientific objective of this paper is to examine the spatial distributions of cobalt and its transportation along the entire West Atlantic Ocean. Firstly intercomparison between
5
this dataset and others at three stations located in different biogeochemical domains will be presented. Then the cobalt distributions within the different water masses, in distinct geographic areas, will be discussed. In addition, the potential effect of 2010 Icelandic volcano Eyjafjallajökull eruption on the distribution of DCo will be discussed. The previous observation of cobalt transportation in the central-eastern Atlantic OMZ
10
that suggests no scavenging process (Noble et al., 2012) motivated us to investigate the relationship between remineralization, scavenging and the decoupling of cobalt and phosphate in the O2depleted waters of the western central Atlantic. Finally in a meso-scale approach, the effect of dynamic structures on the surface DCo transportation and their impact on diffusion process will be considered.
15
4.1 Comparison of datasets of dissolved cobalt concentrations obtained at three crossover stations
Three crossover stations were occupied along the GEOTRACES-A02 section, at the Bermuda Atlantic Time Series BATS station (64.17◦W–31.7◦N), at 9◦S during the US CoFeMUG cruise in 2007, and at 40◦S during the English GEOTRACES-A10 section
20
in 2012 (Fig. 6).
Station BATS in the Sargasso Sea was occupied on 13 June 2010 during our GA02-section (St.#21). The DCo concentrations analyzed by FIA-chemiluminescence method (this study, Figs. 6a and d: blue diamonds), are compared to those obtained by ICP-MS methods either in the same samples (Middag et al., 2013; Fig. 6a and d: yellow dots), or
BGD
10, 15951–16001, 2013
Physical and remineralization processes govern the
cobalt distribution
G. Dulaquais et al.
Title Page
Abstract Introduction
Conclusions References
Tables Figures
◭ ◮
◭ ◮
Back Close
Full Screen / Esc
Printer-friendly Version
Interactive Discussion
Discussion
P
a
per
|
D
iscussion
P
a
per
|
Discussion
P
a
per
|
Discuss
ion
P
a
per
|
during other sampling cruises (Biller and Bruland, 2012: green triangles in Fig. 6a and d; Middag et al., 2013: red squares in Fig. 6a and d). All samples were analyzed after UV treatment. In the deep waters, no significant differences were observed between the different datasets, even when samples were taken in different years. On the con-trary, differences were observed in surface waters (25–200 m), with systematic higher
5
DCo values using the ICP-MS compared to the FIA-Chem. method. It is possible that seasonal variability, especially of atmospheric inputs to surface waters, would cause those variations of DCo levels recorded in surface waters (Biller and Bruland, 2012; Middag et al., 2013; Fig. 6a and d: green triangles and red squares, respectively). However further investigations are needed, because differences are also observed in
10
the same set of samples (this study; Middag et al., 2013: yellow dots in Fig. 6a and d), yielding an offset of 6–20 pM DCo in the top-100 m between the ICP-MS method and FIA-Chem. analyses.
At 9◦S, the DCo concentrations analyzed by FIA-chemiluminescence in the samples
collected during the GA02-section (23 March 2011, St.#15b, this study) were
com-15
pared with data analyzed by Cathodic Stripping Voltametry after UV-treatment, but in non-acidified samples (Noble et al., 2012). Despite the fact that the two stations are not exactly at the same location and that they were sampled in different years, the hydrography and the nutrient distributions were similar (data not shown) allowing for the comparison of the DCo datasets. The comparison showed an excellent correlation
20
(R2> 0.98; Fig. 10e), suggesting that both analytical methods were in good agreement. At 40◦S, the two DCo datasets sampled during the GA02-section (10 March 2011, St.#6b, this study) and the GA10-section (January 2012; Lohan et al., 2013) were ob-tained using similar FIA-chemiluminescence methods after UV-digestion of the acidi-fied sample. It showed an excellent agreement between the two datasets in the upper
25
BGD
10, 15951–16001, 2013
Physical and remineralization processes govern the
cobalt distribution
G. Dulaquais et al.
Title Page
Abstract Introduction
Conclusions References
Tables Figures
◭ ◮
◭ ◮
Back Close
Full Screen / Esc
Printer-friendly Version
Interactive Discussion
Discussion
P
a
per
|
D
iscussion
P
a
per
|
Discussion
P
a
per
|
Discuss
ion
P
a
per
|
this difference. Further investigation is needed to determine the sources of this diff er-ence.
4.2 Large-scale transportation of dissolved cobalt in the West Atlantic
The behavior of DCo in the deep ocean is still poorly understood due to the lack of ob-servations in the full water-column, notably in the West Atlantic Ocean, as well as in the
5
Indian and the central Pacific oceans. The few studies that report DCo concentrations in the deep ocean suggest a decrease of DCo levels in the deep waters from the Atlantic Ocean (80.8 pM), to the Southern Ocean (39.7 pM), and to the Pacific (28.8 pM) (Bown et al., 2011; Aparicio-Gonzalez et al., 2012). This leads to the hypothesis there is no accumulation of DCo along the thermohaline circulation, and to classify DCo amongs
10
either the scavenged-type element like aluminium (Aparicio-Gonzalez et al., 2012) or the hybrid-type metals, those elements strongly influenced by scavenging processes in deep waters (Noble et al., 2008). However the scavenging of DCo invoked to interpret the deep inter-basins fractionation is paradoxical with DCo known to be stabilized in so-lution by strong complexation with organic ligands (conditional stability constant,KCoL,
15
> 1013) (Saito and Moffett, 2001; Saito et al., 2004, 2005, 2010; Bown et al., 2012a). On the other hand other processes, such as mixing of water-masses, have also been suggested to account for the decrease of DCo along water-masses circulation in the deep ocean (Noble et al., 2012). In this paragraph we investigate the behavior of DCo along the water-masses transportation in the deep and intermediate West Atlantic.
20
4.2.1 Transportation in bottom waters within the core of AABW
The Antarctic Bottom Waters spread northward with transport 2.5 and 5 Sv (where 1 Sv is equal to 106m3s−1) following the topography, in an opposite direction to the overlay-ing NADW (Tomczak and Godfrey, 2003). The mean DCo concentration in the AABW below 4000 m is 41.75±5.3 pM along the whole transect (n=87), but higher DCo lev-25
BGD
10, 15951–16001, 2013
Physical and remineralization processes govern the
cobalt distribution
G. Dulaquais et al.
Title Page
Abstract Introduction
Conclusions References
Tables Figures
◭ ◮
◭ ◮
Back Close
Full Screen / Esc
Printer-friendly Version
Interactive Discussion
Discussion
P
a
per
|
D
iscussion
P
a
per
|
Discussion
P
a
per
|
Discuss
ion
P
a
per
|
recently formed-AABW flowing in the South (mean values of 44.52±4.8 pM, n=42;
and 39.29±4.4 pM, n=45, respectively). At the same southern latitudes, DCo
con-centrations were similar to those reported in the core of the recently formed AABW, but in the Eastern Atlantic Ocean (Bown et al., 2011; Table 2). Similar northward bottom enrichment of DCo in the core of AABW (Fig. 7a), together with water-mass
path-5
way and ageing, has also been observed in the Eastern Atlantic sector (Bown et al., 2011). Enrichment due to mixing of the AABW with the NADW in the Subarctic basin is unlikely since DCo display similar concentrations in the cores of these two water-masses (Table 2). Bottom enrichment due to resuspension of abyssal sediments and their dissolution during AABW transportation is more likely to account for the northward
10
increase of DCo. Such enrichment of DCo in waters following contact with basaltic sed-iments has recently been highlighted on the Kerguelen Plateau (Bown et al., 2012b). The significant increase of PCo observed close to the seafloor in the northern hemi-sphere (Fig. 5), rising up to 30 % of the total cobalt concentration at 34◦N, also
sug-gests that sediment resuspension could be significant. This is further supported by
15
the strong signal of high dissolved aluminium concentrations observed in the bottom waters of the northern section (40–50◦N) (R. Midagg, NIOZ, personal communication,
2013). Additionaly there was no record of high DCo at the bottom of the Mid Atlantic Ridge (Fig. 4a), suggesting that hydrothermal activity may not be acting as a significant source of DCo, as previously shown (Bown et al., 2011).
20
4.2.2 Transportation in the core of the NADW
Comparison of the DCo concentrations recorded in this study in the cores of the NEADW, NADW and D-AAIW with those reported in the south-eastern Atlantic (Bown et al., 2011) shows an excellent agreement (Table 2). This comparison suggests that DCo may not be scavenged during zonal (eastward) transportation across the South
25
Atlantic at intermediate and deep depths.
BGD
10, 15951–16001, 2013
Physical and remineralization processes govern the
cobalt distribution
G. Dulaquais et al.
Title Page
Abstract Introduction
Conclusions References
Tables Figures
◭ ◮
◭ ◮
Back Close
Full Screen / Esc
Printer-friendly Version
Interactive Discussion
Discussion
P
a
per
|
D
iscussion
P
a
per
|
Discussion
P
a
per
|
Discuss
ion
P
a
per
|
along its route southward, with respect to its mean DCo concentrations at three dif-ferent potential density anomaly, corresponding to its center (σ0=27.85±0.02), its
upper-limit where the NADW interacts with intermediate waters (e.g.σ0=27.65±0.1),
and its lower-limit in contact with bottom waters (e.g.σ0=27.89±0.015) (Fig. 7b). No
significant variations are observed along these isopycnes from the Subarctic Gyre to
5
the Equatorial area (e.g. DCo=68.7±6 pM,n=62 atσ0=27.65; 58.8±3 pM,n=19
atσ0=27.85; 56.9±7 pM,n=21 atσ0=27.89), suggesting conservative behavior of
DCo in the NADW. Around the equator DCo concentration increased at two potential density (71.4±4.4 pMn=10 atσ0=27.65; 62.6±5 pM,n=14 atσ0=27.85) and
de-crease in the denser waters (DCo=51.9±8 pM, n=20 at σ0=27.89). There was no 10
variation of PCo in this area atσ0=27.65 andσ0=27.85, and an increase of PCo at σ0=27.89 (by 4.6 pM), all suggesting that remineralization of PCo could not be directly related to the increases in DCo at those depths. Hence the enrichment of DCo in the upper NADW may be more likely due to mixing with the overlaying Western Atlantic Central Water (W-ACW), containing relatively high DCo concentrations (> 85 pM).
15
Southward, the concentrations of DCo and PCo in the three layers were simi-lar to those observed in the Equatorial area until 20◦S (σ0=27.88) or 30◦S (along
σ0=27.65 andσ0=27.85) (Fig. 7), again suggesting that DCo behaves conservatively at those southward latitudes. However, south of 20◦S, a decrease of DCo concentra-tions was observed along the three isopycnes (Fig. 7). This decrease was more
pro-20
nounced at the upper- and lower-limits than in the center of the NADW (e.g. the diff er-ence of concentrations between the North and the South Atlantic are:∆DCoσ0=27.65= −11.5 pM;∆DCoσ0=27.85= +1.5 pM;∆DCoσ0=27.89=−10.3 pM). There was no vari-ation in the PCo concentrvari-ations associated with the decreases in DCo at the three depths (Fig. 4b), again suggesting that scavenging of DCo onto particles is not likely.
25
BGD
10, 15951–16001, 2013
Physical and remineralization processes govern the
cobalt distribution
G. Dulaquais et al.
Title Page
Abstract Introduction
Conclusions References
Tables Figures
◭ ◮
◭ ◮
Back Close
Full Screen / Esc
Printer-friendly Version
Interactive Discussion
Discussion
P
a
per
|
D
iscussion
P
a
per
|
Discussion
P
a
per
|
Discuss
ion
P
a
per
|
of the water-masses, the center of the NADW would be less impacted by such mixing effect.
We further investigate the effect of water-masses mixing on the southward DCo gradients along the NADW by calculating the DCo concentrations resulting from the dilution of intermediate and deep water-masses. In the northern section, the
5
NADW is formed by mixing 5 Sv of LSW with a mean DCo concentration of 68.8±3.17 pM (n=38; Table 2), with 10 Sv of NEADW with a mean DCo
concentra-tion of 54.3±2.69 pM (n=24; Table 2) (Tomczak and Godfrey, 2003). The resulting
theoretical concentration of DCo of 59.13 pM compared perfectly with the mean DCo concentration as observed in the NADW (61.4±7.8,n=204; Table 2). In the equatorial 10
area, the mixing of 15 Sv of the NADW with the 4 Sv of the W-ACW (Schmitz, 1995) leads to a theoretical DCo concentration of 66.1 pM, which is in excellent agreement with our measurements in this area (DCo=65.3±7, n=43). The slight increase
ob-served in the DCo concentration of the NADW in this area can thus be due to mixing between the high DCo concentrations of the Western-ACW and the NADW, and to
ver-15
tical diffusion. The vertical mixing occurs through internal waves that can provide a mix of more than half of the NADW (up to 8 Sv) (Webb and Suginohara, 2001). Along the southward flow of the NADW in the Southern Hemisphere, the DCo concentrations are higher than in the north (DCo=63.7±7 pM,n=23) until 30◦S, beyond which a strong
decrease is observed (DCo=54.6±7 pM,n=45). Here, the penetration of the 2.7 Sv 20
of D-AAIW (You, 2002) in the intermediate ocean, and the 5 Sv of AABW in the deep sea (Tomczak and Godfrey, 2003) leads to a theoretical DCo concentration of 54 pM in the NADW, which is in excellent agreement with the concentration we measured in the NADW for this area (54.3±6.6 pM,n=41). Thus mixing with overlaying
water-masses seems to control the concentrations of DCo along the circulation pathway of
25
BGD
10, 15951–16001, 2013
Physical and remineralization processes govern the
cobalt distribution
G. Dulaquais et al.
Title Page
Abstract Introduction
Conclusions References
Tables Figures
◭ ◮
◭ ◮
Back Close
Full Screen / Esc
Printer-friendly Version
Interactive Discussion
Discussion
P
a
per
|
D
iscussion
P
a
per
|
Discussion
P
a
per
|
Discuss
ion
P
a
per
|
Atlantic Ocean along the thermohaline circulation. In turn the apparent scavenged pro-file observed in the southern part of the section (SAW) results from incursion of DCo depleted waters at the bottom of the ocean (AABW), and D-AAIW in intermediate wa-ters.
4.2.3 Temporal variation in the Subarctic gyre 5
During leg 4 (2012), re-sampling of the subarctic gyre showed that the DCo con-centration in the NEADW below 3000 m increased with 20.5±5 pM when comparing
station 5c of leg 4 with the stations 9 and 10 of leg 1, see Fig. 4a. Integrated on the thickness of the NEADW (1250 m), the DCo concentration in excess was about 25.6±6.3 µmol m−2. Associated with these relatively high DCo concentrations, rela-10
tively high PCo concentrations were also observed below 3000 m depth (PCo > 5 pM; Figs. 4b and 5d). The transit time of the NEADW to this latitude is estimated to be around 2 yr (Fine et al., 2001). Two possible hypotheses could be invoked to explain this anomaly observed at this location: (i) intensive sediments input in the NEADW through resuspension-dissolution and/or diffusive processes during its circulation abve
15
the seafloor; (ii) strong external input of cobalt to the Arctic surface waters transfered to the deep ocean by the formation of the NADW and its transportation through the deep large scale circulation.
Considering an input of DCo from dissolution of basalt or granit rocks of 0.054±0.014 to 2±0.22 10−11mol m−2d−1(Hausrath et al., 2009) and assuming this 20
input would be continuous during the transit of the NEADW, the maximum cumulative input after two years of transit would be 7.3 nmol m−2, which is three orders of mag-nitude lower than the excess observed. On the other hand, when considering a diff u-sive flux of Co from basalt of 31.1 nmol m−2
d−1
estimated on the eastern Kerguelen Plateau (Bown et al., 2012a) and assuming a cumulative effect along the
transporta-25
tion of the water-masses, we can explain the excess in DCo observed at station 5c, since the the input would be 22.7 µmol m−2. However the relatively poorly oxygenated
BGD
10, 15951–16001, 2013
Physical and remineralization processes govern the
cobalt distribution
G. Dulaquais et al.
Title Page
Abstract Introduction
Conclusions References
Tables Figures
◭ ◮
◭ ◮
Back Close
Full Screen / Esc
Printer-friendly Version
Interactive Discussion
Discussion
P
a
per
|
D
iscussion
P
a
per
|
Discussion
P
a
per
|
Discuss
ion
P
a
per
|
high slope current (0.08 cm s−1) could have enhanced sediment re-suspension (Bown et al., 2012b), and makes a comparison with our rather well ventilated bottom waters (O2> 270 µM) difficult. Anyway if sediment re-suspension and dissolution would explain the increase in DCo we would also expect to find an increase in DCo along the path-way of the NEADW, however this is not observed (Fig. 4a). Therefore we cannot use
5
benthic input of DCo as an explanation for the enhanced DCo concentrations that we observed in 2012.
In April–May 2010 the Islandic volcano Eyjafjallajökull erupted. Considering the tran-sit time of the NEADW of 2 yr (Fine et al., 2002) between the area of its formation in the Arctic to the latitude where the excess of DCo is observed two years after the
10
eruption in 2012, it is thus conceivable that the DCo enrichment could be related to the dissolution of Co from these volcanic ashes. Volcanic ash emissions and subsequent deposition to the surface ocean have been reported to be a source of Co to the ocean (Frogner et al., 2001). To estimate the potential contribution of this eruption to the DCo concentrations of the surface waters in the forming area of the NEADW, we used the
15
ash deposition flux of this eruption and the dispersion of the Icelandic ash deposits in the surface waters (Gudmundsson et al., 2012). Most of the ash deposition occured close to the vent, with 98 % of the tephra being transported less than 600–700 km from the source, and then decreasing exponentially (Gudmundsson et al., 2012). Us-ing an ash deposition model and the mean bulk density determined by Gudmundsson
20
et al. (2012), we estimated an ash input of 1.68±0.7×10¹⁴grams of tephra in the first
9×10⁴km2around Iceland, where the NEADW is formed. Using this input and a mean
release of 8.76 nmol of DCo per gram of similar Iceland tephra (Frogner, 2001), we estimated a mean aeolian Co contribution to this area of around 16.3±6.3 µmol m−2
DCo. Reported to the top-100 m, it represents an input of DCo of 163±63 pM, which 25
is at least 1.5 and up to 2.5 times the concentration observed in upper 100 m at simi-lar latitudes in the western subarctic gyre (DCoR100 m=67.2±2 pM), and much higher
than the excess of DCo observed southward two years later (20.5±5 pmol). However
BGD
10, 15951–16001, 2013
Physical and remineralization processes govern the
cobalt distribution
G. Dulaquais et al.
Title Page
Abstract Introduction
Conclusions References
Tables Figures
◭ ◮
◭ ◮
Back Close
Full Screen / Esc
Printer-friendly Version
Interactive Discussion
Discussion
P
a
per
|
D
iscussion
P
a
per
|
Discussion
P
a
per
|
Discuss
ion
P
a
per
|
station 5c are in the same order of magnitude (DCovolcanic input=16.3±6.3µmol m− 2
; DCoexcess=25.6±6.3 µmol m−2). It is thus conceivable that the deposition of the
vol-canic ashes in the surface waters in the North of the section and their dissolution along the transportation of the pathway NEADW could have caused the increase in DCo observed in 2012 in this water-mass.
5
4.2.4 The incursion of the Atlantic Central Waters
The highest concentrations of DCo observed at intermediate depths in the equatorial area of the section are found in the core of the Atlantic Central Waters (ACW) that orig-inate from the Eastern Atlantic (Poole and Tomczak, 1999), and those DCo maxima correlate with the O2 minimum (Figs. 2c, 4a, 5c). At these latitudes but in the eastern
10
Atlantic, the O2 depletion (Tomczak and Godfrey, 2003) and the DCo concentrations (> 150 pM; Noble et al., 2012) are even higher in the ACW compared to the western Atlantic, suggesting a zonal westward transportation of DCo across the central Atlantic ocean. Reductive dissolution in the poorly oxygenated waters, resuspension of partic-ulate matter in the sediments along the shelfs of the eastern Atlantic, and
remineral-15
ization processes are suspected to cause the DCo enrichment in the ACW observed in the eastern Atlantic (Noble et al., 2012). As suggested here above, mixing processes with the NADW can then contribute to the decrease in the DCo concentrations along the westward transportation of the ACW, whereas DCo appears to be insensitive to scavenging during transportation of this water-mass could not be discerned from water
20
mass mixing (Noble et al., 2012). Once reaching our meridian section, the concentra-tion of DCo continued to decrease northward in the flow of the ACW (from 93±1.3 pM
at 290 m, St.#15b to 73±0.6 pM at 150 m, St.#36). The incursion of the ACW
consti-tutes the major reservoir of DCo in the West Atlantic between the equatorial domain and the Caribbean basin. The decrease of DCo concentrations during the zonal and
25
BGD
10, 15951–16001, 2013
Physical and remineralization processes govern the
cobalt distribution
G. Dulaquais et al.
Title Page
Abstract Introduction
Conclusions References
Tables Figures
◭ ◮
◭ ◮
Back Close
Full Screen / Esc
Printer-friendly Version
Interactive Discussion
Discussion
P
a
per
|
D
iscussion
P
a
per
|
Discussion
P
a
per
|
Discuss
ion
P
a
per
|
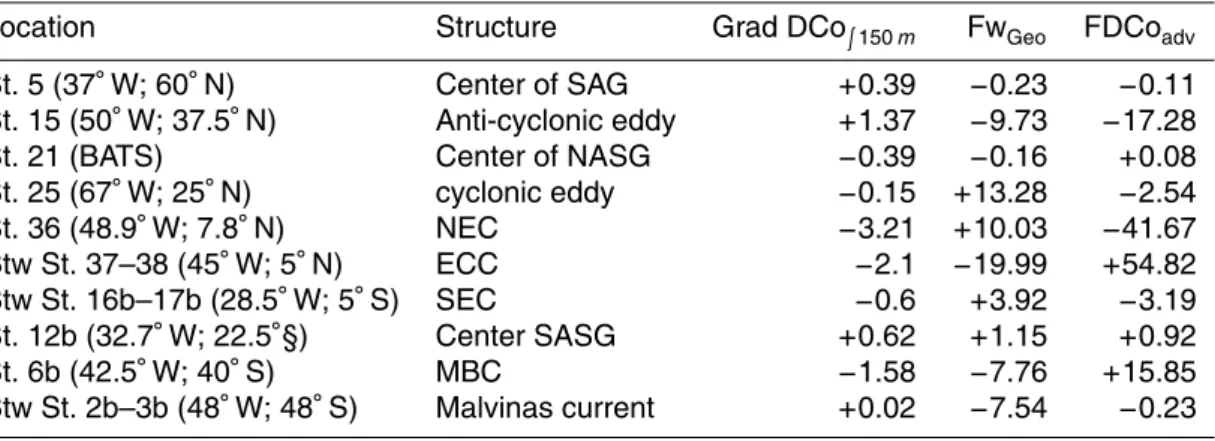
5f). Using a mean difference of DCo concentrations integrated on the W-ACW between St.#15b (9◦S; 28◦W) and St.#36 (8◦N; 49◦W) of 15 nmol m−3and considering a preser-vation of the 4 Sv introduced by the ACW in this area (Schmitz, 1995), we estimate this decrease rate of DCo of about (5.2±0.5)×103mol d−1between 9◦S and 8◦N.
Consid-ering a surface of 2×10⁶km2occupied by the ACW between 9◦S and 8◦N this loss due 5
to mixing processes corresponds to 2.6±0.25 nmol m−2d−1. This loss rate compares
well with the one we estimate between 10◦E and 30◦W using published DCo values for the eastern area (Noble et al., 2012). In the central Atlantic Ocean (10×106km2), the
decrease of DCo of 56±14.8 nmol m−3 between those longitudes which corresponds
to a loss rate of 1.93±0.5 nmol m−2d−1. However we suggest hereafter that this loss 10
of DCo can also be partially due to vertical diffusion and advection of DCo to the sur-face waters especially close to the Equatorial currents where frontal systems and high turbulence were observed.
4.3 Remineralization and decoupling of the cobalt and phosphate relationship in the intermediate West Atlantic
15
4.3.1 Remineralization of cobalt in the Atlantic Central Waters
The highest DCo concentrations recorded along the section were observed in interme-diate waters of the equatorial area (150–750 m) within the ACW (Fig. 4a), those waters that were marked by the lowest concentrations of O2 (Fig. 2c). Hence we estimated the portion of DCo resulting from remineralization in the ACW by using the Apparent
20
Oxygen Utilization (AOU). The AOU represents the integrated oxygen consumption by heterotrophic bacteria in the breakdown of organic matter and it is computed as the difference between the oxygen saturation concentration, which depends on thermoha-line properties (Weiss, 1970), and the observed oxygen concentration. The significant correlation between AOU and DCo recorded in these waters (Fig. 8) strongly suggests
25
BGD
10, 15951–16001, 2013
Physical and remineralization processes govern the
cobalt distribution
G. Dulaquais et al.
Title Page
Abstract Introduction
Conclusions References
Tables Figures
◭ ◮
◭ ◮
Back Close
Full Screen / Esc
Printer-friendly Version
Interactive Discussion
Discussion
P
a
per
|
D
iscussion
P
a
per
|
Discussion
P
a
per
|
Discuss
ion
P
a
per
|
(Saito et al., 2004; Noble et al., 2008, 2012). This relationship is used to estimate the concentration of DCo due to the remineralization in the ACW ([DCo]remineralization; Eq. 1), and its proportion compared to the recorded concentration of DCo (%DCoremineralized; Eq. 2), according to:
[DCo]remineralization=(RCo:P×RP:O2×AOU) (1)
5
%DCoremineralized=100·[DCo]remineralization/[DCo]observed (2) where RCo:P is the stoichiometric Co : P ratio recorded in the surface waters of the equatorial area (with an average value of 27×10−6M M−1; Dulaquais et al., 2013),
andRP : O2 is the stoichiometric ratio between phosphate production and oxygen
con-10
sumption (e.g. RP : O
2=1/170 M M
−1
; Matear and Hirst, 2003; Oschlies et al., 2008; Krishna-Murty et al., 2009).
Hence the concentration of DCo due to remineralization ([DCo]remineralization) is esti-mated at about 19±2.5 pM in the ACW using Eq. (1), whereas the mean DCo
concen-tration recorded between 150 and 250 m ([DCo]observed) is 66.6±9 pM in the Equatorial 15
area. It means that 29 % of the dissolved cobalt present in the ACW of the West Atlantic Ocean resulted from remineralization. If this remineralized DCo was only provided by transportation from the Eastern Basin, this proportion should be greater in the Eastern central Atlantic Ocean where dilution with NADW does not affect this water-mass yet. But we estimate a similar proportion in the East Atlantic (%DCoremineralized=28.5±4 %)
20
by using the DCo dataset of Noble et al. (2012). This result suggests that the DCo pro-vided by remineralization in the West Equatorial Atlantic is likely a combination of a westward transportation of the DCo remineralized in the Eastern Atlantic basin, the cumulative remineralization along the transportation of ACW in these O2depleted wa-ters and the mixing between NADW and ACW across the Equatorial Atlantic and in the
25
BGD
10, 15951–16001, 2013
Physical and remineralization processes govern the
cobalt distribution
G. Dulaquais et al.
Title Page
Abstract Introduction
Conclusions References
Tables Figures
◭ ◮
◭ ◮
Back Close
Full Screen / Esc
Printer-friendly Version
Interactive Discussion
Discussion
P
a
per
|
D
iscussion
P
a
per
|
Discussion
P
a
per
|
Discuss
ion
P
a
per
|
4.3.2 Decoupling of the relationship between cobalt and phosphate
Few studies have shown that the biological utilization of DCo can be proportional to that of phosphate (P) in the surface waters of oligotrophic provinces (Saito et al., 2004, 2010; Jakuba et al., 2008). In intermediate and deep waters, the apparent lower rem-ineralization of DCo compared to P observed in mesopelagic waters may indicate a
5
decoupling between the cobalt and the phosphate cycles at those depths (Bown et al., 2011). Here we further investigate such decoupling in the Equatorial area by estimat-ing, in addition of %DCoremineralized (Eq. 2), the proportion of P due to remineralization (%Premineralized), according to:
%Premineralized=100·(RP:O2×AOU)/[P]observed (3)
10
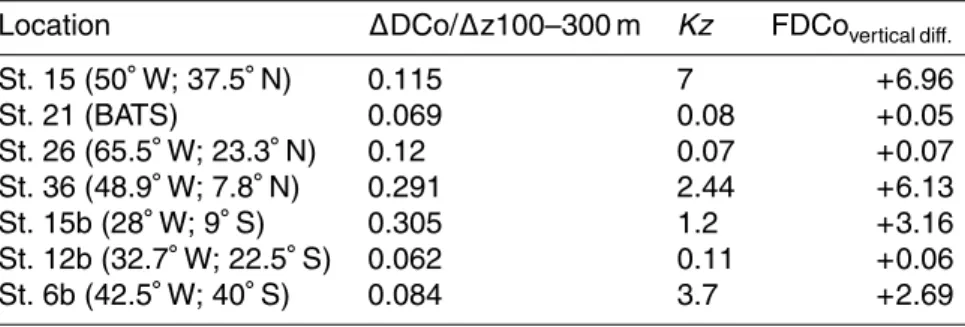
In the Equatorial area, the proportion of remineralized P increases significantly with depth (by a factor 7) from the upper waters (10–150 m; %Premineralized=6.9±1 %) to the oxygen minimum layers (150–250 m; %Premineralized=52±6 %), whereas the
pro-portion of remineralized DCo only increases slightly (e.g. %DCoremineralized=22±5 %
in surface, and 29±6 % deeper) (Table 3). Deeper (> 400 m), the proportion of rem-15
ineralized P and DCo are similar (40±2 % and 37±3 %, respectively). These results
further support a decoupling between the remineralization of P and DCo, and suggest that it occurs in the depths of the oxygen minimum. Consequently, the increase with depth of the Co : P ratio reported in particulate material (Table 3; Sherrell and Boyle, 1992) probably results from a preferential remineralization of P compared to Co, rather
20
than from the scavenging of Co on settling particles. The vertical distribution of PCo in this area that does not show an increase with depth (Table 3), further supports this hypothesis. Furthermore DCo is known to be strongly bound to organic ligands in the ocean (Saito and Moffett, 2001; Noble et al., 2012; Bown et al., 2012b), preventing its adsorption to settling particles.


![Fig. 6. Intercomparison of DCo datasets at the cross-over station BATS (a, d) between this study (blue diamonds) and ICP-MS method by Biller and Bruland [2008] (green triangles) and by Middag,Bruland et al](https://thumb-eu.123doks.com/thumbv2/123dok_br/17153574.240247/49.918.105.588.65.439/intercomparison-datasets-station-diamonds-bruland-triangles-middag-bruland.webp)
