NUMERICAL STUDY ON AERODYNAMIC HEAT
OF HYPERSONIC FLIGHT
by
Haiming HUANG a, Jing XU a, Weihua XIE a,b*, and Xiaoliang XU c a In sti tute of En gi neer ing Me chan ics, Beijing Jiaotong Uni ver sity, Beijing, China b Cen ter of Com pos ite Ma te ri als, Harbin In sti tute of Tech nol ogy, Harbin, China c Beijing In sti tute of Near Space Ve hi cle's Sys tem En gi neer ing, Beijing, China
Orig i nal sci en tific pa per DOI: 10.2298/TSCI1603939H
Ac cu rate pre dic tion of the shock wave has a sig nif i cant ef fect on the de vel op ment of space trans por ta tion ve hi cle or ex plo ra tion mis sions. Tak ing Lobb sphere as the ex am ple, the aero dy namic heat of hy per sonic flight in dif fer ent Mach num bers is sim u lated by the fi nite vol ume method. Chem i cal re ac tions and non-equi lib rium heat are taken into ac count in this pa per, where con vec tive flux of the space term adopts the Roe for mat, and discretization of the time term is achieved by back ward Eu ler al go rithm. The nu mer i cal re sults re veal that thick mesh can lead to ac cu rate pre dic tion, and the thick ness of the shock wave de creases as grid num ber in creases. Fur ther more, most of ki netic en ergy con verts into in ter nal en ergy cross ing the shock wave.
Key words: shock wave, aerodynamic heat, finite volume method, Lobb sphere
In tro duc tion
A very strong shock wave trans forms ki netic en ergy into in ter nal en ergy when the ve hi cle fly ing with high ve loc ity through the at mo sphere. The per for mance of the ther mal pro tec tion sys tem is crit i cal for aero space ve hi cles sub jected to aero dy namic heat [1, 2]. The aero dy -namic heat loads can be well known from ex per i men tal fa cil i ties such as wind tun nel and flight ex per i ments, but wind tun nel ex per i ment only sim u lates part of flight, and flight ex per i ments are too costly to al low their wide spread use. Ac cu rate pre dic tion of the aero dy namic heat is badly in need of the de vel op ment of new ve hi cle, so the aero dy namic heat of a ve hi cle dur ing re -en try is an op-en is sue of grow ing in ter est [3]. A great deal of re search has be-en per formed on this sub ject. For ex am ple, Tchuen et al. [4] com puted the non-equi lib rium ion ized air flow for a better pre dic tion of hy per sonic flows around re en try ve hi cles. Boyd et al. [5] in ves ti gated a mod i fied ap proach for de ter min ing the tem per a ture of air with the dis so ci a tion and ion iza tion re ac tions. How ever, few re cords have con sid ered the ef fect of grids on both the thick ness of the shock wave and the ve loc ity be hind the shock wave. In this study, we will con sider thermo-chem i cal non-equi lib rium phe nom ena of a high tem per a ture gas in or der to ex plore the prob lem in the aero dy namic heat of hy per sonic flight by us ing the fi nite vol ume method.
Math e mat i cal model
It is well known that the vi bra tion and elec tron tem per a tures play an im por tant role in a high tem per a ture gas, be cause they im prove the eval u a tion of the phys i cal prop er ties of nonequi lib rium hy per sonic flow. The model of the hy per sonic flow with ther mal nonequi lib rium is built on the ba sis of aerothermodynamics. The mass con ser va tion equa tion, the mo men -tum con ser va tion equa tion and the en ergy con ser va tion equa tion of high tem per a ture gas flow are re spec tively de scribed:
¶ ¶ ¶ ¶ ¶ ¶ r r w s j s j s j j s
t x u
J
x
+ ( )= - , + (1)
¶ ¶ ¶ ¶ ¶ 
t(rs tu ) xj (rs iu uj) xj [ Pdij tij]
+ = - + (2)
¶ ¶ ¶ ¶ ¶ ¶ ¶ ¶ ¶ ¶ E
t x E P u
q
x x u x h
t j t j j j i j ij j s s + + = + -=
[( ) ] ( t ) (
1
ns s j J
å , ) (3)
r= års (4)
where r, u, P, d, and t are the den sity, ve loc ity, pres sure, Kronecker delta func tion, and shear stress of fluid, re spec tively. The J is the mass diffusivity flux, w – the source term as so ci ated with the re ac tion, E – the en ergy per vol ume, h – the sen si ble enthalpy per mass, and q – the heat flux. Sub script s is the spe cies, t is to tal, i and j are, re spec tively, i- and j-di rec tions:
q T
x j
j
= -ktr ¶ (5)
where k is the ther mal con duc tiv ity, T – the tem per a ture, and sub script tr– the translationalro ta -tional.
The con ser va tion equa tion for the mo lec u lar in ter nal en ergy is given: ¶ ¶ ¶ ¶ ¶ ¶ E
t xj E uj xj s e sJs j q j
int
int int, , int, in
( ) ( )
+ = å - +w t (6)
q T
x j
j
int, =kint
vib (7)
where e is the mo lec u lar en ergy per mass, sub script int – the in ter nal, and vib – the vi bra tional. For ther mal non-equi lib rium, eint,s is de fined:
e M g e s s
s m s m T m nd s m int, , , / ( , ) = -=
å
R vib q q 1 1 (8)where R is the uni ver sal gas con stant, M – the mo lec u lar weight, g – the de gen er ate state, and q – the char ac ter is tic vi bra tional tem per a ture.
The state equa tion for gases is given by:
P T
M s
s s
=
å
r R (9)For ther mal non-equi lib rium:
E c T h T c
M
t s
s v t s f T s v s s
= å + - æ
-è çç ö ø ÷÷ é ë ê r , ,
, , , ,
r r r tr
R
D 0 ù
û
ú +Eint +1 u uj j
where c is the heat ca pac ity, h f T s,r,
0 – the heat of for ma tion at ref er ence tem per a ture, T
r, and pres
-sure for spe cies, s. Sub script v is con stant vol ume:
hs cp s T h
f T s T
T
= ò +
, ,tr d , r,
r
D 0 (11)
c
M
v s
s
, ,tr , , ,
R =e e=
2 3 5 6 (12)
c
M
p s
s
, ,tr
R
= (13)
where e is the mo lec u lar de gree of free dom, which has pos si ble val ues of 3, 5 or 6 for a monatomic spe cies, a di atomic or lin ear polyatomic spe cies, and a nonlin ear polyatomic spe -cies. Sub script p is a con stant pres sure.
In ad di tion, the chem i cal ki netic mod els for air with sev en teen el e men tary re ac tions is O2 + M = O + O + M, N2 + M = N + N + M, NO + M = N + O + M, O + N2 = NO + N, and NO + O = = O2 + N, where the cat a lytic spe cies M stands for any of the five spe cies.
Re sults
Roe dis crete for mat is adopted in the discretization of the con vec tion term in this model. Tak ing Lobb sphere as an ex am ple, the aero dy namic heat of hy per sonic flight in dif fer -ent Mach num bers (Ma) is sim u lated by the fi nite vol ume method. The Lobb sphere ex per i m-ent is clas sic in aero dy namic heat field as it
pro vides many val ues to com pare with. The ex per i men tal model is a sphere with ra dius 6.35 mm. The sur face of the Lobb sphere is sup posed the no-slip wall and the wall tem per a ture, Tw, is as sumed to be a con stant. The 5-spe cies-17-re ac -tions chem i cal re ac -tions come from
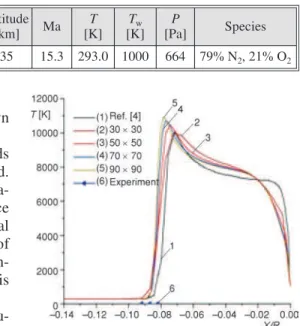
Park' 85 model [6]. All flow vari ables are shown in tab. 1.
To com pare the ac cu racy, sev eral grids (30.×.30, 50.×.50, 70.×.70, 90.×.90) are uti lized. From fig. 1, the tem per a ture dis tri bu tion is a ba -sic sim i lar ity, and the shock de tach ment dis tance is al most the same. They match com pu ta tional and ex per i men tal data in [4], but the thick ness of the shock wave de creases as the grid num ber in -creases. These re sults sug gest that grids 90×90 is more ac cu rate.
Fig ure 2 shows that the tem per a ture dis tri bu -tions along the stag na tion line are in a good agree ment with the data in [4]. The de vi a tions near the wall may be caused by dif fer ent re ac tion
Figure 1. Temperature distributions along the stagnation line
Ta ble 1. Free stream con di tion
Al ti tude
[km] Ma
T [K]
Tw [K]
P
[Pa] Spe cies
mod els. The vi bra tional tem per a ture of the flow field is above 6000 K, so most of O2 has dis so ci -ated but not the N2.
Spe cies mass frac tions dis tri bu tions along the stag na tion line are shown in fig. 3. Lines with solid sym bols rep re sent re sults of this study, and the oth ers rep re sent the re sults from [4]. As the vi bra tion tem per a ture is not high, N2 does not dis so ci ate much. Dis so ci a tion de gree picks up near the wall be cause the wall tem per a -ture is lower than the flow field be hind the shock wave. Most of O2 have dis so ci ated near the wall. Mass frac tion of NO peaks af ter the shock wave but turns to 0 near the wall.
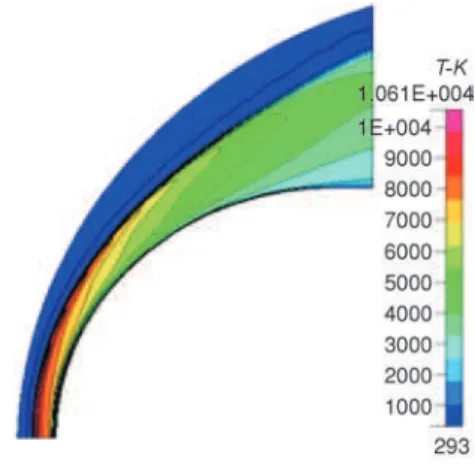
Tem per a ture dis tri bu tion in the flow field is il lus trated in fig. 4. The peak of tem per a ture is just af ter the shock wave and then the tem per a -ture grad u ally de creases.
In ad di tion, sim u la tions un der sev eral Mach num bers (Ma = 5, 6, 7, 8, 9, 10, 15, and 20) are per formed in 50 ´ 50 grids. Fig ure 5 shows flow ve loc ity dis tri bu tions along the stag na tion line un der dif fer ent Mach num bers. The shock de -tach ment dis tance de creases as Mach num ber in creases. Fig ure 6 shows the re la tion be tween the ve loc i ties just af ter shock wave and Mach num bers. The ve loc ity in creases as Mach num -ber in creases, but not as much as the in cre ment Figure 2. Two-temperature distributions along
the stagnation line
Figure 3. Species mass fractions distributions
along the stagnation line Figure 4. Temperature distribution in the
flow field (for color image see journal web site)
of flow ve loc ity. These data sug gest that most of ki netic en ergy con verts into in ter nal en ergy cross ing the shock wave.
Con clu sions
From the nu mer i cal re sults, it can be con -cluded:
· The thickness of the shock decreases as the grid number increases. The more the grid number is, the smaller the thickness of the shock wave becomes.
· The shock detachment distance decreases as Mach number increases. However, the velocity just after the shock wave does not increases as much as the increment of flow velocity, which implies that most of kinetic
energy converts into internal energy crossing the shock wave. Ac knowl edg ment
This work is sup ported by the Na tional Nat u ral Sci ence Foun da tion of China (Nos. 11472037 and 11272042 ) and the Pro ject of Ed u ca tion Min is try of China (No.62501036026).
Ref er ences
[1] Li, W. J., et al, Non lin ear Anal y sis on Ther mal Be hav ior of Char ring Ma te ri als with Sur face Ab la tion, In -ter na tional Jour nal of Heat and Mass Trans fer, 84 (2015), May, pp. 245-252
[2] Li, W. J., et al., A Non lin ear Py rol y sis Layer Model for An a lyz ing Ther mal Be hav ior of Char ring Ablator, In ter na tional Jour nal of Ther mal Sci ence, 98 (2015), Dec., pp. 104-112
[3] Li, W. J., et al., Thermochemical Ab la tion of Car bon/Car bon Com pos ites with Non lin ear Ther mal Con
-duc tiv ity, Ther mal Sci ence, 18 (2014), 5, pp. 1625-1629
[4] Tchuen, G., et al., Nu mer i cal Study of NonEqui lib rium Weakly Ion ized Air Flow Past Blunt Bod ies, In
-ter na tional Jour nal of Nu mer i cal Meth ods for Heat & Fluid Flow, 15 (2005), 6, pp. 588-610
Figure 6. Velocities just after shock wave with Ma = 5, 6, 7, 8, 9, 10, 15, 20
No men cla ture
c – heat capacity, [Jkg–1K–1]
E – energy per volume, [Jkg–1]
e – molecular energy per mass, [Jkg–1]
g – degenerate state, [–]
h – enthalpy per mass, [Jmol–1]
J – mass diffusivity flux, [m2s–1]
M – molecular weight, [kg]
P – pressure, [Pa]
q – heat flux, [Wm–2]
R – universal gas constant
T – temperature, [K]
u – velocity, [ms–1]
Greek sym bols
d – Kronecker delta function, [–]
e – molecular degree of freedom, [–]
q – characteristic vibrational temperature, [K]
k – thermal conductivity, [Wm–1K–1]
r – density, [kgm–3]
t – shear stress, [Pa]
w – source term, [kgs–1]
Subcripts
i – i-direction
int – inrernal
j – j-direction
p – constant pressure
r – reference
s – species
Tr – reference temperature
t – total
tr – translational-rotational
v – constant volume
[5] Boyd, I. D., et al., Mod el ing of Stardust En try at High Al ti tude, Part 1: Flowfield Anal y sis, Jour nal of Space craft and Rock ets, 47 (2010), 5, pp. 708-717
[6] Park, C. A., Re view of Re ac tion Rates in High Tem per a ture Air, Pro ceed ings, 24th AIAA Thermophysics
Con fer ence, N. Y. USA, 1989