MRI FINDINGS IN THE DIAGNOSIS AND
MONITORING OF RASMUSSEN’S ENCEPHALITIS
Andréia V. Faria
1, Fabiano Reis
1, Guilherme C. Dabus
1, Verônica A. Zanardi
1,
Marilisa M. Guerreiro
2, Fernando Cendes
2.
Abstract – Rasmussen’s encephalitis is a devastating syndrome of multifocal brain dysfunction and focal seizures. Magnetic resonance (MR) findings, associated with clinical data and electroencephalogram (EEG), may indicate the diagnosis and could be an indicative of prognosis. We studied 5 patients with Rasmussen’s encephalitis, assessing clinical history and MR images. All patients had refractory focal seizures with a predominant motor component associated with hemispheric atrophy, that was proportional to severity of disease and neurological deficits in these patients. Gray and white matter abnormal signal on T2 MR images were found in patients who had hemiparesis. It was not related to the duration of the disease but to aggressiveness. MR proton spectroscopy in severe disease showed lactate and choline increase and decreased NAA, reflecting neuronal and axonal loss, gliosis and elevated membrane turnover and recent - crisis (not controlled). MR studies, in addition to help in diagnosis, may be useful for monitoring metabolic changes and progression of disease in Rasmussen’s encephalitis.
KEy WoRds: Rasmussen’s encephalitis, MRI, spectroscopy, epilepsy.
Achados de RM no diagnóstico e monitorização da encefalite de Rasmussen
Resumo – A encefalite de Rasmussen é uma devastadora síndrome com disfunção cerebral multifocal e convulsões focais. Achados de ressonância magnética (RM), associados aos dados clínicos e de eletrencefalograma (EEG), podem indicar o diagnóstico e podem ser indicativos de prognóstico. Foram estudados 5 pacientes com encefalite de Rasmussen, avaliando a história clínica e imagens de RM. Todos os pacientes apresentavam crises epilépticas focais refratárias com componente predominantemente motor associadas à atrofia hemisférica, que foi proporcional à gravidade da doença e déficits neurológicos nestes pacientes. Alteração da intensidade de sinal nas substâncias branca e cinzenta, nas sequências ponderadas em T2, foram encontradas nos pacientes com hemiparesia. Ela não estava relacionada com a duração da doença, mas à severidade. A espectroscopia de prótons por RM na doença severa demonstrou aumento dos níveis de colina e lactato e diminuição de N-acetilaspartato, refletindo perda neuronal e axonal, gliose e aumento de turnover de membrana e crise recente (não controlada). Estudos de RM, além de ajudar no diagnóstico, podem ser úteis para acompanhar alterações metabólicas e progressão da doença na encefalite de Rasmussen. PAlAvRAs-chAvE: encefalite de Rasmussen, RM, espectroscopia, epilepsia.
Faculty of Medical sciences, state University of campinas (UNIcAMP), campinas sP, Brazil: 1department of Radiology; 2department of Neurology. Received 5 February 2009, received in inal form 30 June 2009. Accepted 10 July 2009.
Dr. Fabiano Reis – Rua Conceição 286 / 26 - 13010-050 Campinas SP - Brasil. E-mail: [email protected]
The syndrome of chronic encephalitis and intractable focal epilepsy was irst reported by Rasmussen in 1958 and consists in severe epilepsy associated with slow progres-sive neurologic deterioration and progresprogres-sive lateralized brain destruction1. Previous studies indicated that
anti-GluR3 autoantibodies might be involved in pathogenesis of the disease2. however, other investigators did not ind
these autoantibodies3. More recently, other mechanisms
as a cytotoxic T-cell reaction against neurons were
dem-onstrated to play a causative role in Rasmussen encepha-litis (RE)4. despite the fact that an etiologically signiicant
viral antigen has not yet been found; the early immuno-suppressive and antiviral treatment may be effective for a period of time5.
Although in rare situations RE may present without epilepsy6, seizures mark the clinical features and their
surgical specimens and biopsy show typical encephalitis with widespread perivascular cuffs and round cells, glio-sis and scattered microglial nodules. however, the mor-phologic picture of active chronic encephalitis is nonspe-ciic. Resected specimens in the more advanced clinical stages have demonstrated diffuse cortical atrophy with neuronal loss and a lack of inlammatory cells7. Magnetic
resonance imaging (MRI) in combination with clinical data and slow focal activity on EEG, contralateral to the mo-tor manifestations may indicate the diagnosis8,9 and hasten
brain biopsy. The progression of lesions on MRI seems to relect the course of this disease and prognosis, although the extent of the lesions not necessarily correlates with the frequency of seizures10.
Thus, the purpose of this study was to determine if MRI may indicate prognosis in patients with RE.
METHOD
local research ethics committees granted ethical approv-al for the study.
Magnetic resonance exams were performed in ive patients with clinical and neuroimaging evidences of RE. In three of them the diagnosis of RE was conirmed by pathological examination of the surgical specimen. In the other two, clinical and imag-ing of two year follow-up conirmed the diagnosis. MRIs were
performed in a 2T scanner (Elscint Prestige®, haifa, Israel), with T1 and T2 acquisitions in three orthogonal planes, including T1-weighted sE gadolinium enhanced images. MRI acquisition pa-rameters were: sagital T1 spin echo, 6 mm thick, lip angle=180o; repetition time (TR)=430 ms, echo time (TE)=12 ms, matrix 200 ×350, field of view (Fov)=25 ×25cm, T2-weighted and pro-ton density “fast spin echo” (FsE), 3 mm thick, lip angle=160o; TR=4800 ms, TE=108/18 ms, matrix 256 ×256, Fov=22 ×22 cm; T1-weighted spin echo (sE); TR=540 ms, TE=28 ms; T1-weighted inversion recovery (IR), 3 mm thick, lip angle=200o TR=2700 ms, inversion time (TI)=860 ms, TE=14 ms, matrix 130 ×256, ield of view (Fov)=16 ×18 cm, and T2-weighted luid-attenuated inver-sion recovery (FlAIR) images TR=8500 and 2000 ms or 100 and 2200 ms, TE=72 or 90 ms, matrix of 256 × 296 and Fov of 22 × 22 cm. The analysis of exams, including establishment of atro-phy grade, were performed by visual parameters, by three dif-ferent observers.
single voxel hydrogen magnetic resonance spectroscopy (1 h-MRs) was acquired in four of the patients, using PREss sequence (TR/TE =1500/135 ms, number of excitation ((NEX)=200) with two regions of interest (RoIs) of 8 cm3, one in each parietal deep white matter. Prior to the acquisition, a localized shimming at the RoI was performed, followed by water suppression adjust-ment. localized shimming was repeated to ensure good ield homogeneity and until the 1h signal from water within the RoI
Table. Patient’s data.
Patient no sex Age (years) Affected hemisphere Antecedents Age of onset irst symptoms (years) seizures in evolution Neurological outcome hyper signal at T2 MRI hemispheric and caudate atrophy surgery 1 M 17 R Meningitis, immediately before
the onset seizures
6 GTc
EPc (left superior
limb, motor)
hemiparesis yes yes yes
2 F 15
R
Not important 10
GTc
EPc (left limbs, motor)
+GTc
left foot paresis and coordination deicits
No yes No
3 F 16 l Mother’s cousin with epilepsy
9 GTc and sPMs
EPc (right limbs, motor)
+GTc
Facial and oral automatisms and right coordination
deicits
No yes No
4 F 7 R
varicella, 2 months before the
onset seizures
2 sPMs
sPMs (left superior limb)
hemiparesis yes yes yes
5 M 6 l Twin brother with myoclonus 5 GTc sPMs (right limbs) +GTc
hemiparesis yes yes yes
became as narrow as possible. The spectra were post-processed using software supplied by the machine manufacturer (Elscint Prestige 2T, haifa, Israel).
RESULTS
Table summarizes clinical, EEG and image indings. The age at onset ranged from 2 to 10 years (mean 6.4 years). In the six months before the irst symptom, two patients had infections (measles and meningitis). Tonic-clonic general-ized seizures marked disease onset in 4 patients and par-tial seizures in one patient. seizure frequency varied, how-ever all ive patients presented epilepsia partialis continua (EPc) at some point of the disease. convulsive status ep-ilepticus occurred in two patients. Three patients devel-oped hemiparesis. In two patients, who develdevel-oped symp-toms at oldest age, the neurological examination remains normal despite slow progression of the hemispheric atro-phy. Although cognitive decline is dificult to assess
be-cause polypharmacy and frequent seizures, four patients showed some degree of cognitive impairment.
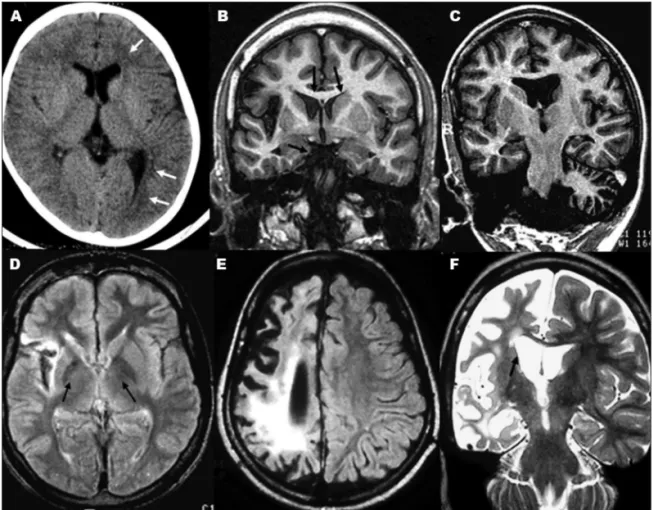
Figure 1 summarizes image indings. All patients had cortical atrophy associated with ipsilateral ventricular en-largement and caudate atrophy, more severe in those with hemiparesis. The most affected areas were insular, tempo-ral and parietal regions. Gray and white matter focal signal intensity abnormalities (hyperintense signal in long TR-weighted images) were found in the three patients with hemiparesis.
1h-MRs performed in one patient (1) showed increased
lactate and choline and decreased NAA in atrophic re-gions (Fig 2). In another patient (3), 1h-MRs did not show
differences between hemispheres (Fig 3).
Antiepileptic drugs were only partially effective for seizure control. Plasma exchange was performed in two patients with transient improvement. Three patients with hemiparesis underwent hemispherectomy.
DISCUSSION
Progressive cerebral hemiatrophy associated with clin-ical deterioration and focal EEG features, was the key to the diagnosis of RE, avoiding brain biopsy in all our
pa-tients. The age of onset, the irst seizure (generalized ton-ic-clonic seizure) and a preceding inlammatory or infec-tious event (that occurred in 2 of 5 of patients), are in agreement with previous studies11.
Fig 2. MRS, performed at white matter of frontal regions in patient 1. Note the decreased NAA, in-creased choline (Cho) and lactate (lac) peak in the atrophic hemisphere (right) compared with the normal one. Cre: creatine.
As occur in RE, seizures were focal, involving exclusive-ly one hemibody, and refractory to antiepileptic drugs. In the initial phase the diagnosis of chronic encephalitis may be dificult, particularly in the absence of EPc. There is a progressive increase in seizure frequency and severi-ty and patients develop permanent neurological deicits contralateral to the affected cerebral hemisphere. The ini-tial MRI scans shows that the inlammatory lesion (hyper-intense T2/FlAIR signal) had a monofocal onset12,13. The
next phase of disease is marked by neurological deteri-oration and may persist for more than 10 years. In the last phase, characterized by hemiparesis, seizures are not so frequent but motor and mental deterioration contin-ues5 sometimes in spite of surgery14,15. MRI typically shows
hemiatrophy with enlargement of ipsilateral ventricles and subarachnoid spaces16-18.
cortical atrophy occurred in all our patients, probably secondary to the long course of disease. It was visual pro-portional to the severity of symptoms, most likely relect-ing the severity of disease. however, even patients with-out hemiparesis presented diffuse hemispheric atrophy. We suppose that this can be an example of brain function-al plasticity in chronic insults, frequently observed in RE, pre- and post- operatively19,20. It is possible that
reorgani-zation of somatosensory cortex helps to maintain func-tions, in spite of the anatomical damage. caudate atro-phy occurred in all our patients, although this has been rarely reported21-23.
Patients with hemiparesis and more frequent seizures presented also gray and focal white matter hyperintensi-ty in T2-weighted images. Bien et al. demonstrated that this signal change is correlated with the number of T cells in brain parenchyma and reactive gliosis, indicating ongo-ing damage4,24. In our study, patients with hyperintense T2
lesions and hemiparesis had the most devastating forms of RE.
1h MRs contributes to evaluation and progression of
metabolic changes in RE9,25-27. Although the patterns of
me-tabolites observed are nonspeciic. compared with nor-mal hemisphere, the atrophic regions showed increased lactate, a consequence of repetitive focal epileptic neu-ronal activity28,29, as well as increased choline (related to
gliosis, microglial proliferation and elevated membrane turnover30) and reduced NAA. As NAA plays a role as
neu-ron-glia signaling system31, this reduction relects neuronal
loss and axonal dysfunction/depletion32 and possibly also
changes in neurotransmitter system, altered in RE33. This
reduction in NAA suggests ongoing neuronal and axonal damage and loss in RE. Patients 1 and 4, with more severe disease and atrophy, showed these abnormalities (Fig 2, related to patient 1). Particularly, the lactate increase was related with recent crisis (not controlled) and not to the disease itself.
In the two patients (patients 2 and 3, Table) whose 1h
MRs did not showed differences between hemispheres (patient 3, Fig 3), the MRI did not show abnormal signal but only atrophy, the age of onset was more advanced and the crisis were controlled with drugs, without surgery, show-ing a positive correlation between metabolic and struc-tural changes and severity of disease.
Parenchyma atrophy was a common inding of RE in our group and even patients without hemiparesis had some degree of hemispheric atrophy. our hypothesis is this disconnection is related with the plasticity of child’s brain, but a greater number of cases and application of functional techniques, as fMRI, are needed to conirm it. In spite of the few number of patients, we noticed a ten-dency of patients with more severe disease to present sig-nal changes on MRI and abnormal MRs. This inding may thus favor the possible existence of biochemical changes underlying structural damage, not necessarily visible on conventional MRI. These data are preliminary and these theses will be veriied expanding the group and the fol-low-up timing.
REFERENCES
1. Rasmussen T, Olszewski J, Lloyd-Smith D. Focal seizures due to chron-ic localized encephalitis. Neurology 1958;8:435-445.
2. Rogers SW, Andrews PI, Gahring LC, et al. Autoantibodies to gluta-mate receptor GluR3 in Rasmussen’s encephalitis. Science 1994;265: 648-651.
3. Krauss GL, Campbell ML, Roche KW, Huganir RL, Niedermeyer E. Chronic steroid-responsive encephalitis without autoantibodies to glu-tamate receptor GluR3. Neurology 1996;46:247-249.
4. Bien CG, Bauer J, Deckwerth TL, et al. Destruction of neurons by cito-toxic T cells: a new pathogenic mechanism in Rasmussen’s encephalitis. Ann Neurol 2002;51:311-318.
5. Granata T, Gobbi G, Spreaico R, et al. Rasmussen’s encephalitis: early
characteristics allow diagnosis. Neurology 2003;60:422-425.
6. Korn-Lubetzki I, Bien CG, Bauer J, et al. Rasmussen encephalitis with
active inlammation and delayed seizures onset. Neurology 2004;62:
984-986.
7. Rasmussen T, Andermann F. Update on the syndrome of “chronic en-cephalitis” and epilepsy. Cleve Clin J Med 1989;56:181-184.
8. Chiapparini L, Granata T, Farina L, et al. Diagnostic imaging in 13 cas-es of Rasmussen’s encephalitis: can early MRI suggcas-est the diagnosis? Neuroradiology 2003;45:171-183.
9. Geller E, Faerber EN, Legido A, et al. Rasmussen encephalitis: com-plementary role of multitechnique neuroimaging. Am J Neuroradiol 1998;19:445-449.
10. Nakasu S, Isozumi T, Yamamoto A, Okada K, Takano T, Nakasu Y.
Se-rial magnetic resonance imaging indings of Rasmussen’s
encephalitis-case report. Neurol Med Chir 1997;37:924-928.
11. Mattheus PM, Andermann F, Arnold DL. Proton magnetic resonance spectroscopy study of chronic encephalitis and epilepsy. In: Andermann F (Ed). Chronic encephalitis and epilepsy: Rasmussen’s syndrome. Bos-ton: Butterworth-Heinemann, 1991:73-77.
12. Bien CG, Widman G, Urbach H, et al. The natural history of Rasmus-sen’s encephalitis. Brain 2002;125:1751-1759.
13. Maeda Y, Oguni H, Saitou Y, et al. Rasmussen syndrome: multifocal
spread of inlammation suggested from MRI and PET indings. Epi
-lepsia 2003;44:1118-1121.
15. Thomas P, Zifkin B, Ghetâu G, Delalande O. Persistence of ictal activity after functional hemispherectomy in Rasmussen syndrome. Neurology 2003;60:140-142.
16. Lutkenhoner B, Menninghaus E, Steinstrater O, Gissler HM, Elbert T. Neuromagnetic source analysis using magnetic resonance images for the construction of source and volume conductor model. Brain Topogr 1995;7:291-299.
17. Takeoka M, Kim F, Caviness VS Jr, Kennedy DN, Makris N, Holmes GL. MRI volumetric analysis in Rasmussen encephalitis: a longitudinal stydy. Epilepsia 2003;44:247-251.
18. Larionov S, König R, Urbach H, Sassen R, Elger CE, Bien CG. MRI brain volumetry in Rasmussen encephalitis: the fate of affected and “unaf-fected” hemispheres. Neurology2005;64:885-887.
19. Hertz-Pannier L, Chiron C, Jambaque I, et al. Late plasticity for lan-guage in a child’s non-dominant hemisphere: a pré- and post-surgery fMRI study. Brain 2002;125:361-372.
20. Ishibashi H, Simos PG, Wheless JW, et al. Multimodality function-al imaging in a patient with Rasmussen’s encephfunction-alitis. Brain Dev 2002;24:239-244.
21. Bhatjiwale MG, Polkey C, Cox TC, Dean A, Deasy N. Rasmussen’s
en-cephalitis: neuroimaging indings in 21 patients with a closer look at
the basal ganglia. Pediatr Neurosurg 1988;29:142-148.
22. Koehn MA, Zupanc ML. Unusual presentation and MRI indings in
Rasmussen’s syndrome. Pediatr Neurol 1999;21:839-842.
23. Fogarasi A, Hegyi M, Neuwirth M, et al. Comparative evaluation of concomitant structural and functional neuroimages in Rasmussen’s en-cephalitis. J Neuroimaging 2003;13:339-345.
24. Bien CG, Urbach H, Deckert M, et al. Diagnosis and staging of Rasmus-sen’s encephalitis by serial MRI and histopathology. Neurology 2002; 58:250-257.
25. Sener RN. Rasmussen’s encephalitis: proton MR spectroscopy and
dif-fusion MR indings. J Neuroradiol 2000;27:179-184.
26. Sener RN. Diffusion MRI and spectroscopy in Rasmussen’s encephali-tis. Eur Radiol 2003;13:2186-2191.
27. Wellard RM, Briellmann RS, Wilson JC, et al. Longitudinal study of MRS metabolites in Rasmussen encephalitis Brain 2004;127:1302-1312. 28. Cendes F, Andermann F, Silver K, Arnold DL. Imaging of axonal
dam-age in vivo in Rasmussen´s syndrome. Brain 1995;118:753-758. 29. Duprez TP, Grandin C, Gadisseux JF, et al. MR-monitored
remitting-re-lapsing pattern of cortical involvment in Rasmussen syndrome: com-parative evaluation of serial MR and PET/SPECT features. J Comput Assist Tomogr 1997;21:900-904.
30. Castillo M, Kwock L, Mukherji SK. Clinical aplications of proton MR spectroscopy. AJNR Am J Neuroradiol 1996;17:1-15.
31. Petroff OAC, Errante LD, Kim JH, Spencer DD. N-acetyl-aspartate, to-tal creatine, and myo-inositol in the epileptogenic human hippocam-pus. Neurology 2003;60:1646–1651.
32. Mathews PM, Andermann F, Arnold DL. A proton magnetic resonance spectroscopy study of focal epilepsy in humans. Neurology 1990;40: 985-989.