AMTD
8, 12105–12153, 2015Validation of CH4and
N2O profiles from
MIPAS-ENVISAT
J. Plieninger et al.
Title Page
Abstract Introduction
Conclusions References
Tables Figures
◭ ◮
◭ ◮
Back Close
Full Screen / Esc
Printer-friendly Version
Interactive Discussion
Discussion
P
a
per
|
Discussion
P
a
per
|
Discussion
P
a
per
|
Discussion
P
a
per
|
Atmos. Meas. Tech. Discuss., 8, 12105–12153, 2015 www.atmos-meas-tech-discuss.net/8/12105/2015/ doi:10.5194/amtd-8-12105-2015
© Author(s) 2015. CC Attribution 3.0 License.
This discussion paper is/has been under review for the journal Atmospheric Measurement Techniques (AMT). Please refer to the corresponding final paper in AMT if available.
Validation of revised methane and nitrous
oxide profiles from MIPAS-ENVISAT
J. Plieninger1, A. Laeng1, S. Lossow1, T. von Clarmann1, G. P. Stiller1, S. Kellmann1, A. Linden1, M. Kiefer1, K. A. Walker2, S. Noël3, M. Hervig4, M. McHugh5, A. Lambert6, J. Urban†,a, J. W. Elkins7, and D. Murtagh8
1
Karlsruhe Institute of Technology, Institute for Meteorology and Climate Research, Karlsruhe, Germany
2
University of Toronto, Canada
3
Institut für Umweltphysik, University of Bremen, Germany
4
GATS Inc, USA
5
Science and Technology Corporation, Hampton, VA, USA
6
Jet Propulsion Laboratory, California Institute of Technology, USA
7
NOAA Earth System Research Laboratory, Global Monitoring Division, Boulder, CO, USA
8
Department of Earth and Space Sciences, Chalmers University of Technology, Sweden
†
deceased
a
AMTD
8, 12105–12153, 2015Validation of CH4and
N2O profiles from
MIPAS-ENVISAT
J. Plieninger et al.
Title Page
Abstract Introduction
Conclusions References
Tables Figures
◭ ◮
◭ ◮
Back Close
Full Screen / Esc
Printer-friendly Version
Interactive Discussion
Discussion
P
a
per
|
Discussion
P
a
per
|
Discussion
P
a
per
|
Discussion
P
a
per
|
Received: 3 November 2015 – Accepted: 8 November 2015 – Published: 20 November 2015 Correspondence to: J. Plieninger ([email protected])
AMTD
8, 12105–12153, 2015Validation of CH4and
N2O profiles from
MIPAS-ENVISAT
J. Plieninger et al.
Title Page
Abstract Introduction
Conclusions References
Tables Figures
◭ ◮
◭ ◮
Back Close
Full Screen / Esc
Printer-friendly Version
Interactive Discussion
Discussion
P
a
per
|
Discussion
P
a
per
|
Discussion
P
a
per
|
Discussion
P
a
per
|
Abstract
Improved versions of CH4 and N2O profiles derived at the Institute of Meteorology
and Climate Research and Instituto de Astrofísica de Andalucía (CSIC) from spectra measured by the Michelson Interferometer for Passive Atmospheric Sounding (MIPAS) have become available. For the MIPAS full resolution period (2002–2004) these are 5
V5H_CH4_21 and V5H_N2O_21 and for the reduced resolution period (2005–2012) these are V5R_CH4_224, V5R_CH4_225, V5R_N2O_224 and V5R_N2O_225. Here, we compare CH4 profiles to those measured by the Fourier Transform Spectrometer
on board of the Atmospheric Chemistry Experiment (ACE-FTS), the HALogen Occul-tation Experiment (HALOE) and the Scanning Imaging Absorption Spectrometer for 10
Atmospheric CHartographY (SCIAMACHY) and to the Global Cooperative Air Sam-pling Network (GCASN) surface data. We find the MIPAS CH4profiles below 25 km to
be typically higher in the order of 0.1 ppmv for both measurement periods. N2O profiles are compared to those measured by ACE-FTS, the Microwave Limb Sounder on board of the Aura satellite (Aura-MLS) and the Sub-millimetre Radiometer on board of the 15
Odin satellite (Odin-SMR) as well as to the Halocarbons and other Atmospheric Trace Species Group (HATS) surface data. The mixing ratios from the satellite instruments agree well for the full resolution period. For the reduced resolution period, MIPAS pro-duces similar values as Odin-SMR, but higher values than ACE-FTS and HATS. Below 27 km, the MIPAS profiles show higher mixing ratios than Aura-MLS, and lower values 20
AMTD
8, 12105–12153, 2015Validation of CH4and
N2O profiles from
MIPAS-ENVISAT
J. Plieninger et al.
Title Page
Abstract Introduction
Conclusions References
Tables Figures
◭ ◮
◭ ◮
Back Close
Full Screen / Esc
Printer-friendly Version
Interactive Discussion
Discussion
P
a
per
|
Discussion
P
a
per
|
Discussion
P
a
per
|
Discussion
P
a
per
|
1 Introduction
The Michelson Interferometer for Passive Atmospheric Sounding (MIPAS; Fischer et al., 2008) measured limb emission spectra between 685 and 2410 cm−1. The
instru-ment was a Fourier transform spectrometer run by the European Space Agency (ESA) on the Environmental Satellite (ENVISAT). It covers two measurement periods: from 5
June 2002 to March 2004 it measured with a theoretical resolution of 0.025 cm−1
(af-ter a “Norton-Beer Strong” apodisation Norton and Beer, 1976 the spectral resolution is 0.0483 cm−1). This period is called full spectral resolution1 (FR). Between January 2005 and April 2012 it measured with a reduced spectral resolution (RR, theoretical resolution: 0.0625 cm−1, apodised resolution: 0.121 cm−1) but with a finer tangent
al-10
titude spacing. The tangent altitudes and their relative spacing depend on the mea-surement mode. Only spectra from the MIPAS nominal meamea-surement mode have been used for this work. The limb scans have 17 tangent altitudes between 6 and 68 km for the full resolution period and 27 spectra with tangent altitudes between 6 and 73 km in the reduced resolution period.
15
Retrievals of temperature and its horizontal gradient, vertical pointing of the line of sight and many trace gases are conducted with the research data processor devel-oped at the Institute of Meteorology and Climate Research in cooperation with In-stituto de Astrofísica de Andalucía (CSIC) (von Clarmann et al., 2003). Earlier ver-sions of the retrieval of CH4 and N2O with this processor for the full resolution
pe-20
riod were described by Glatthor et al. (2005), and for the reduced resolution pe-riod by von Clarmann et al. (2009). The retrieval setup of the latest data versions V5R_CH4_224, V5R_CH4_225, V5R_N2O_224, V5R_N2O_225, V5H_CH4_21 and V5H_N2O_21 can be found in Plieninger et al. (2015). Data versions V5R_CH4_224 and V5R_CH4_225 are practically equivalent, each covering a different time period.
25
The same holds for V5R_N2O_224 and V5R_N2O_225. The only technical difference
between each two of these versions is that ECMWF analyses from a different source
1
AMTD
8, 12105–12153, 2015Validation of CH4and
N2O profiles from
MIPAS-ENVISAT
J. Plieninger et al.
Title Page
Abstract Introduction
Conclusions References
Tables Figures
◭ ◮
◭ ◮
Back Close
Full Screen / Esc
Printer-friendly Version
Interactive Discussion
Discussion
P
a
per
|
Discussion
P
a
per
|
Discussion
P
a
per
|
Discussion
P
a
per
|
were used as a priori temperature profiles for the preceding retrieval of the temperature profiles which in turn were used for the retrieval of CH4and N2O. This has no
notice-able effect on the data products of CH4and N2O. The only purpose of different version
numbers is to guarantee full traceability and repeatability of the retrieval.
The new retrieval setup versions rely on the usage of an updated spectroscopic 5
dataset, an improved handling of continuum contributions to the spectra, some smaller changes in the constraint, revised selections of microwindows and the additional jointly fitting of HNO3 and H2O. The profiles are retrieved on a fixed altitude grid between 0
and 120 km. The grid spacing between 4 and 70 km is 1 km, outside that range it is coarser. For the comparisons, only profile points have been used, where the diagonal 10
element of the averaging kernel is above 0.03 and the visibility flag is 1. The latter is a value which indicates for one profile point, whether the retrieval actually used mea-sured data which was emitted in the altitude of this profile point. The resolution of the data products in the stratosphere ranges from 2.5 to 7 km, (for details see Plieninger et al., 2015). The error profiles of the retrieved mixing ratios of CH4and N2O resulting
15
from instrument noise are reported for each measurement.
In this work we compare the new data versions V5R_CH4_224, V5R_CH4_225, V5R_N2O_224, V5R_N2O_225, V5H_CH4_21 and V5H_N2O_21 to various satellite instruments and additionally to surface data. These comparison instruments are de-scribed in Sect. 2. The documentation of the comparison method is given in Sect. 20
3, while Sect. 4 contains the validation itself. In Sect. 5 an attempt is made to gain some knowledge about how good the data products from the two different MIPAS
mea-surement periods agree by using the comparisons to other instruments. Sect. 6 gives a summary of our results. Since the bulk of the MIPAS data is from the reduced reso-lution period, we chose to discuss these profiles before those measured during the full 25
AMTD
8, 12105–12153, 2015Validation of CH4and
N2O profiles from
MIPAS-ENVISAT
J. Plieninger et al.
Title Page
Abstract Introduction
Conclusions References
Tables Figures
◭ ◮
◭ ◮
Back Close
Full Screen / Esc
Printer-friendly Version
Interactive Discussion
Discussion
P
a
per
|
Discussion
P
a
per
|
Discussion
P
a
per
|
Discussion
P
a
per
|
2 Description of the comparison instruments
2.1 ACE-FTS
The Atmospheric Chemistry Experiment Fourier Transform Spectrometer (ACE-FTS) on board SCISAT measures spectra between 750 and 4400 cm−1 in solar occultation
mode (Bernath et al., 2005). A scan consists of several spectra measured with tangent 5
heights from cloud top to 150 km. From these spectra a retrieval of atmospheric temper-ature, pressure and abundances of various trace gases including both CH4and N2O is
performed. The irregular retrieval grid is defined by the tangent altitudes. The retrieval setup is reported by Boone et al. (2005) for versions 2.1 and 2.2. For version 3.0 the changes in the retrieval setup are described in Boone et al. (2013) and chiefly address 10
temperature issues. The N2O data used for the comparison shown here was version
3.5, which is nearly identical to version 3.0, but solves a problem with the tempera-ture and pressure a priori, affecting profiles measured after September 2010. For this
version (and all latter versions), an altitude dependent status flag is available (Sheese et al., 2015), for the comparison, we only use data where this flag is zero. Since the 15
altitude flag is on an interpolated regular altitude grid, and we use the data on the re-trieval grid, we assumed a data point on the rere-trieval grid to be valid, if both the flag at the grid point directly above and below were valid. The reported random errors are derived from the least-squares fit and hence represent noise in the measured spec-tra. Additionally, they include a CO2term depending on the relative difference between
20
retrieved and a priori CO2profile.
For CH4, a research version of the 3.5 retrieval, was used. It is improved over version
3.5 in the treatment of the different isotopes. The ACE-FTS profiles of the 3.5 research
product have slightly lower mixing ratios than those of the version 3.5. This difference
is largest at 15 km and below, where it amounts to about 0.03 ppmv. The difference
25
declines between 15 and 25 km. Since MIPAS has higher mixing ratios, the differences
AMTD
8, 12105–12153, 2015Validation of CH4and
N2O profiles from
MIPAS-ENVISAT
J. Plieninger et al.
Title Page
Abstract Introduction
Conclusions References
Tables Figures
◭ ◮
◭ ◮
Back Close
Full Screen / Esc
Printer-friendly Version
Interactive Discussion
Discussion
P
a
per
|
Discussion
P
a
per
|
Discussion
P
a
per
|
Discussion
P
a
per
|
ACE-FTS is the only comparison instrument, which covers profiles of both CH4and N2O for both the MIPAS FR and RR measurement periods. The vertical resolution
of the profiles are in the order of 4 km. For the comparison to MIPAS profiles, data measured from 21 February 2004 on were used. The profiles for the comparison with the MIPAS full resolution period all are measured between 60 and 90◦
N. For the RR 5
period, the profiles are distributed more evenly over the latitudes.
2.2 SCIAMACHY
The Scanning Imaging Absorption Spectrometer for Atmospheric CHartographY (SCIAMACHY; Bovensmann et al., 1999) is an UV/VIS/NIR/SWIR spectrometer on board of ENVISAT. The instrument measures in several different geometries. This
com-10
parison was made with CH4 profiles retrieved from the solar occultation mode. This mode provides one measurement per orbit, between 50 and 70◦
N. The retrieval is conducted at the University of Bremen; the data version 4.5.2 has been used. The re-trieval setup for these profiles is described by Noël et al. (2015). The valid data range for this product is 17 to 45 km and its vertical resolution is in the order of 4 km. An error 15
estimate based on the residual of the spectral fit is provided.
2.3 HALOE
From September 1991 to 21 November 2005, the HALogen Occultation Experiment (HALOE) on board of the Upper Atmosphere Research Satellite (UARS) measured profiles of CH4 in occultation geometry (Russell III et al., 1993). We compared MIPAS
20
profiles to HALOE data version v19. This version has already been compared to ACE-FTS v2.2 profiles by De Mazière et al. (2008), where HALOE data was shown to have mixing ratios about 5 to 10 % lower than ACE-FTS. Waymark et al. (2013) found the CH4 ACE-FTS version 3.0 mixing ratios to be reduced at some altitudes compared to version 2.2. And since the version 3.5 reseach CH4data has even lower mixing ratios 25
AMTD
8, 12105–12153, 2015Validation of CH4and
N2O profiles from
MIPAS-ENVISAT
J. Plieninger et al.
Title Page
Abstract Introduction
Conclusions References
Tables Figures
◭ ◮
◭ ◮
Back Close
Full Screen / Esc
Printer-friendly Version
Interactive Discussion
Discussion
P
a
per
|
Discussion
P
a
per
|
Discussion
P
a
per
|
Discussion
P
a
per
|
(3.5 research) should be smaller than those in the earlier versions found by De Mazière et al. (2008). The typical vertical resolution of the profiles is given as 3–5 km (McHugh et al., 2005). An error estimate covering instrument noise is provided along with the data. The profiles used for the comparison to MIPAS data from the reduced resolution period were measured from January to August 2005 and are distributed over all latitude 5
bands.
2.4 Aura-MLS
Since July 2004, the Microwave Limb Sounder (MLS) on the Aura satellite measures N2O in the 640 GHz region (Waters et al., 2006). Details for the retrieval version v2.2
can be found in Lambert et al. (2007). The vertical resolution is between 4 and 5 km. 10
The retrieval algorithm derives an error estimate based on the instrument noise. For the comparison data version v3.3 was used. Here, for the temperature and tan-gent pressure the values retrieved in previous retrieval steps were used, while in ver-sion v2.2 (Lambert et al., 2007) those were retrieved jointly with N2O. The following selection criteria were implemented (as suggested by Livesey et al., 2013): valid pres-15
sure range: 100–0.46 hPa, estimated precision is positive, the status flag is an even number, the quality field is larger than 1.4, the convergence field is below 1.01 and any profiles are discarded, where at 68 hPa the N2O mixing ratio exceeds 350 ppbv. Since there is no data overlap with the MIPAS full resolution period, comparisons could be made for the reduced resolution data only.
20
2.5 Odin-SMR
The Sub-millimetre Radiometer (SMR, Murtagh et al., 2002) on board of the Odin satel-lite measures profiles of N2O in the 502.3 GHz region. Measurements are available
from February 2001 until the time of this writing, thus covering the complete temporal range of the MIPAS-ENVISAT dataset. We use data from the Chalmers University of 25
AMTD
8, 12105–12153, 2015Validation of CH4and
N2O profiles from
MIPAS-ENVISAT
J. Plieninger et al.
Title Page
Abstract Introduction
Conclusions References
Tables Figures
◭ ◮
◭ ◮
Back Close
Full Screen / Esc
Printer-friendly Version
Interactive Discussion
Discussion
P
a
per
|
Discussion
P
a
per
|
Discussion
P
a
per
|
Discussion
P
a
per
|
Details can be found in Urban et al. (2005). The vertical resolution is in the order of 1.5 km. The profiles cover an altitude of 15 to 70 km. We only used data where the measurement response variable exceeded 0.9 and the quality flag is 0 or 4. There is an error estimate available for the mapping of the instrument noise on the profile.
2.6 GCASN surface data
5
The Global Cooperative Air Sampling Network (GCASN) is a international project by the National Oceanic and Atmospheric Administration (NOAA) of the US Department of Commerce, operated by the Global Monitoring Division (GMD) at the Earth Sys-tem Research Laboratory (ESRL). It measures amount of substance fractions of CO2,
CH4, and several other trace gases. The surface air flask samples are taken at baseline
10
observatories, additional fixed locations and ships and are analysed at measurement laboratories. Information on the CH4product can be found in Dlugokencky et al. (1994)
and Dlugokencky et al. (2005). For our comparisons we used CH4 mean data
de-rived from 77 stations. These stations are located at latitudes between 89.98◦S and
82.45◦
N. The data version is 3 August 2015 (Dlugokencky et al., 2015). 15
2.7 HATS surface data
The Halocarbons and other Atmospheric Trace Species Group (HATS) of NOAA/GMD provide surface flask measurements of various atmospheric trace gases. We compared MIPAS N2O to the Combined Nitrous Oxide data product from the GMD at NOAA/ESRL
(Hall et al., 2007; Elkins and Dutton, 2009). The measurements of 13 cites stationed at 20
latitudes between 89.98◦S and 82.45◦N were used to calculate a global mean.
3 Description of the comparison method
AMTD
8, 12105–12153, 2015Validation of CH4and
N2O profiles from
MIPAS-ENVISAT
J. Plieninger et al.
Title Page
Abstract Introduction
Conclusions References
Tables Figures
◭ ◮
◭ ◮
Back Close
Full Screen / Esc
Printer-friendly Version
Interactive Discussion
Discussion
P
a
per
|
Discussion
P
a
per
|
Discussion
P
a
per
|
Discussion
P
a
per
|
spatial and temporal distance were applied. We used a maximum radius of rmax=
500 km and a maximum temporal deviation of∆tmax=5 h. For a comparison of MIPAS
data with any of the instruments, the selection of matching pairs was unambiguous in a sense that only one profile complied with the candidate MIPAS profile and vice versa. The total number of matched pairs for each instrument and the temporal coverage of 5
the matches are displayed in Table 1.
For the comparisons, the profiles of the instruments were interpolated to the MIPAS altitude grid. ACE-FTS, SCIAMACHY, HALOE and Odin-SMR provide the profiles on a geometric grid and hence a linear interpolation was used. For Aura-MLS the vertical coordinate of the profiles is pressure. These profiles were interpolated linearly in the 10
log(pressure) domain to the MIPAS grid using the MIPAS pressures.
To avoid sampling problems due to the different vertical extent of the profiles, only
data were used to calculate the mean profiles where both instruments in the respective pair provide valid values. The number of data points from which the mean is calculated is hence a function of the altitude. Typically the lower parts of the mean profiles contain 15
fewer data points than the means at higher altitudes. This is due to the fact that MIPAS spectra containing a cloud signal beyond a certain threshold are excluded from the analysis.
To compare two instruments, the mean over the data was calculated for each in-strument. Additionally, the standard deviation for each instrument was determined to 20
check if atmospheric variations are reproduced by both instruments consistently. To examine the bias between the instruments, the difference (both absolute and relative)
of the mean profiles was calculated. Also the standard error for the mean (absolute) difference has been derived to estimate the significance of the bias (von Clarmann,
2006). 25
AMTD
8, 12105–12153, 2015Validation of CH4and
N2O profiles from
MIPAS-ENVISAT
J. Plieninger et al.
Title Page
Abstract Introduction
Conclusions References
Tables Figures
◭ ◮
◭ ◮
Back Close
Full Screen / Esc
Printer-friendly Version
Interactive Discussion
Discussion
P
a
per
|
Discussion
P
a
per
|
Discussion
P
a
per
|
Discussion
P
a
per
|
σcombinedfor two instruments
σcombined=
q
σ2ref+σ2mip (1)
could be derived from the given error estimates (σrefand σmip) with Eq. (1) and
com-pared to the standard deviation of the difference. Since in a difference of collocated
measurements, atmospheric variability should largely cancel out, the standard devia-5
tion of the difference describes the statistical uncertainty of the difference. If the error
estimates were perfect, and the instruments sampled exactly the same air mass, the combined error estimate should equal the standard deviation of the difference.
For MIPAS, there also is an extended error estimate available for some selected mea-surements. It includes propagated errors of the preceding fitted variables temperature 10
and ozone mixing ratio as well as estimates of the uncertainties of the line of sight, the spectral shift, the calibration and the instrument line shape, the zonal temperature gra-dient, and the mixing ratios of all other gases where climatological values were used for the radiative transfer calculations during the retrieval. These estimated errors have been added quadratically to the MIPAS instrument noise error. A combination of this 15
extended MIPAS error and the other instrument’s error is shown as well. These ex-tended error estimates are not mean values over the sample, but just a representative example of a typical error budget for one sample scan. Hence perfect agreement to the standard deviation of the difference cannot be expected.
In general, the vertical resolutions of MIPAS and the different instruments do not
20
differ very much, hence one could assume that the MIPAS averaging kernels would
not be needed to be applied. However, the MIPAS profiles’ resolution is poorest at the boundaries, and the profiles of CH4 and N2O show large variations in the gradients at
the lower boundaries. This could lead to comparison artefacts at the lower boundaries of the profiles. Since the lower part of the MIPAS profiles is of particular interest for this 25
study because previous versions of CH4 and N2O from MIPAS show the largest bias
AMTD
8, 12105–12153, 2015Validation of CH4and
N2O profiles from
MIPAS-ENVISAT
J. Plieninger et al.
Title Page
Abstract Introduction
Conclusions References
Tables Figures
◭ ◮
◭ ◮
Back Close
Full Screen / Esc
Printer-friendly Version
Interactive Discussion
Discussion
P
a
per
|
Discussion
P
a
per
|
Discussion
P
a
per
|
Discussion
P
a
per
|
In the case of ACE-FTS the original profiles were degraded with the MIPAS averaging kernels (AKs) to remove artefacts in the differences, caused by their better altitude
resolution. We used profiles v mrACE
native on the native ACE-FTS retrieval grid which
consists of the tangent altitudes and hence is variable from profile to profile. This grid is coarser than the MIPAS grid. To apply the MIPAS AK (AMIP), we interpolated the ACE
5
profiles using the interpolation matrixWfrom the native ACE grid to the MIPAS grid. To get the degraded ACE profile on its own grid and to remove any finer structures which might be introduced by the using of the finer gridded MIPAS AK, we further applied the matrix which re-samples from the fine to the coarse gridV=(WTW)−1WTto the result.
A final interpolation to the MIPAS grid (usingW) enables the calculation of the mean 10
and taking the difference to the MIPAS profile. Since the MIPAS retrieval uses a zero
a priori, the comparison profile of ACE-FTS degraded with the MIPAS AK is given by:
v mrACE
AK
=WVAMIPWv mrACE
native (2)
The AK degraded value at one altitudezi is
v mrACE
AKi
=X
j
ai jv mrACE
nativej (3)
15
whereai j are the matrix elements ofWVAMIPW.
The AK can only be applied to a profile point at an altitude zi, if a valid data point of the reference instrumentv mrACE
nativej is available for all the elementsai j which are
not zero. Since the AKs in reality are never exactly zero, we neglected elements with a value below 0.001. That means if for the calculation of the degraded mixing ratio atzi, 20
profile elementsv mrACE
nativej are needed in the sense thatai j is above this threshold,
and there is at least at one of those profile elements no valid data point of the reference instrument, then the calculation of this profile point is not carried out and the mixing ratio at zi is marked as missing instead. However, if there are valid data points of the reference instruments, then the elements whereai j are below the threshold (e.g. 25
AMTD
8, 12105–12153, 2015Validation of CH4and
N2O profiles from
MIPAS-ENVISAT
J. Plieninger et al.
Title Page
Abstract Introduction
Conclusions References
Tables Figures
◭ ◮
◭ ◮
Back Close
Full Screen / Esc
Printer-friendly Version
Interactive Discussion
Discussion
P
a
per
|
Discussion
P
a
per
|
Discussion
P
a
per
|
Discussion
P
a
per
|
Due to this approach, the vertical extent of the profile is diminished after the degra-dation with the MIPAS AK. However, for ACE-FTS this alters the number of valid data points in the mean profiles only slightly because the vertical extent is larger than for MIPAS and only data points where both instruments show valid data are used to calcu-late the mean profiles. The ACE-FTS mixing ratios of CH4did not change notably due
5
to the degradation with the MIPAS AKs. The same holds for N2O in the full resolution
period. But for N2O in the reduced resolution period, the profiles show much lower mix-ing ratios at the lower end after the degradation. Those differences amount to about
17 ppbv at 9 km and decrease with altitude until 18 km, where both the degraded and the original ACE-FTS profiles show the same mixing ratios. This makes the application 10
of the MIPAS AKs for N2O in the reduced resolution period essential for the bias esti-mates. This is due to the MIPAS AKs being asymmetric at the lower end of the profile. Most of the information for the profile points at 12 km and below is in fact derived from spectra from altitudes above.
For Odin-SMR and Aura-MLS we used the same approach, since these are avail-15
able on coarser grids than MIPAS as well. For both instruments the data loss due to the border effects of the application of the MIPAS AKs is more pronounced than for
ACE-FTS, but still quite small: on average, about 3 km of the lower and upper ends of the profiles are lost. For Odin-SMR the extent of the mean profile is not altered, but the profile values below 22 and above 50 km are based on fewer data points. For Aura-MLS 20
the upper end of the mean profile is reduced from 59 to 54 km. At the lower end, the extent of the mean profile is not altered, but the mean below 21 km is based on fewer data points. Both instruments show slightly different mixing ratio differences to MIPAS
at the lower profile ends after the application of the AKs. For Odin-SMR, the largest differences between original and degraded profiles for the reduced resolution period
25
occur at around 18 km and amount to around 8 ppbv, declining both below and above until 20 km where both profiles show the same mixing ratios. For the full resolution pe-riod the differences between the two Odin-SMR profiles are similar, but their maximum
AMTD
8, 12105–12153, 2015Validation of CH4and
N2O profiles from
MIPAS-ENVISAT
J. Plieninger et al.
Title Page
Abstract Introduction
Conclusions References
Tables Figures
◭ ◮
◭ ◮
Back Close
Full Screen / Esc
Printer-friendly Version
Interactive Discussion
Discussion
P
a
per
|
Discussion
P
a
per
|
Discussion
P
a
per
|
Discussion
P
a
per
|
altitude up to 16 km where they show almost the same values. Between 17 and 19 km the differences amount to about 5 ppbv, above the degraded and the original profiles
agree.
The HALOE profiles are given on a finer grid than MIPAS.W′is the interpolation
ma-trix from coarse grid (MIPAS) to fine grid (HALOE). Then the HALOE profiles degraded 5
with the MIPAS averaging kernels are given by:
v mrHALOE
AK=AMIPV
′v mr
HALOEnative (4)
whereV′=(W′TW′)−1W′T. The degraded profiles do not differ much from the original
profiles. For the full resolution period the differences are around 0.03 ppmv between
12 and 17 km and for the reduced resolution period up to 0.08 ppmv between 14 and 10
16 km, with no differences outside these altitude ranges. By application of the
averag-ing kernels, the altitude coverage of HALOE profiles on average is reduced by 4 km. However the total extent of the mean profile does not alter, there just are fewer data points in the lower most 7 km.
The SCIAMACHY profiles are given on the same grid as MIPAS. Hence no interpola-15
tion is needed for the application of the MIPAS AKs to SCIAMACHY profiles. However, due to the limited altitude range of SCIAMACHY profiles, few data points remain after the application of the AKs. The only difference between the original SCIAMACHY mean
profile and the profile where the MIPAS AKs have been applied to is a slight oscillation with an amplitude of about 0.006 ppmv at the lower end (18 to 21 km in the comparison 20
for the full resolution period. Since the mean profile in that altitude region relies on very few data points, we think it is not representative. For the reduced resolution period, the difference between profiles where the MIPAS AKs were applied to and where not,
is very small (0.02 ppmv at 17 km, declining till zero at 20 km and 0.04 ppmv at 43 km, else zero). Because of the few data points left after the application of the AKs, we prefer 25
to show the profiles without the MIPAS AKs.
AMTD
8, 12105–12153, 2015Validation of CH4and
N2O profiles from
MIPAS-ENVISAT
J. Plieninger et al.
Title Page
Abstract Introduction
Conclusions References
Tables Figures
◭ ◮
◭ ◮
Back Close
Full Screen / Esc
Printer-friendly Version
Interactive Discussion
Discussion
P
a
per
|
Discussion
P
a
per
|
Discussion
P
a
per
|
Discussion
P
a
per
|
of CH4and N2O in the atmosphere in combination with the well-mixed troposphere and the absence of sources of CH4and N2O in the free troposphere allow the comparisons
of MIPAS mixing ratios in the (upper) troposphere to surface values. The comparison with the surface data networks GCASN (CH4) and HATS (N2O) was done using global monthly means. For the surface data, monthly meansv mri for each individual station
5
were used. Then a latitude-weighted global averagev mrglobalwas taken for each month according to Eq. (5), whereϕi is the latitude.
v mrglobal=
P
icos (ϕi)v mri
P
icos (ϕi)
(5)
For the comparison to surface data, we used the MIPAS mixing ratio at the altitude grid point 3 km below the tropopause to make sure to have a tropospheric value. For 10
the determination of the tropopause, we used two different approaches. In the latitude
band between 25◦S and 25◦N we used the altitude, where the potential temperatureΘ
equals 380 K. Outside that latitude band, we used the WMO criterion. In some cases this approach failed, so a manual post selection has been applied. A total of 1 % of the profiles have been discarded from this analysis, most of them measured during Arctic 15
winter conditions. The remaining MIPAS data were used to calculate monthly means for latitude bands 10◦ wide. For each station of the comparison surface data network,
the derived MIPAS value in the corresponding latitude band was taken to calculate a global monthly mean mixing ratio, using the same latitude dependent weighting func-tion (Eq. 5) as for the surface data.
20
4 Validation
4.1 Validation of reduced resolution methane
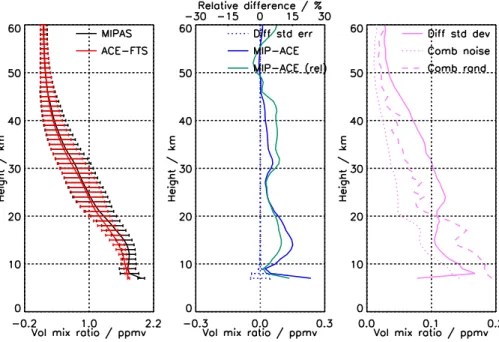
In Fig. 1 mean profiles of CH4 both of MIPAS for the reduced resolution period and
AMTD
8, 12105–12153, 2015Validation of CH4and
N2O profiles from
MIPAS-ENVISAT
J. Plieninger et al.
Title Page
Abstract Introduction
Conclusions References
Tables Figures
◭ ◮
◭ ◮
Back Close
Full Screen / Esc
Printer-friendly Version
Interactive Discussion
Discussion
P
a
per
|
Discussion
P
a
per
|
Discussion
P
a
per
|
Discussion
P
a
per
|
to their shape and values. At the lowermost profile point the MIPAS value is about 0.25 ppmv higher than the ACE value. This is caused by one profile only, and hence not representative. Both profiles are almost constant between 10 and 13 km. Above that altitude, the profiles decline with height. Between 10 and 15 km the two profiles are “belly shaped”, but for the MIPAS profile this is much more pronounced. Generally 5
the MIPAS mixing ratios are higher in the lower part of the profile. Between 15 and 46 km the profiles from both instruments decrease smoothly with height, the MIPAS profile showing slightly higher values. Above that altitude the profiles can no longer be distinguished. The standard deviation of the profiles is mostly similar, but especially in lower altitudes MIPAS shows a slightly higher variation. The general agreement of 10
the two standard deviations serves as an additional indicator that the two instruments describe the same physical distribution.
The mean differences (middle panel) show, that the MIPAS profiles have higher
mix-ing ratios below 45 km, with maximum differences of around 0.15 ppmv at 13 to 15 km.
Between 47 and 56 km MIPAS has slightly lower mixing ratios than ACE-FTS, further 15
above MIPAS values are higher again. Except for the lowermost profile point, the rel-ative differences do not exceed 10 %. The standard error of the mean difference
gen-erally is very small, indicating that the bias between the two datasets is significant. At the lowermost profile point, no value could be calculated because only one data point is available, but other than that, only the profile points between 8 and 9 km show areas 20
where the bias is smaller than its uncertainty and hence is statistically insignificant. The combined estimated error is smaller than the standard deviation of the difference
almost over the entire profile, so one or both of the instruments underestimates its er-rors. This is not surprising, because the available error estimates do not cover the total random error, but only measurement noise. Any (random) parameter errors (e.g. from 25
AMTD
8, 12105–12153, 2015Validation of CH4and
N2O profiles from
MIPAS-ENVISAT
J. Plieninger et al.
Title Page
Abstract Introduction
Conclusions References
Tables Figures
◭ ◮
◭ ◮
Back Close
Full Screen / Esc
Printer-friendly Version
Interactive Discussion
Discussion
P
a
per
|
Discussion
P
a
per
|
Discussion
P
a
per
|
Discussion
P
a
per
|
and standard deviations observed. Below 20 km the extended random errors seem to be overestimated.
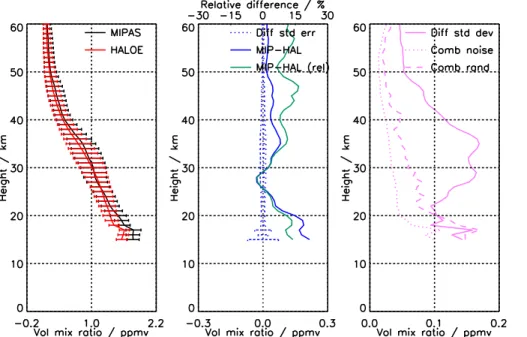
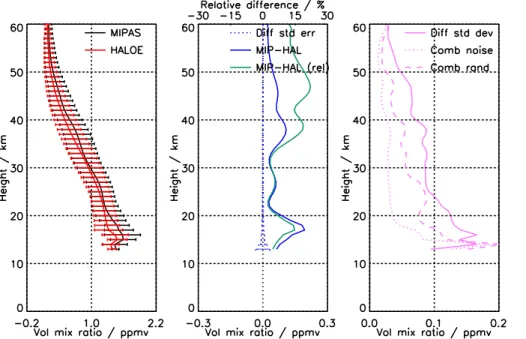
In Fig. 2 the comparison of CH4 reduced resolution data to the HALOE profiles is
shown. Both mean profiles have small kinks at 17 and 18 km, and a local maximum at 17 km. Above they show a steady decrease with height over the entire altitude range. 5
However, below 35 km, the HALOE profile shows a smoother decline, while the MIPAS profile’s vertical gradient has more oscillations, even though there are no actual local extrema. Above that altitude, the vertical gradients of the two profiles are almost iden-tical. Over the entire profile, HALOE’s mixing ratios are smaller than those of MIPAS. The bias is statistically significant everywhere. The maximum differences occur around
10
17 km and are around 0.2 ppmv. Above that altitude, they look quite similar to the diff
er-ences between MIPAS and ACE-FTS. The differences have a minimum at 28 km and
a secondary maximum at around 35 km of about 0.1 ppmv. In ACE-FTS such a sec-ondary maximum in differences is present as well, however it is located in slightly lower
altitudes at 31 km and the differences are smaller (0.05 ppmv). The combined error
15
of both instruments is clearly underestimated above 20 km, even taking the extended MIPAS error into account. Below that altitude the combined extended random error estimate is slightly larger than the standard deviation of the difference, while the error
estimate with noise only for MIPAS is still below the standard deviation.
Figure 3 shows the mean profiles from SCIAMACHY compared to MIPAS. The pro-20
files from both instruments show a steady decrease with altitude. However, while the SCIAMACHY profile declines much less between 25 and 27 km, the MIPAS profile de-clines more smoothly. Between 17 and 25 km, SCIAMACHY mixing ratios are about 0.15 ppmv lower. Then the differences decrease, above 27 km there are small diff
er-ences with alternating signs but in general there is a good agreement between the in-25
struments. Over the entire profile, the bias is significant. The combined error estimate is lower than the standard deviation of the difference for the estimate using the noise
bud-AMTD
8, 12105–12153, 2015Validation of CH4and
N2O profiles from
MIPAS-ENVISAT
J. Plieninger et al.
Title Page
Abstract Introduction
Conclusions References
Tables Figures
◭ ◮
◭ ◮
Back Close
Full Screen / Esc
Printer-friendly Version
Interactive Discussion
Discussion
P
a
per
|
Discussion
P
a
per
|
Discussion
P
a
per
|
Discussion
P
a
per
|
get is probably overestimated. However, considering that the extended error budget is for an example measurement only, the agreement between the standard deviation of the difference and the estimated error seems to be reasonable.
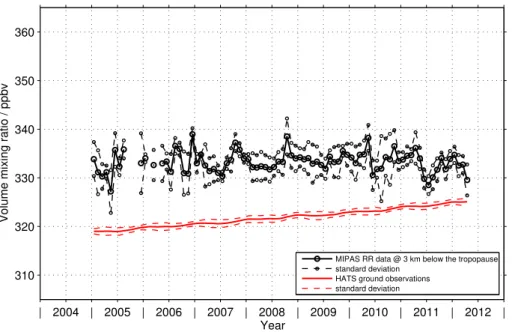
The comparison of MIPAS with the GCASN surface data is shown in Fig. 4. MIPAS mixing ratios are higher than those of GCASN, the differences average to 0.05 ppmv.
5
While the GCASN data shows a clear positive trend over the observation period, which is well documented (e.g. Dlugokencky et al., 2009) for MIPAS data this does not seem to be the case. This could be due to a negative drift overlaid on MIPAS CH4
measure-ments. This would be in agreement with recent findings by Kiefer et al. (2013) and Eckert et al. (2014) who found that MIPAS measurements are prone to an instrument 10
drift due to changing detector nonlinearities. The analysis of Kiefer et al. (2013) proves the resulting drift due to changing detector nonlinearities to be negative in most lat-itudes for CH4 in the upper troposphere and lower stratosphere. It is in the order of
0.04 ppmv dec−1.
The comparisons of MIPAS reduced resolution CH4 profiles to the three satellite 15
instruments are not conclusive. Between 30 and 35 km HALOE and ACE-FTS show lower mixing ratios than MIPAS, while SCIAMACHY is slightly higher. The latter in-strument has comparatively low values at 25 km, where the agreement between ACE-FTS and HALOE to MIPAS is quite good. Below 25 km the comparisons to ACE-ACE-FTS, HALOE and SCIAMACHY show, that MIPAS has the highest mixing ratios. Hence 20
a positive bias in that altitude region is likely. It is largest below 20 km where it is be-tween 0.1 to 0.2 ppmv. This bias is qualitatively confirmed by the comparison with the GCASN surface data, however here the difference is only 0.05 ppmv. The largest
dif-ference occurs with HALOE at 17 km, where MIPAS mixing ratios are around 0.2 ppmv higher. Overall version V5R_CH4_224 and V5R_CH4_225 has improved significantly 25
compared to versions V5R_CH4_222 and V5R_CH4_223 where Laeng et al. (2015) found differences to HALOE of up to 0.35 ppmv, and 0.2 ppmv to ACE-FTS (version 3.5)
AMTD
8, 12105–12153, 2015Validation of CH4and
N2O profiles from
MIPAS-ENVISAT
J. Plieninger et al.
Title Page
Abstract Introduction
Conclusions References
Tables Figures
◭ ◮
◭ ◮
Back Close
Full Screen / Esc
Printer-friendly Version
Interactive Discussion
Discussion
P
a
per
|
Discussion
P
a
per
|
Discussion
P
a
per
|
Discussion
P
a
per
|
research version used here (about 0.03 ppmv at those altitudes), the improvement of the newer MIPAS version is in the order of 0.08 to 0.15 ppmv.
All the comparisons show the combined random error estimate to be larger than the standard deviation of the difference in the lower altitudes. This could indicate, that the
selected MIPAS example measurement, for which the extended random error estimate 5
was conducted, is less representative for the entire dataset than hoped for. At higher altitudes, however, the combined error estimate is smaller than the standard deviation of the difference.
4.2 Validation of reduced resolution nitrous oxide
The comparison for the MIPAS reduced resolution period N2O profiles to ACE-FTS is
10
shown in Fig. 5. Both profiles show a steady, smooth decrease with altitude. Below 30 km the profiles from ACE-FTS have lower mixing ratios than MIPAS. The largest differences between the two instruments occur at 10 km and are around 30 ppbv. The
differences decline with altitude until around 33 km, where MIPAS has slightly lower
mixing ratios. In general the agreement between the two instruments above 30 km is 15
good.
In Fig. 6 the MIPAS N2O profiles are compared to those measured by Odin-SMR. The agreement between the two instruments is good. Their shapes are identical. Below 25 km MIPAS is slightly higher. The differences are largest at 17 to 18 km and are just
below 10 ppbv. Above 25 km MIPAS has slightly lower mixing ratios than Odin-SMR. 20
In the upper part of the profile, the relative differences are quite high, with MIPAS
showing lower values. But since this occurs at altitudes, where the absolute volume mixing ratios are very low, this does not indicate any severe problems with the datasets. The combined errors of the two instruments are underestimated below 36 km, even with the extended MIPAS error budget (although it clearly is an improvement over the 25
AMTD
8, 12105–12153, 2015Validation of CH4and
N2O profiles from
MIPAS-ENVISAT
J. Plieninger et al.
Title Page
Abstract Introduction
Conclusions References
Tables Figures
◭ ◮
◭ ◮
Back Close
Full Screen / Esc
Printer-friendly Version
Interactive Discussion
Discussion
P
a
per
|
Discussion
P
a
per
|
Discussion
P
a
per
|
Discussion
P
a
per
|
The comparison of MIPAS profiles to Aura-MLS (Fig. 7) demonstrates, that the two instruments generally agree with respect of the shape of the profile. The profiles show a maximum at 17 km and an almost steady decrease above that, only between 18 and 19 km the mixing ratios of both instruments are slightly increasing. Below 17 km, the profiles show declining values towards lower altitudes. MIPAS measured higher mixing 5
ratios between 15 and 27 km and slightly lower values between 27 and 41 km. The differences are largest at 17 to 21 km and amount to approximately 17 ppbv. The
max-imum in the mean profile is caused by the altitude dependent sampling. Those profiles which have values at lower altitudes are typically measured outside the tropics and measure lower mixing ratios than those which measure in tropical regions. A mean 10
based on entire profiles (within a fixed altitude range) does not show this maximum, but either the vertical extension or the amount of measurements in the mean is dimin-ished, depending on the chosen altitude range. The combined error estimate is too low between about 19 km and too high above 31 km. Outside that altitude range, the error estimates are larger than what would be expected by the standard deviation. This is 15
true, both for the estimate without as for that with the extended error budget. The latter decreases the difference to the standard deviation of the difference, especially in the
lower part of the profile, hence a reasonably good agreement can be achieved.
Figure 8 shows the comparison of global monthly means of MIPAS and HATS surface data. On average, MIPAS data proves to be 12 ppbv higher than the surface measure-20
ments. Similarly to the comparison for CH4, the trend over the period agrees poorly.
As for CH4 the MIPAS trend is smaller than that for the surface data, possibly due to
negative instrument drift, which would be in agreement to the findings of Kiefer et al. (2013) for N2O in the upper troposphere and lower stratosphere (around 7 ppbv dec−
1
). While there are noticeable differences between MIPAS and ACE-FTS and Aura-MLS,
25
AMTD
8, 12105–12153, 2015Validation of CH4and
N2O profiles from
MIPAS-ENVISAT
J. Plieninger et al.
Title Page
Abstract Introduction
Conclusions References
Tables Figures
◭ ◮
◭ ◮
Back Close
Full Screen / Esc
Printer-friendly Version
Interactive Discussion
Discussion
P
a
per
|
Discussion
P
a
per
|
Discussion
P
a
per
|
Discussion
P
a
per
|
4.3 Validation of full resolution methane
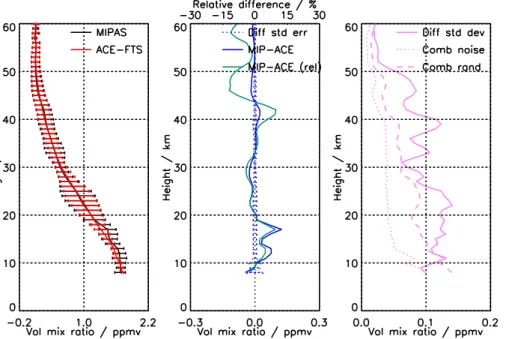
The comparison of ACE-FTS data to MIPAS CH4profiles from the full resolution period
(Fig. 9) uses only data from the northern high latitudes, due to the short data overlap and its non-uniform monthly latitude sampling. Both profiles have a similar shape and show a steady decrease with altitude. Differences of up to 0.12 ppmv at 17 km occur
5
and in the lower part of the profile MIPAS has slightly higher mixing ratios than ACE-FTS. Above 19 km the agreement between the two instruments is excellent. As in the reduced resolution period, the combined error estimate of the instruments using the MIPAS extended error budget is slightly too low, except for altitudes below 10 km, where the random errors seem to be slightly overestimated. Using the MIPAS extended error 10
budget improves the situation, but the resulting estimate still is lower than the standard deviation of the difference.
In Fig. 10 the MIPAS full resolution CH4 product is compared to HALOE. Both the instruments measured a steady decline with altitude, but the HALOE profile is smoother than MIPAS, for which the vertical gradient shows more variation. Over almost the entire 15
profile, MIPAS measures higher mixing ratios than HALOE. The largest differences
occur below 20 km, at its maximum MIPAS is about 0.2 ppmv higher than HALOE. The standard deviation of the difference indicates, that the combined errors for the
instruments are underestimated, even taking the extended MIPAS error budget into account.
20
The comparison of MIPAS full resolution CH4 profiles to SCIAMACHY is very
simi-lar to that of the reduced resolution period. Below 25 km the MIPAS mixing ratios are higher, the differences are below 0.1 ppmv. Between 25 and 35 km the agreement is
very good, MIPAS showing slightly lower mixing ratios. Above 35 km MIPAS has slightly higher mixing ratios than SCIAMACHY. The combined errors are slightly underesti-25
AMTD
8, 12105–12153, 2015Validation of CH4and
N2O profiles from
MIPAS-ENVISAT
J. Plieninger et al.
Title Page
Abstract Introduction
Conclusions References
Tables Figures
◭ ◮
◭ ◮
Back Close
Full Screen / Esc
Printer-friendly Version
Interactive Discussion
Discussion
P
a
per
|
Discussion
P
a
per
|
Discussion
P
a
per
|
Discussion
P
a
per
|
From comparisons of MIPAS global mean data to GCASN surface measurements (Fig. 12), we find, that MIPAS measures mixing ratios that are on average 0.07 ppmv higher than the surface data.
The comparisons with different instruments offer no easy conclusions. While the
MI-PAS profiles agree well with ACE-FTS, they have higher mixing ratios than HALOE. 5
They are higher than SCIAMACHY below 25 km and slightly lower above that altitude, yet higher again above 35 km. However, at around 17 km the differences to ACE-FTS,
HALOE and SCIAMACHY have their maximum, so it is likely, that MIPAS has a high bias at this altitude. Between 25 and 35 km MIPAS agrees well with ACE-FTS and SCIAMACHY, and even while higher mixing ratios were measured by HALOE, the bias 10
between MIPAS and HALOE is lower than at different altitudes.
4.4 Validation of full resolution nitrous oxide
In Fig. 13 the MIPAS full resolution N2O profiles are compared to those measured by
ACE-FTS. While the general agreement between the instrument with respect to their shape is good, the MIPAS profile below 20 km shows more bumps and kinks. The 15
differences between the two profiles are of the order of 10 ppbv and have alternating
signs. Their maximum is at the lower end of the profiles and exceeds 15 ppbv. Below 18 km MIPAS provides mostly higher mixing ratios than FTS, above 18 km ACE-FTS is higher, especially between 25 and 32 km. In between 18 and 25 km and above 32 km there is good agreement between the instruments. The bias is significant over 20
the entire altitude range. The estimate of the combined error is lower than what would be expected from the standard deviation of the difference.
The comparison of MIPAS to profiles measured by Odin-SMR generally looks good (Fig. 14). Below 19 km MIPAS is higher, the largest difference occurs at 16 km and is
just below 15 ppbv. Between 19 and 35 km the agreement is almost perfect. Above that 25
altitude the absolute differences remain very small, but MIPAS is slightly lower, which
AMTD
8, 12105–12153, 2015Validation of CH4and
N2O profiles from
MIPAS-ENVISAT
J. Plieninger et al.
Title Page
Abstract Introduction
Conclusions References
Tables Figures
◭ ◮
◭ ◮
Back Close
Full Screen / Esc
Printer-friendly Version
Interactive Discussion
Discussion
P
a
per
|
Discussion
P
a
per
|
Discussion
P
a
per
|
Discussion
P
a
per
|
error estimates are lower than the standard deviation of the difference in the lower part
of the profile, and higher in the upper part.
Figure 15 shows the comparison of global monthly means from MIPAS to those from the HATS surface data for the full resolution period. The MIPAS mixing ratios are 24 ppbv higher.
5
Especially around 17 km MIPAS seems to measure N2O volume mixing ratios which
are too high by 10 to 15 ppbv. The differences to the two satellite instruments are
smaller than the difference to the surface data. At higher altitudes the comparisons
are not conclusive. In general the absolute differences are small, but there are rather
large relative differences where MIPAS N
2O has lower mixing ratios than ACE-FTS and
10
Odin-SMR.
5 Comparison between full and reduced resolution period
The comparisons in Sect. 4 have been done independently for the two MIPAS mea-surement periods. However, since some of the comparisons are available for both the MIPAS full and reduced resolution period, we can draw some conclusions about the 15
consistency of the two datasets in doing cross comparisons between the differences
for the two MIPAS measurement periods to other instruments.
5.1 Consistency check for CH4
For CH4 the three comparison instruments ACE-FTS, HALOE and SCIAMACHY all
cover both MIPAS measurement periods. However for ACE-FTS, due to the small 20
overlap between the two instruments, only data between 60–90◦
N in February and March is available. To avoid sampling artefacts, in Fig. 16 the V5R_CH4_224 and V5R_CH4_225 products in the same latitudinal range in February and March are shown. This enables a comparison with Fig. 9 without any effects resulting from
AMTD
8, 12105–12153, 2015Validation of CH4and
N2O profiles from
MIPAS-ENVISAT
J. Plieninger et al.
Title Page
Abstract Introduction
Conclusions References
Tables Figures
◭ ◮
◭ ◮
Back Close
Full Screen / Esc
Printer-friendly Version
Interactive Discussion
Discussion
P
a
per
|
Discussion
P
a
per
|
Discussion
P
a
per
|
Discussion
P
a
per
|
period covers only measurements from 2004, while the reduced resolution comparison uses data from seven years (2006–2012), which makes this comparison vulnerable to meteorological anomalies, especially in 2004. The differences between MIPAS and
ACE-FTS for the two MIPAS measurement periods look similar. In general the diff
er-ences of the MIPAS reduced resolution comparison look smoother than for the full 5
resolution period. This is probably due to the different sample size. The MIPAS
re-duced resolution data provide slightly higher differences to ACE-FTS almost over the
entire profile. Only the spike at 17 km in the MIPAS full resolution profile shows a similar difference as the reduced resolution data, where no such spike is visible.
The comparison between HALOE and MIPAS full resolution data covers all the sea-10
sons, while for the reduced resolution data only profiles from January to August 2005 were measured. Hence we also compared means of full resolution data only using profiles in this seasonal range as well. However, the differences then reproduced the
differences shown in Fig. 10, hence this extra comparison is not shown here.
Com-paring the differences between HALOE and MIPAS for the two measurement periods
15
(Figs. 2 and 10) reveals that over most of the profile, the MIPAS reduced resolution data leads to slightly higher differences than the full resolution data, while the shape of the
differences is similar. In the full resolution data however, at 17 km there are particularly
high values in the MIPAS profile. This is similar to the spike in the same altitude at the comparison of the MIPAS full resolution data with ACE-FTS.
20
The comparison of the differences between SCIAMACHY and the two MIPAS
mea-surement periods (Figs. 3 and 11), shows, that at the lower altitudes MIPAS produces slightly higher mixing ratios for the reduced resolution period than for the full resolution data. At altitudes above 35 km, the full resolution period seems to lead to higher mixing ratios than the reduced resolution period.
25
In the comparisons of MIPAS with the GCASN surface dataset (Figs. 4 and 12), the differences are very similar, the bias for the full resolution is slightly higher.
AMTD
8, 12105–12153, 2015Validation of CH4and
N2O profiles from
MIPAS-ENVISAT
J. Plieninger et al.
Title Page
Abstract Introduction
Conclusions References
Tables Figures
◭ ◮
◭ ◮
Back Close
Full Screen / Esc
Printer-friendly Version
Interactive Discussion
Discussion
P
a
per
|
Discussion
P
a
per
|
Discussion
P
a
per
|
Discussion
P
a
per
|
full resolution period, at least in the lower part of the profile. An exception seems to be the kink in MIPAS full resolution. Hence there could be some bias between the mea-surement periods. The surface data comparison, however, hints at a better agreement between the two MIPAS datasets in the troposphere than at the altitudes above.
5.2 Consistency check for N2O
5
N2O profiles from ACE-FTS and Odin-SMR cover both the MIPAS measurement
peri-ods, hence we use those comparison to see whether we can draw conclusions about the consistency of the two MIPAS datasets.
For reasons described in Sect. 5.1, for the cross comparison using ACE-FTS, col-located profiles from February and March between 60 and 90◦N have been used for
10
N2O MIPAS reduced resolution data (Fig. 17). For the full resolution, see Fig. 13. Below 20 km, the MIPAS reduced resolution data provides higher mixing ratios than the full resolution data, the latter seems to agree better with the ACE-FTS instrument. Both differences to ACE-FTS have some oscillations, but they are not correlated.
The comparisons to Odin-SMR both look good (Figs. 14 and 6). For the full resolution 15
period there are small differences at 17 km, where MIPAS shows slightly higher mixing
ratios, while for the reduced resolution period this is less pronounced. In 19 to 20 km however, MIPAS mixing ratios in the reduced resolution period are slightly higher than Odin-SMR, while for the full resolution period the instruments agree well.
As for CH4 the difference between the HATS surface data and MIPAS for the full
20
resolution (Fig. 15) is slightly larger than for the reduced resolution period (Fig. 8). It is difficult to draw final conclusions, because below 15 km only comparisons to
ACE-FTS are available. They show, that, similarly to CH4, it is likely, that MIPAS
re-duced resolution spectra lead to higher mixing ratios than the full resolution period data. Above 18 km the data from Odin-SMR suggests that there is hardly any discrep-25
ancy between the MIPAS full and reduced resolution periods, while the differences to
AMTD
8, 12105–12153, 2015Validation of CH4and
N2O profiles from
MIPAS-ENVISAT
J. Plieninger et al.
Title Page
Abstract Introduction
Conclusions References
Tables Figures
◭ ◮
◭ ◮
Back Close
Full Screen / Esc
Printer-friendly Version
Interactive Discussion
Discussion
P
a
per
|
Discussion
P
a
per
|
Discussion
P
a
per
|
Discussion
P
a
per
|
6 Conclusions
The new MIPAS-ENVISAT CH4 and N2O profiles versions V5H_CH4_21
and V5H_N2O_21 and V5R_CH4_224, V5R_CH4_225, V5R_N2O_224 and
V5R_N2O_225 overall are found to have reduced the positive bias compared to other instruments. The bias for CH4 in the reduced resolution period reported by
5
Laeng et al. (2015) was reduced by 0.08 to 0.15 ppmv. However it is likely, that there still is a positive bias below 25 km for CH4 and N2O. The remaining differences are
between 0.05 and 0.2 ppmv for CH4 and between 0.0 and 30 ppbv for N2O. The two
MIPAS measurement periods overall prove to be reasonably consistent. However, at least for CH4 it seems likely that the reduced resolution period data has a slight 10
positive bias of 0.05 ppmv in the lower altitudes over the data from the full resolution period. Due to the asymmetric nature of the MIPAS AKs for profile points below 12 km, the application of the AKs to N2O profiles from ACE-FTS leads to rather large differences at the lower part of the profile and hence should not easily be dismissed.
Acknowledgements. J. Plieninger was funded by the “Helmholtz Climate Initiative REKLIM”
15
(Regional Climate Change), a joint research project of the Helmholtz Association of German research centres (HGF).
Work at the Jet Propulsion Laboratory, California Institute of Technology, was carried out under a contract with the National Aeronautics and Space Administration.
The Atmospheric Chemistry Experiment (ACE), also known as SCISAT, is a Canadian-led
20
mission mainly supported by the Canadian Space Agency and the Natural Sciences and Engineering Research Council of Canada.
The article processing charges for this open-access publication were covered by a Research Centre of the Helmholtz Association.
AMTD
8, 12105–12153, 2015Validation of CH4and
N2O profiles from
MIPAS-ENVISAT
J. Plieninger et al.
Title Page
Abstract Introduction
Conclusions References
Tables Figures
◭ ◮
◭ ◮
Back Close
Full Screen / Esc
Printer-friendly Version
Interactive Discussion
Discussion
P
a
per
|
Discussion
P
a
per
|
Discussion
P
a
per
|
Discussion
P
a
per
|
References
Bernath, P. F., McElroy, C. T., Abrams, M. C., Boone, C. D., Butler, M., Camy-Peyret, C., Car-leer, M., Clerbaux, C., Coheur, P.-F., Colin, R., DeCola, P., De Mazière, M., Drummond, J. R., Dufour, D., Evans, W. F. J., Fast, H., Fussen, D., Gilbert, K., Jennings, D. E., Llewellyn, E. J., Lowe, R. P., Mahieu, E., McConnell, J. C., McHugh, M., McLeod, S. D., Michaud, R.,
Mid-5
winter, C., Nassar, R., Nichitiu, F., Nowlan, C., Rinsland, C. P., Rochon, Y. J., Rowlands, N., Semeniuk, K., Simon, P., Skelton, R., Sloan, J. J., Soucy, M.-A., Strong, K., Tremblay, P., Turnbull, D., Walker, K. A., Walkty, I., Wardle, D. A., Wehrle, V., Zander, R., and Zou, J.: At-mospheric Chemistry Experiment (ACE): mission overview, Geophys. Res. Lett., 32, L15S01, doi:10.1029/2005GL022386, 2005. 12110
10
Boone, C. D., Nassar, R., Walker, K. A., Rochon, Y., McLeod, S. D., Rinsland, C. P., and Bernath, P. F.: Retrievals for the atmospheric chemistry experiment Fourier– transform spec-trometer, Appl. Optics, 44, 7218–7231, 2005. 12110
Boone, C. D., Walker, K. A., and Bernath, P. F.: Version 3 Retrievals for the Atmospheric istry Experiment Fourier Transform Spectrometer (ACE-FTS), in: The Atmospheric
Chem-15
istry Experiment ACE at 10: A Solar Occultation Anthology, edited by: Bernath, P. F., A. Deepak Publishing, Hampton, VA, USA, 103–127, 2013. 12110
Bovensmann, H., Burrows, J. P., Buchwitz, M., Frerick, J., Noël, S., Rozanov, V. V., Chance, K. V., and Goede, A. P. H.: SCIAMACHY: mission objectives and measurement modes, J. Atmos. Sci., 56, 127–150, 1999. 12111
20
De Mazière, M., Vigouroux, C., Bernath, P. F., Baron, P., Blumenstock, T., Boone, C., Brogniez, C., Catoire, V., Coffey, M., Duchatelet, P., Griffith, D., Hannigan, J., Kasai, Y., Kramer, I.,
Jones, N., Mahieu, E., Manney, G. L., Piccolo, C., Randall, C., Robert, C., Senten, C., Strong, K., Taylor, J., Tétard, C., Walker, K. A., and Wood, S.: Validation of ACE-FTS v2.2 methane profiles from the upper troposphere to the lower mesosphere, Atmos. Chem. Phys., 8, 2421–
25
2435, doi:10.5194/acp-8-2421-2008, 2008. 12111, 12112
Dlugokencky, E. J., Steele, L. P., Lang, P. M., and Masarie, K. A.: The growth rate and distribu-tion of atmospheric methane, J. Geophys. Res., 99, 17021–17043, doi:10.1029/94JD01245, 1994. 12113
Dlugokencky, E. J., Myers, R. C., Lang, P. M., Masarie, K. A., Crotwell, A. M., Thoning, K. W.,
30