DETERMINANTS OF ENTREPRENEURIAL ACTIVITY IN TIMES OF CRISIS: AN EMPIRICAL STUDY
Hatmanu (Gagea) Mariana, Iacobuță Andreea-Oana
Alexandru Ioan Cuza University of Iași, Romania, Faculty of Economics and Business Administration
Abstract: In the context of the present economic crisis, entrepreneurship has re-emerged as a topic of interest both for policy makers worldwide as well as for academic research. A wide range of psychological, economic and sociological factors influencing entrepreneurial activity is presented by the existing literature. The aim of this paper is to identify the economic and institutional factors that influenced entrepreneurial activity both before and during the crisis. Data for 27 countries worldwide from Global Entrepreneurship Monitor, World Bank World Development Indicators and World Bank’s Worldwide Governance Indicators international databases were collected for the years 2007, 2009 and 2012. A three stage empirical research was conducted: a comparative analysis of the distribution of the selected variables for the three years, principal components analysis in order to provide an image of the intensity and direction of the relationship between the variables and to characterize the statistical units and econometric modelling to describe the variation of entrepreneurial activity in relation with its economic and institutional determinants. Contrary to expectations, the research findings show that before the crisis, the variation of entrepreneurial activity is explained by the negative influence of the perceived confidence in the rules of society and during the crisis it is negatively influenced by the perceived government effectiveness. The limitations of the research are also presented.
Keywords: entrepreneurial activity; total early-stage activity (TEA); crisis; Principal Component Analysis method (PCA); econometric model.
JEL classification: C10; L26; M13; O40.
1. Background
In the context of the present economic crisis, entrepreneurship has re-emerged as a topic of interest both for policy makers worldwide as well as for academic research. The existing literature provides evidence on a wide range of factors influencing entrepreneurial activity. These can be grouped into three main categories: psychological or individual traits, sociological or institutional factors and economic characteristics (Vidal-Sune and Lopez-Panisello, 2013; Giannetti and Simonov, 2004).
The psychological approach takes into account the individual traits as mainly determinants for entrepreneurship. Empirical studies show that age, experience, origin,
religion, employment status, level of education etc. have an important role in individual’s
decision to become self-employed (Baron, 2000; Blanchflower et al., 2001).
From sociological side, individuals’ entrepreneurial decisions are determined by a wide
range of institutional and socio-cultural factors (Manolova et al., 2008). On the demand side, institutional environment influences opportunities for entrepreneurship. On the supply side, institutions play a significant role in stimulating entrepreneurial capabilities and preferences (Wennekers et al., 2002). Formal institutions such as educational system, competition, regulation, the tax system, social security, legislation etc. are proven
are studies exploring the relationship between cultural dimensions and entrepreneurial behaviour (Lee and Petersen, 2000).
The economic perspective brings forward the idea that the economic factors are the ones which mostly influence entrepreneurial activity (Wennekers et al., 2005). The relationship between variables of the macroeconomic environment and the rate of entrepreneurial activity has been extensively explored in literature. The burden of regulations such as, high costs of entry, and bureaucracy costs were proven to be obstacles to entrepreneurial activity (Klapper et al., 2004). Institutional features such as, the tax environment, government size, the level of trust, corruption, the level of financial development (Giannetti, 2003), market conditions such as size and growth (Davidsson et al., 1994) also impact upon the level of entrepreneurship development. The relationship between unemployment and entrepreneurship is an ambiguous one: some researchers argue that unemployment has a positive effect on entrepreneurship (Martinez-Granado, 2002) while others demonstrate that higher unemployment levels are associated with low entrepreneurial activity (Storey and Johnson, 1987).
The aim of this paper is to identify the economic and institutional factors that influence entrepreneurial activity both before and during the crisis. Section 2 describes the research design and methods and in Section 3 we present and discuss the research results. The last part of the paper briefly summarizes the conclusions.
2. Data and methodology 2.1. Data
To measure the level of entrepreneurial activity this paper uses Total Early-Stage Entrepreneurial Activity (TEA) from Global Entrepreneurship Monitor (GEM) (http://www.gemconsortium.org/key-indicators), as the dependent variable. The variable describes the percentage of 18-64 population who are either a nascent entrepreneur or owner-manager of a new business.
Data for the independent variables describing the economic context – GDP growth (RGDP, annual percentage growth rate of GDP at market prices based on constant local currency), Total tax rate (TTR, the amount of taxes and mandatory contributions payable by businesses after accounting for allowable deductions and exemptions, as a share of commercial profits), Unemployment (UR, the share of the labour force that is without work but available for and seeking employment) and Inflation (IR, the annual percentage change in the cost to the average consumer of acquiring a basket of goods and services)
– were collected from the World Bank, World Development Indicators (WDI) database (http://data.worldbank.org/indicator) .
The data for the institutional environment – Government effectiveness, Voice and accountability, Control of corruption, Regulatory quality and Rule of Law – were retrieved
from the World Bank’s Worldwide Governance Indicators (WGI, http://info.worldbank.org/governance/wgi/index.aspx#home) database. They reflect (Kaufmann et al., 2010):
§ Government effectiveness (GEF): perceptions of the quality of public services, the quality of the civil service and the degree of its independence from political pressures, the quality of policy formulation and implementation, and the credibility of the government's commitment to such policies.
§ Voice and accountability (VA): perceptions of the extent to which a country's citizens are able to participate in selecting their government, as well as freedom of expression, freedom of association and a free media.
§ Regulatory quality (RQ): perceptions of the ability of the government to formulate and implement sound policies and regulations which permit and promote private sector development.
§ Rule of Law (RL): perceptions of the extent to which agents have confidence in and abide by the rules of society, and in particular the quality of contract enforcement, property rights, the police, and the courts, as well as the likelihood of crime and violence.
Data are registered at the level of years 2007, 2009 and 2012. Data are processed in SPSS (Jaba and Grama, 2004: 98-111, 232-259).
2.2. Sample
Our sample includes 27 countries worldwide, selected based on data availability for the three years mentioned above: Argentina, Belgium, Brazil, Chile, China, Colombia, Croatia, Denmark, Finland, France, Greece, Hungary, Israel, Italy, Japan, Latvia, Netherlands, Norway, Peru, Romania, Russia, Slovenia, Spain, Switzerland, United Kingdom, USA, Uruguay.
2.3. Methods
The empirical research has three stages. The first step is to analyse the distributions of the considered variables followed by testing the equality of the average level of a phenomenon between the considered moments in time. The analysis of the distributions of the considered variables consists in identifying the outlier points using box-plot diagram and checking normality of distribution, which is a prerequisite of many methods and statistical techniques. Student-t test is most often used to check the equality of the average of two paired samples (Bluman, 2004: 431-492). Applying this test is appropriate if the distributions of the sample are normal or approximately normal. The normality of the sample is observed if certain conditions are met: i) the population distribution is normal; ii) the sample data are symmetric, unimodal, without outliers, and the sample size is less than 15 observations; iii) The sample data are slightly skewed skewed, unimodal, without outliers, and the sample size is 16 to 40 observations; iv) sample size is greater than 40 observations. We also use the nonparametric Wilcoxon test (Siegel, 1991: 99). Wilcoxon test is less restrictive than Student-t test, assuming only the following conditions: i) the analyzed variables are continuous; ii) there are no restrictions on the distribution of deviations between the values of the two paired samples; iii) subjects may belong to different populations.
The second part of the research is Principal Components Analysis (PCA method). Considering data dimensionality, a synthetic image of the intensity and direction of the relationship between them can be obtained with PCA (Pintilescu, 2007: 30-109). The results obtained by applying PCA for the three years show that the application of this method is adequate for analysing the considered variables.
The last part consists in elaborating an econometric model to describe the variation of Total Early-Stage Entrepreneurial (TEA) in relation to the independent factors identified by correlation analysis and using the information obtained with PCA. The model will be validated by testing the significance of the regression parameters and of statistical hypotheses (Maddala, 1999: 197-291; Gujarati, 1995: 319-446; Jula and Jula, 2010: 163-250): the normality assumption (Kolmogorov-Smirnov test), absence of autocorrelation
3. Empirical results
3.1. The analysis of the distributions of the considered variables
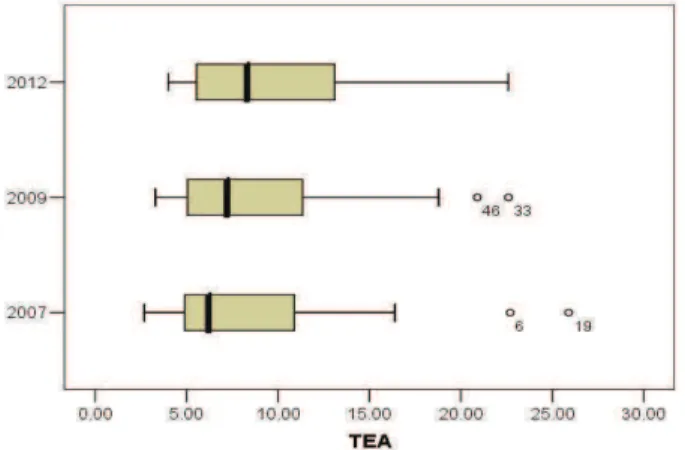
The comparative analysis of the distribution of TEA for the three years (Figure 1) highlights the following aspects: there are differences in the average level of the phenomenon, with increases from 2007 to 2012; the distributions for 2007 and 2009 display outliers and all distributions are positively skewed.
Figure 1: The comparative representation of the distribution of TEA in 2007, 2009 and 2012
The normality of the distribution of TEA is checked with Jarque Bera test. The results are presented in Table 1.
Table 1: The results of Jarque Bera test applied to TEA distribution Variable JB Probability Decision
TEA_2007 15.925 0.000 Hypothesis H0 is rejected TEA_2009 5.622 0.060 Hypothesis H0 is not rejected TEA_2012 3.892 0.143 Hypothesis H0 is not rejected
TEA follows a normal distribution only in 2009 and 2012. In 2007, the distribution is affected by strong outliers, leading to failure of normal distribution law.
Further, we check whether the differences between the average level of TEA for the years considered are statistically significant. Student-t test is most often used to check the equality of the average of two paired samples.
The assumptions of Student-t test are met by the distributions of TEA for 2009 and 2012, but not for 2007, which displays outliers and a strong positive skewness.
Consequently, the Student test can be applied to check the equality of the average level of TEA for 2009 and 2012. For the other comparisons we can use the nonparametric Wilcoxon test.
Table 2: The results of the tests on the equality of the average levels of two paired samples, for TEA, in 2007, 2009 and 2012
Variables Statistic test Decision
TEA_2007 & TEA_2009 Wilcoxon Z* Hypothesis H0 is not rejected -1.194
(0.233)**
TEA_2007 & TEA_2012 Wilcoxon Z Hypothesis H0 is rejected -2.273
(0.023)
TEA_2009 & TEA_2012 Student t Hypothesis H0 is rejected -2.006
(0.055)
Wilcoxon Z Hypothesis H0 is rejected -2.185
(0.029)
* For samples greater than 25 observations, the distribution of Wilcoxon statistic tends to the normal distribution Z.
** In parentheses are shown the probabilities attached to the calculated values of the tests.
The distribution of TEA shows no statistically significant variations between 2007 and 2009. The differences are significant between 2009 and 2012 and, more pronounced, between 2007 and 2012.
We check if the variables considered registered significant variations between the
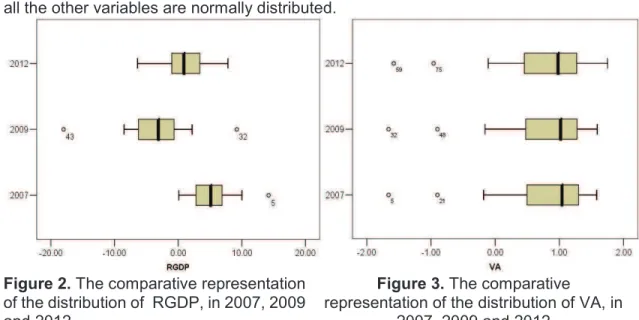
moments “before and after” the economic crisis. The results for the five variables (RGDP, CC, GEF, RL and VA), the most representatives for the present research, are presented. In the same manner as presented above for the analysis on TEA, we check if the independent variables meet the normality assumptions required by Student-t test. With the exception VA variable, which does not follow a normal distribution, displaying outliers,
negative (figure 3) and having the value of JB statistics higher than the critical value
c
a2,2, all the other variables are normally distributed.
Figure 2. The comparative representation of the distribution of RGDP, in 2007, 2009 and 2012
Figure 3. The comparative
representation of the distribution of VA, in 2007, 2009 and 2012
significant differences only for economic growth rate, which can be also visualised in the box plot diagram above (figure 2).
3.2. Principal Components Analysis (PCA method)
The value of the Correlation Matrix determinant is close to zero and shows that there are strong relations between the statistical variables.
The computed value of
c
2 statistic and its associated probability (; 000 . 0 Pr , 201 . 261 2007 2
2007 = ob =
c
c
20092=
260
.
962
,
Pr
ob
2009=
0
,
000
;000
.
0
Pr
,
109
.
2685
2012 22012
=
ob
=
c
) allows us to reject the null hypothesis and acceptthe existence of significant relations between variables.
The same results are indicated by the value of KMO test-statistic which shows that PCA is adequate:
KMO
2007=
0
.
789
;KMO
2009=
0
.
800
;KMO
2012=
0
.
793
.The share of the variance of the variables extracted by factorial axes shows the correlation of the variables with the axes. For all variables we obtained high values for the extracted variances. The values of the extracted variances of TEA are satisfactory:
374 . 0 2 2007 , = extr
s
;s
extr2 , 2009 =0.623;s
extr2 , 2007 =0.567.The first two factorial axes meet the Kaiser criterion and cumulatively explain an important share of the total variance: 2007 – 74.1227%; 2009 – 73.607%; 2012 – 73.879%. We made an option to keep only the first two factorial axes for an easier interpretation of the results.
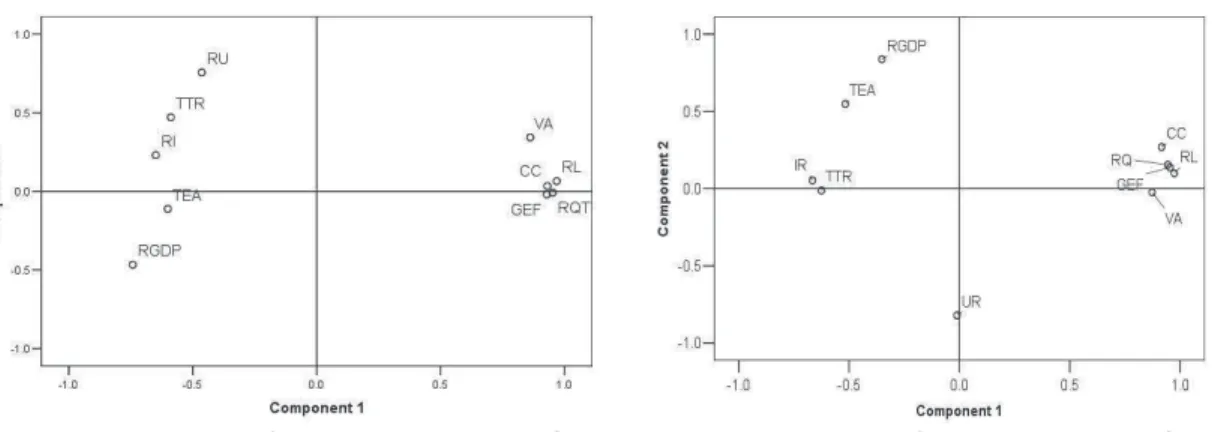
The representation of variables on the two first factorial axes allows us to identify the direction and the intensity of the relation between them (figures 4 and 5).
Figure 4: Variables’ positions on the first
two factorial axes, 2007
Figure 5: Variables’ positions on the first
two factorial axes, 2012
Analysing the contribution of the variablesX j, j=1,10, to the formation of the factorial
axes, we found the following:
· In 2007, the first factorial axis is explained by all the analysed variables; the second factorial axis is explained by unemployment rate (UR), total tax rate (TTR) and economic growth rate (RGDP);
(TTR); the second factorial axis is explained by economic growth rate (RGDP), TEA, UR and CC.
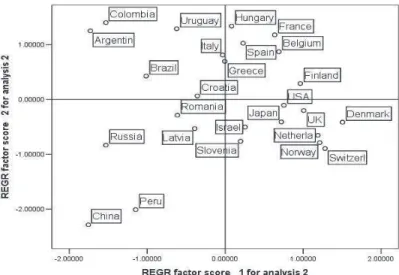
Figure 6: Countries’ position on the first two factorial axes, 2007
TEA and the institutional factors are situated in opposite quadrants, being negatively correlated. TEA and RGDP are situated close to each other, so they are strongly positively correlated. Between 2007 and 2012, the institutional factors have slightly modified their position on the map while the macroeconomic indicators (UR, IR, RGDP) and TEA register significant modifications.
Figure 7: Countries’ position on the first two factorial axes, 2012
Countries’ position on the first two factorial axes highlights the following aspects: i) on the right side of the map we notice mostly the developed (ex. Norway, Sweden, Finland), with good institutions (high values for the institutional factors) ii) the developed countries register low values for TEA; iii) on the left side of the map there are the less developed countries, with high level of TEA showing that entrepreneurship is supported and it is seen
as a factor of development; iv) in 2012, compared to 2007, countries’ positioning
3.3. Econometric modelling
The first step in elaborating an econometric model to explain the variation of TEA consists in identifying the independent variables which influence it. We applied Pearson correlation analysis and we considered the results obtained above with PCA.
Taking into account the significance of the correlation coefficient, for the years considered, TEA is negatively correlated with all institutional indicators and positively correlated with economic growth rate. This aspect was also noticed in the maps obtained in Figures 4 and 5 with PCA. TEA is not correlated with unemployment rate, inflation and total tax rate. We estimate the regression model using Backward method.
The estimated equations of the three models are: 2007 - TEAi =
b
0+b
1RLi =10.981-3.384RLi2009 -
TEA
i=
b
0+
b
1RGDP
i+
b
2GEF
i=
13
.
349
+
0
.
539
RGDP
i-
2
.
966
GEF
i2012 - TEAi =
b
0+b
1RGDPi+b
2GEFi =10
.
695
+
0
.
981
RGDP
i-
2
.
129
GEF
iAt the level of 2007, the variation of TEA is explained by the negative influence of the variable rule of Law (RL). The regression model has the same form for 2009 and 2012, the predictors of TEA being the economic growth rate (RGDP) with positive influence and government effectiveness (GEF), with negative influence.
The coefficients of the regression model are statistically significant for a significance level of 5%, except for the coefficient of GEF which, in the model for 2012, is significant if accepting a risk of 10 %.
The standardised regression coefficients from the multiple models corresponding to 2009 and 2012 allow establishing a hierarchy of the variables within the model. So, in both models, the variable RGDP has a stronger influence on TEA than the variable GEF. The coefficient of determination (R-squared) shows that, in 2007 the variation of TEA is explained to a small extent by our model (28.6%). In 2009 and 2012, 51.5% and, respectively, 44.4% of the variation of TEA is explained by the cumulative variation of RGDP and GEF.
The validation of the regression model is done by testing the hypotheses of the regression errors.
According to Kolmogorov-Smirnov test, the regression errors display a normal distribution:
)
05
.
0
(
)
910
.
0
(Pr
ob
2007=
>
a
=
;(Pr
ob
2009=
0
.
953
)
>
(
a
=
0
.
05
)
)
05
.
0
(
)
937
.
0
(Pr
ob
2012=
>
a
=
, for a risk of 5%.The absence of autocorrelation is checked with Durbin-Watson test. The computed values for each of the three models (
dw
2007=
1
.
593
;dw
2009=
1
.
913
;dw
2012=
2
.
011
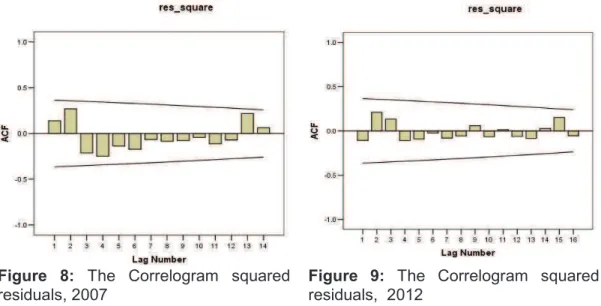
) are located in the range where the null hypothesis can be accepted and, consequently, the errors are not autocorrelated.Figure 8: The Correlogram squared residuals, 2007
Figure 9: The Correlogram squared residuals, 2012
The multicollinearity of the independent variables from the regression models is verified by analyzing the indicators VIF (Variation Inflation Factor) and TOL (Tolerance). All the values registered for VIF, corresponding to the independent variables in the models for 2009 and 2012 are low (VIF2009=1.043; VIF2012=1.050), and the values for TOL are high (TOL2009=0.959; TOL2012=0.953). This leads to the acceptance of the null hypothesis that is there is no collinearity of the independent variables.
To conclude, the regression models are validated. TEA dynamics is significantly, but to a small extent, explained by variables such as economic growth rate, rule of law and government effectiveness.
4. Conclusions
This paper aimed at identifying the factors which influence entrepreneurial activity in times of crisis. Statistical analyses were performed for several moments in time, in order to provide an image of these factors and their dynamics before and after the appearance of the economic crisis.
Entrepreneurial activity, measured with the percentage of 18-64 population who are either a nascent entrepreneur or owner-manager of a new business, shows no statistically significant variations between 2007 and 2009. The differences are significant between 2009 and 2012 and, more pronounced, between 2007 and 2012. We can say that the crisis has impacted upon entrepreneurship development.
Out of the independent variables only economic growth rate registers significant variations in the analysed period. The results reflect the reality of the crisis which hampered the possibilities for economic growth and brought significant decreases in the GDP growth rate at its beginnings and slight increases starting with 2010.
Entrepreneurial activity is positively correlated with economic growth rate. Also, between 2007 and 2012, the institutional factors have registered only slight variations while the macroeconomic indicators, unemployment rate and inflation rate, registered significant variations.
Contrary to expectations, the findings show that in 2007, before the crisis, the variation of entrepreneurial activity is explained by the negative influence of the Rule of law, i.e. the perceived confidence in the rules of society and the quality of contract enforcement, and property rights. In the same manner, in 2009 and 2012, entrepreneurial activity is negatively influenced by the perceived government effectiveness.
When interpreting the results we should be aware of the limitations of the research which come from the sample size and representativeness due to data availability.
References
Baron, R. (2000) “Psychological Perspectives on Entrepreneurship: Cognitive and Social Factors in Entrepreneurs’ Success”, Current Directions in Psychological Science, 9, pp. 4-27.
Blanchflower, D.G.,Oswald, A. and Stutzer, A. (2001) “Latent entrepreneurship across nations”, European Economic Review, 45, pp. 680-691.
Bluman, A.G. (2004) Alementary Statistics,5th edition, The MCGraw-Hill Companies, Inc., New York.
Davidsson, P., Lindmark, L. and Olofsson, C. (1994) “New firm formation and regional development in Sweden”, Regional Studies, 28, pp. 395-410.
Giannetti, M. (2003) “Do better institutions mitigate agency problems? Evidence from
corporate finance choices”, Journal of Financial and Quantitative Analysis, 38, pp.185-212.
Giannetti, M. and Simonov, A. (2004) ”On the determinants of entrepreneurial activity: Social norms, economic environment and individual characteristics”, Swedish Economic Policy Review, 11, pp. 269-313.
Gujarati, D.N. (2004) Basic Econometrics, The McGraw-Hill Company, Fourth Edition. Jaba, E., Grama, A. (2004) Analiza statistică cu SPSS sub Windows, Editura Polirom,
Iași.
Jula, N. and Jula, D. (2010) Modelare economică, Modele econometrice şi de optimizare, Ed, Mustang, Bucureşti.
Kaufmann, D., Kraay, A. and Mastruzzi, M. (2010) "The Worldwide Governance Indicators : A Summary of Methodology, Data and Analytical Issues", World Bank Policy Research Working Paper No. 5430.
Klapper, L., Laeven, L. and Rajan, R. (2004) “Business Environment and Firm Entry: Evidence from International Data”, NBER Working Paper No. 10380, National Bureau of Economic Research, [http://www.nber.org/papers/w10380]
Lee, S. M. and Peterson, S. J. (2000) “Culture, entrepreneurial orientation, and global competitiveness”, Journal of World Business, Vol. 35, No. 4, pp. 401-416.
Maddala, G.S. (1999) Limited-Dependent and Qualitative Variables in Econometrics, Cambridge University Press.
Manolova, T. S., Eunni, R. V., and Gyoshev, B. S. (2008) “Institutional Environments for Entrepreneurship: Evidence from Emerging Economies in Eastern Europe”,
Entrepreneurship: Theory & Practice, Vol. 32, No. 1, pp. 203-218.
Martinez-Granado, M. (2002), “Self-employment and labour market transitions: A multiple
state model”, CEPR Discussion Paper 3661, Center for Economic Research.
Pintilescu, C. (2007) Analiză statistică multivariată, Editura Universității “Alexandru Ioan Cuza” Iași.
Reynolds, P.D., Hay, M., Bygrave, W.D., Camp, S.M. and Autio, E. (2000) Global Entrepreneurship Monitor: 2000 Executive Report, Kauffman Center for Entrepreneurial Leadership.
Storey, D.J. and Johnson, A.M. (1987) Job Generation and Labour Market Change, London: Macmillan.
Vidal-Sune, A. and Lopez-Panisello, M.B. (2013) ”Institutional and economic determinants of the perception of opportunities and entrepreneurial intention”,
Investigaciones Regionales, 26, pp. 75-96.
Wennekers, S., Uhlaner, L.M. and Thurik, R. (2002) “Entrepreneurship and Its Conditions: A Macro Perspective”, International Journal of Entrepreneurship Education, Vol. 1, No. 1, pp. 25-68.