Journal of Engineering Science and Technology Review 6 (1) (2013) 83 -86
Research Article
Effect of Particle Size and Lattice Strain on the Debye-Waller Factors of Copper (Cu)
Powder Using High Energed Ball Mill
E. Purushotham*
Department of Physics, SR Egineering college (Autonomous), Warangal-506 371, India
Received 21 September 2012; Accepted 8 February 2013
___________________________________________________________________________________________________
Abstract
Lattice strains in Cu powder produced by milling have been analyzed by X-ray powder diffraction. The lattice strain (ε) and Debye-Waller factor (B) are determined from the half-widths and integrated intensities of the Bragg reflections. In Cu, the Debye-Waller factor is found to increase with the lattice strain. From the correlation between the strain and effective Debye-Waller factor, the Debye-Waller factors for zero strain have been estimated for Cu. The variation of energy of vacancy formation as a function of lattice strain has been studied.
Keywords: X-ray diffraction, lattice strain, crystallite size, Debye-Waller factor, vacancy formation energy.
___________________________________________________________________________________________________
1. Introduction
Copper is one of the most widely used structural ceramics [1,2]. Several properties of alumina are controlled by itsmicrostructure and its matrix stability.The Debye-Waller factor is an important lattice dynamical property. There is considerable X-ray work on the Debye-Waller factors of Cu [3-4]. But it is interesting to study the effect of lattice strains on the Debye-Waller factors of these metals. Inagaki et al [5,6] showed that in several non-metallic powders, the strains produced during grinding have a significant effect on the Debye-Waller factors measured from X-ray diffraction intensities. Sirdeshmukh et al [7] observed the effect of lattice strains on the Debye-Waller factors in semiconductor powder materials. Gopi Krishna and Sirdeshmukh [8] studied the effect of lattice strains on the Debye-Waller factor of ytterbium metal. In the present investigation the results of a systematic study of the effect of lattice strains on the Debye-Waller factors and crystallite size of face centred cubic Cu metal is reported. These results are being reported for the first time.
2. Experimental
Pure copper metal supplied by Fluka (UK) was used for the study. The powder samples were obtained by gently filing highly pure Cu metal ingots with a jeweller’s file. A part of this powder was used to prepare the initial sample. The remaining powder was subjected to milling in an ball mill for 4, 8, 12, 16 and 20 hours to produce strains. X-ray diffractograms were recorded with the initial sample and with samples prepared after each spell of milling. The XRD patern of Cu is given in Fig. 1. The diffractograms were obtained with a Philips CWU 3710 X-ray powder
diffractometer in the 2θ range 20-120º using filtered CuKa at a goniometer speed of 0.5°per minute and a chart speed of 20 mm/min. All measurements were made at room temperature. The observed integrated intensities have been corrected for thermal diffuse scattering using the method of Chipman and Paskin [9].
1. Analysis of Data
For the relative intensity method, the expression for the observed intensities I0 is given by
I0 = CLpJFT 2
(1)
where Lp is the Lorentz-polarization factor, J, the multiplicity factor, FT the structure factor and C is a constant. For a flat powder specimen, the absorption correction is independent of the angle θ, Klug and Alexander[ 10] and, hence, is lumped with the constant. The structure factor FT in terms of the structure factor F for the static lattice is given by
FT = Fe -M
(2)
We may also write Eq. (1) as
I0=
2
sin
2
−
λ θ
B
ce
I (3)
where I c is the intensity corresponding to the static lattice and is given by
I c=LpJF 2
(4)
For crystals with fcc structure, the structure factor F is given by
J
estr
JOURNAL OF Engineering Science andTechnology Review
www.jestr.org
______________
* E-mail address: [email protected]
E. Purushotham /Journal of Engineering Science and Technology Review 6 (1) (2013) 83 -86
84
F = 4f (5)
Fig. 1. XRD patern of Cu
f being the atomic scattering factor. Values of the atomic scattering factor were taken from Cromer and Waber [11] and International Tables for X-ray Crystallography [12], and have been corrected for dispersion, Cromer and Liberman [13]. The choice of the atomic scattering factors was guided by Cromer’s [11] recommendation who suggested that the atomic scattering factors given in the International Tables for X-ray Crystallography [12] which are computed from the Hartree-Fock wave functions are the best for the lighter atoms or ions in the periodic table up to Rb+1. For the heavier atoms or ions Cromer recommends the use of the Dirac-slater relativistic scattering factors given by Cromer and Waber [11].
From Eq. (3) it can be seen that log (I0/Ic) is linearly related to (sin θ/ λ)2. By a least square treatment of data, B was determined. From the Debye-Waller theory
B =
3
8
π
2<u2> (6)
for a cubic crystal, where <u 2> is the mean-square amplitude of vibration. Further, B, may also be expressed as
B =
T
mk
h
B
2
6
W(x) (7)
where m is the mass, T the absolute temperature and h and kB are the Planck and the Boltzmann constants respectively. The function W(x) is given by
W(x) =
+
x x
x
4 1 ) (
2
φ (8)
where ø(x) is the Debye function and x= θM/T, θM being the Debye temperature. Benson and Gill [14] have tabulated values of W(x) for a wide range of x for small increments, from which θM can be obtained from the value of B.
The total peak broadening Br may be expressed as,
Brcosq =
ε
s
in
θ
t
kλ
+
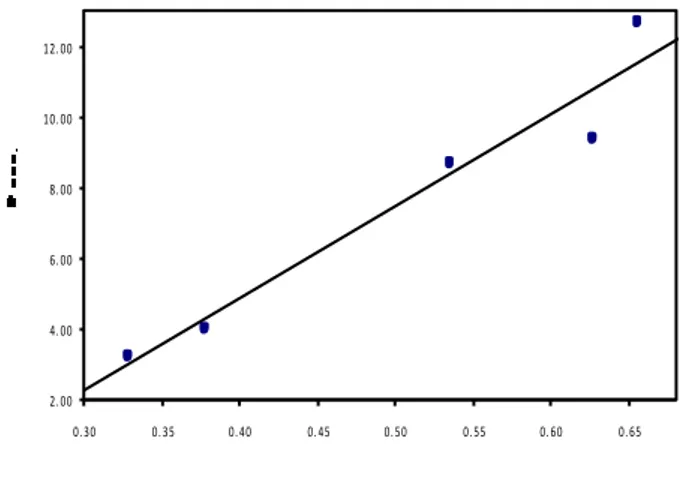
(9)The plot of Br cosq/l versus sinq/l is a straight line with slope equal to ε and hence the particle size ‘t’ can be estimated from the intercept. Typical Hall-Williamson plot between Brcosq/l and sinq/l is shown in Figure 2.
2. 00 4. 00 6. 00 8. 00 10. 00 12. 00
0. 30 0. 35 0. 40 0. 45 0. 50 0. 55 0. 60 0. 65
s i n ????
Fig. 2. Plot of Brcosθ/ λ Vs sinθ/ λ for Ag after milling for 12
The lattice strains were determined from the plot of Brcosθ/λ against sinθ/λ following standard procedures [15]. The measured half-widths were corrected for instrumental broadening with reference to a pure strain-free silicon powder. The variation of particle size with milling time is within the limits of experimental errors. This shows that while the milling is enough to create strains, it affect the particle size to a measurable extent. A typical Hall-Williamson plot is shown in in Figure 2.
4 Results and discussion
E. Purushotham /Journal of Engineering Science and Technology Review 6 (1) (2013) 83 -86
85
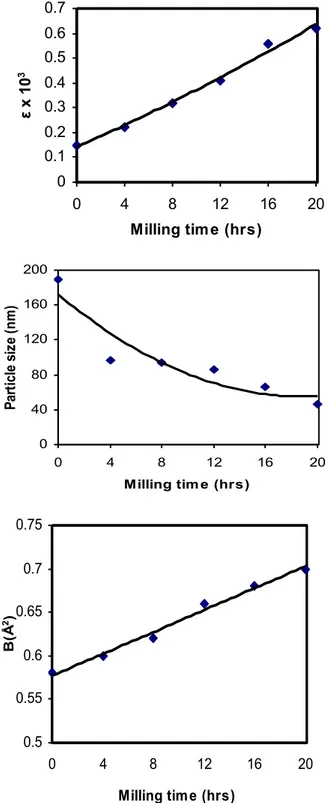
corrections. The repeated milling of the powder sample leads to lattice distortion which gives rise to microstrains in the lattice. These microstrains increase the contribution of static component of Debye-Waller factor. Thus both lattice strain and the observed Debye-Waller factor, which is the sum of static and thermal components, increase with milling time. Thus, whenever Debye-Waller factors are determined from X-ray intensities on powder samples, it is desirable to make an estimate of the lattice strain and if the strain is large, a suitable correction is to be made as done in the present study. The Debye temperature derived from the zero strain value of Debye-Waller factor of Cu is 315K. This value agree well with the values of 315K [3] obtained for Cu from the single crystal X-ray diffraction.
0 0.1 0.2 0.3 0.4 0.5 0.6 0.7
0 4 8 12 16 20
Milling tim e (hrs)
ε
x
1
0
3
0 40 80 120 160 200
0 4 8 12 16 20
Milling tim e (hrs)
Pa
rt
ic
le
s
iz
e
(
n
m
)
0.5 0.55 0.6 0.65 0.7 0.75
0 4 8 12 16 20
Milling tim e (hrs)
B(
Å
2)
0.5 0.55 0.6 0.65 0.7
0 0.2 0.4 0.6
ε x 103
B(
Å
2)
Fig. 3. Milling time Vs lattice strain, Crystallite size and Debye-Waller factor and lattice strain Vs Debye-Waller factor curves for Al, Cu and Ag.
Table 1. Values of lattice strain (ε), crystallite size (t), Debye-Waller factor (B), root mean square amplitudes of vibration <u>, Debye temperature (θM) and energy of vacancy formation (Ef) of strained Al,
Cu and Ag powders.
Metal Milling time ε x 103 t(nm) <u>(Å) B(Å2
) θM(K) Ef(eV)
Cu 0 0.15 189 0.1496 (6) 0.58 (3) 309 (23) 1.66 4 0.22 97 0.1509 (7) 0.60 (4) 306 (31) 1.63 8 0.32 94 0.1535 (4) 0.62 (1) 299 (10) 1.56 12 0.41 86 0.1584 (6) 0.66 (3) 290 (17) 1.46 16 0.56 66 0.1607 (6) 0.68 (3) 285 (17) 1.41 20 0.62 46 0.1631 (5) 0.70 (2) 281 (9) 1.37
Glyde [17] derived the following relation between the energy of vacancy formation (Ef) and the Debye temperature
(θ) of a solid. The relation is
Ef = A(k/ħ) 2
Mθ2a2 (5)
where a is the interatomic spacing, A a constant shown to be equal to 1.17 x 10⁻², M the molecular weight and h and k are the Plank’s and the Boltzmann’s constants, respectively. Glyde recommended the use of X-ray based values in eq. (5). The validity of eq.(5) was verified for a number of fcc, bcc and hcp metals [18]. Therefore, the X-ray Debye temperatures obtained in the present work have been used to study the variation of vacancy formation energy as a function of lattice strain in Cu. The values of vacancy formation energies are also included in Table 1.
5 Conclusion
E. Purushotham /Journal of Engineering Science and Technology Review 6 (1) (2013) 83 -86
86
______________________________
References
.
1. Chipman, D.R., J. Appl. Phys. 31, (1960) 2012.
2. Flinn, P.A. and McManus, G.M. Phys. Rev. 132, (1963) 2158. 3. Jennings, L.D., Chipman, D.R. and Demarco, J.J. Phys. Rev. 135A,
(1964), 1612.
4. Boskovits, J., Roilos, M., Theodossiou, A. and Alexopoulous, K (1958).
5. Inagaki, M. Furuhashi, H.,T Ozeki et al., J Mater Sci. 6, (1971) 1520.
6. M Inagaki, H Furuhashi, T Ozeki and S Naka J.Mater. Sci. 8,
(1973) 312.
7. Sirdeshmukh, D.B., Subhadra, K.G., Hussain, K.A., Gopi Krishn a, N., and Raghavendra Rao. B., Cryst.Res.Technol 28, (1993) 15.
8. Gopi Krishna, N., and Sirdeshmukh., D.B., Indian J Pure & Appl Phys.31, (1993), 198.
9. Chipman, D.R., and Paskin, A., J.Appl. Phys.30, (1959) 1938.
10. Klug, H.P., and Alexander, L.E., (1974). X-ray Diffraction Procedures (John Wiley and Sons, U.S.A.).
11. Cromer, D.T., and Waber, J.T., Acta Cryst. 18, (1965) 104. 12. International Tables for X-ray Crystallography (1968) Vol. III
(Kynoch Press, Birmingham).
13. Cromer, D.T., and Liberman, D., J. Chem. Phys. 53, (1970) 1891. 14. Benson, G.C., and Gill, E.K., (1966) Table of Integral Functions
Related to
15. Debye-Waller factor, National Research Council of Canada, Ottawa.
16. Kaelble, E.F., Handbook of X-rays (New York Mc Graw ill) (1967) 17. Vetelino, J.F., Gaur, S.P., Mitra, S.S., Phys. Rev.B5, (1972) 2360. 18. Glyde, H.R., J.Phys and Chem Solids (G.B) 28, (1967) 2061. 19. Micro-and Macro-Properties of Solids (Springer Series in Material