INTRODUCTION
Semiconductor nanocrystals have been extensively studied by scientists owing to their potential applications in recent years [1, 2]. Zinc sulfi de is an important material owing to numerous applications. The theoretical band gap of this II-VI compound semiconductor is 3.6 eV [3]. Behavior of these materials is different from bulk semiconductors due to increase in particle size, band structure changes, increase in band gap and edges of the band split into discrete energy levels. Divalent substitution such as Mn2+, Cu2+ and Ag2+ with ZnS semiconductors and their photo physical and photochemical properties were investigated [4-9]. The photoluminescence mechanism of ZnS nanocrystals doped with other metal ions is very complex. Smaller particles have higher surface to volume ratio and more surface state therefore contain more accessible carriers for
photoluminescence [10]. This indicates that surface state is very important to the physical properties, especially the optical properties of nanoparticles. Divalent elements like Mn2+ ions doped ZnS nanocrystals can be obtained in many ways such as spray-based method [11], mechanochemical route [12], ultrasonic radiation of solution [13], Gama irradiation method [14], chemical precipitation method [15], organic metallic method [16], polymerization [17], reverse Michelle method [18] and sol-gel method [19]. We preferred chemical method for the preparation of Mn doped ZnS nanocrystals to get the cluster formation. This method is simple, low cost and availability of the equipments.
The aim of this work is to study the effect of Mn2+ ions doping on synthesis, structural, morphological and optical properties of ZnS nanoparticles. Characterization techniques employed to characterize the materials were UV-Visible, XRD and TEM. Crystal structure and average grain size
Structural, morphological and optical properties
of Mn doped ZnS nanocrystals
(Propriedades estrutural, morfológica e óptica
de nanocristais de ZnS dopados com Mn)
V. D. Mote1, Y. Purushotham2, B. N. Dole1
1Advanced Materials Research Laboratory, Department of Physics, Dr. B. A. Marathwada University,
Aurangabad-431004, India
2Centre for Materials for Electronics Technology, IDA Phase-III, Cherlaplly, Hyderabad-500 051, India
Abstract
Mn doped ZnS samples with composition formula Zn1-xMnxS where x = 0, 0.02, 0.05 and 0.10 were prepared by chemical method. Samples characterized for its structural, morphological and optical properties by X-ray diffraction (XRD), transmission electron microscope (TEM), Fourier transform infrared spectroscopy (FTIR) and UV-vis spectrometry. XRD patterns confi rm cubic zinc blend structure with no secondary phases for pure and Mn doped ZnS. Lattice constant value increases slightly with Mn concentration due to the substitution of Mn in ZnO lattice. TEM images show that the particles have spherical in shape with an average particle size 3-4 nm. The chemical species of the grown crystals are identifi ed by FTIR spectra. Optical absorption spectra show decrement in band gap with increasing Mn concentration.
Keywords: ZnS, nanocrystals, particle size, surface morphology, optical properties.
Resumo
Amostras de ZnS dopadas com Mn com formula de composição Zn1-xMnxS, x = 0, 0,02, 0,05 e 0,10 foram preparadas por método químico. As amostras foram caracterizadas pelas propriedades estruturais, morfológicas e óptica por difração de raios X (DRX), microscopia eletrônica de transmissão (MET), espectroscopia de infravermelho com transformada de Fourier (FTIR) e espectrometria UV-vis. Difratogramas de DRX confi rmaram a estrutura cúbica do ZnS puro sem fases secundárias para o ZnS puro e dopado com Mn. O valor do parâmetro de rede aumenta um pouco com a concentração de Mn por causa da substituição de Mn na rede do ZnO. Imagens MET mostram que as partículas tem forma esférica com tamanho médio de partícula 3-4 nm. As espécies químicas dos cristais crescidos foram identifi cadas por FTIR. Os espectros de absorção óptica mostram a diminuição do gap de banda com o aumento da concentração de Mn.
were measured using XRD. TEM used to study particle size and morphology. FTIR used to study quantum size effect in ZnS nanoparticles.
EXPERIMENTAL
Samples with chemical formula Zn1-xMnxS, where x = 0, 0.02, 0.05 and 0.10 were prepared by chemical method using manganese acetate, zinc acetate and sodium sulfi de in aqueous medium without using any other reagent. In this, 20 mL of 1M zinc acetate solution was diluted to 80 mL using distilled water and 20 mL of manganese acetate solution was added drop wise, followed by drop wise addition of 20 mL of 1M sodium sulfi de under vigorous stirring to obtain pH 13.5. A white precipitate was obtained which was separated by centrifugation. The precipitate was washed several times with water and ethanol. The precipitate was then dried under vacuum at 60 oC to get the powder samples.
Mn doped-ZnS nanocrystals were prepared at room temperature by mixing calculated amounts of zinc acetate solution and manganese acetate solution followed by drop wise addition of saturated solution of sodium sulfi de up to pH 13.5. The mixture was vigorously stirred for 2 h. The precipitate was fi ltered from the reaction mixture and washed several times with ethanol to remove all sodium particles. The wet precipitate was then dried. The samples were characterized by X-ray diffraction (PW-3710), transmission electron microscopy (TEM), Fourier transformation infrared spectroscopy (Jasco FTIR-4100) and ultraviolet-visible spectroscopy.
RESULTS AND DISCUSSION
X-ray diffraction study
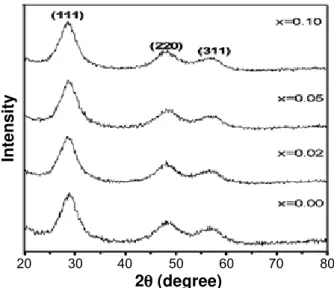
X-ray diffraction patterns of the synthesized ZnS and Mn doped ZnS samples are shown in Fig. 1. All XRD
peaks are matched well with JCPDS 77-2100 and were indexed as cubic zinc blend structure. It can be seen from the fi gure that XRD peaks are broadened with three main peaks corresponding to (111), (220) and (311) planes. Mn doped ZnS samples also showing zinc blend structure of ZnS which confi rms the formation of Mn doped ZnS solid solution and there is no formation of Mn precipitation or secondary phases. It was reported that higher concentration of Mn doping in ZnS results separation of Mn atoms from the ZnS matrix [24].
The lattice constant ‘a’ was calculated using the following relation
1 d2
hkl
= (h )
2 +k
2 + l2
a2 (A)
We observed that ‘a’ slightly increases for Mn doped nanocrystals as shown in Fig. 2. This may be due to the substitution of Mn2+ ions in Zn2+ ions. Since the ionic radius of Mn2+ ions (0.80 A0) is larger than that of Zn2+ ions
Figure 2: Lattice parameter vs Mn content of pure and Mn doped ZnS samples.
[Figura 2: Parâmetro de rede x teor de Mn das amostras de ZnS pura e dopada com Mn.]
Figure 3: Volume of unit cell and X-ray density with Mn content of ZnS samples.
[Figura 3: Volume da célula unitária e densidade de raios X das amostras de ZnS com teor de Mn.]
Figure 1: X-ray diffraction patterns of Mn doped and undoped ZnS samples.
[Figura 1: Difratogramas de raios X das amostras ZnS pura e dopada com Mn.]
20 30 40 50 60 70 80
2θ (degree)
Intensity
Mn content
Latttice parameter (nm)
0.00 0.53735
0.53725
0.53715 0.53730
0.53720
0.53710
0.53705
0.02 0.04 0.06 0.08 0.10
Mn content
V
olume of unit cell (A
0)
3
X-ray density (g/cm
3)
0.00 0.02 0.04 0.06 0.08 0.10 4.12 4.14
4.13 4.15 4.17
4.16 4.18 4.19
154.90 155.15
155.05 155.10
155.00
(0.74 A0). The volume of unit cell was calculated using the lattice parameter ‘a’ and it is found that the unit of volume cell enhances with increasing Mn concentration as shown in Fig. 3. This indicates that Mn2+ ions go to Zn site in the structure due to larger ionic radius. The values of volume of unit cell are tabulated in Table I. X-ray density was calculated using the following relation.
ρx = nM
NAV (B)
where n is number of atoms per unit cell, M is molecular weight of the samples, NA is Avogadro’s number and V is unit cell volume. The values of X-ray density are also tabulated in Table I. X-ray density decreases with increasing Mn concentration. This decrement was attributed to the decrease in molecular weight. Since atomic weight of Mn ion (58.93 amu) is smaller than that of Zn ion (65.37 amu). The plots of unit cell volume and X-ray density with Mn content are shown in Fig. 3.
The average crystallite size of Mn doped ZnS samples was determined by extra broadening of the X-ray diffraction peaks of the samples using the Debye-Scherrer’s formula using following relation
D = Kλ
βhkl Cosθ
(C)
where D is the crystallite size, K is the shape factor (0.9), is the wavelength of Cukα radiation, βhkl is the instrumental corrected integral breadth of the refl ection (in radians) located at 2θ and θ is the angle of refl ection (in degree). It is found that the average crystallite size is in the range of 3-2 nm and values are depicted in Table I. It is observed that the average crystallite size decreases with increasing Mn concentration. It means the Zn2+ ions are replaced by Mn2+ ions in the ZnS matrix. It may be due to the induced growth of the particles and enhancement of surface area to volume ratio in the system.
Morphological studies
It is necessary to know an exact particle size and
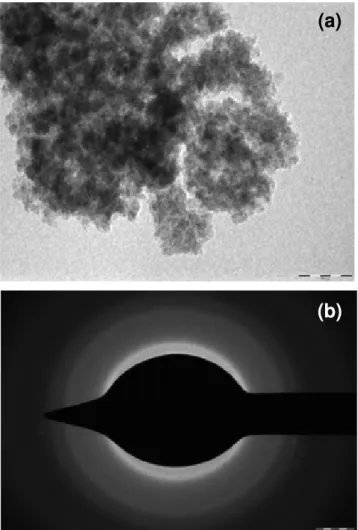
structures of nanomaterials by direct measurement, such as transmission electron microscope (TEM) which can reveal the particle size, shape and orientation of the Mn doped ZnS nanoparticles. Electron diffraction patterns at different regions on the TEM grid were recorded for pure ZnS sample. We did not fi nd any other diffraction rings that cannot be indexed by sphalerite structure. Fig. 4a shows TEM image of pure ZnS sample. TEM image shows that particles are nearly in spherical shape and having average particle size of 3-4 nm for the pure ZnS sample. This value is consistent with the XRD result of pure ZnS sample. Fig. 4(b) shows the corresponding selected area electron diffraction (SAED) pattern. The SAED pattern corresponds to refl ections from three crystal planes which indicate (111), (220) and (311). It is observed that the particles are well separated and evidenced with few agglomerations.
The agglomeration was probably due to the particles in a concentrated sample could end up in association during grid drying in the TEM sample processing protocol [25]. The spherical shape of the particles is also evidenced from
Figure 4: (a) Transmission electron microscope image of ZnS nanocrystals, (b) Selected area electron diffraction (SAED) image of ZnS nanocrystals.
[Figura 4: (a) Imagem de microscopia eletrônica de transmissão de nanocristais de ZnS, (b) Imagem de área selecionada de difração de elétrons (SAED) de nanocristais de ZnS.]
Table I - Lattice constant, crystallite size, volume of unit cell and X-ray density of Mn doped ZnS nanocrystals.
[Tabela I - Constante de rede, tamanho do cristalito, volume da célula unitária e densidade de raios X dos nanocristais de ZnS dopados com Mn.]
Samples a (A) crytallite Size X-ray density
(nm) Volume (g/cm3)
(A)3
0.00 5.3706 02.89 154.91 4.1772 0.02 5.3711 02.65 154.95 4.1671 0.05 5.3725 02.57 155.07 4.1505 0.10 5.3734 02. 50 155.15 4.1261
(a)
the Fig. 4b, which presents magnifi ed view of nanocrystals.
FTIR study
Fig. 5 shows FTIR spectra of pure and Mn doped ZnS samples. The values of IR peaks of all samples are tabulated in Table II. It clearly shows a broad peak at 3400-3600 cm-1
due to O-H stretching has been observed in all samples because of some absorbed moisture.
The samples at room temperature show characteristic peaks at 612, 865, 1004, 1119, and some other associated peaks are shown in Fig. 5. It is observed that the peak at 612 cm-1 is assigned to the ZnS band (i.e. corresponding to sulfi des) for all samples. FTIR spectra of our samples yield the bands which are in good agreement with the reported values [26]. The change is observed in values when Mn content is increased it means that the formation of nanophase in the prepared samples. IR absorption peaks at 900-1500 cm-1 are due to the oxygen stretching and bending frequency. The additional weak bands and shoulders at 2941, 2847, 2353, 1634 and 1409 cm-1 are observed. It may be due to
the microstructure formation of the samples. Bands around 1200 and 1100 cm-1 are due to the characteristics frequency of inorganic ions. Due to low temperature, weak additional bands are observed at 992, 984 and 865 cm-1. These modes indicate the presence of resonance interaction between vibrational modes of sulfi de ions in the crystals [27].
Optical studies
The absorption spectra of pure and Mn doped ZnS samples are shown in Fig. 6. The absorption spectra of Mn doped samples are different than of undoped sample. It is due to effect of doped ions on band structure of the host material. The absorption peaks and edges of the samples vary with changing in the molar concentration of Mn2+ ions. ZnS has good absorption for light in the wave length of 220-350 nm [28]. Semiconductor crystallites in the diameter range of a few nanometers show a three dimensional quantum size effect in their electronic structure. The quantum size effects on the band gap absorption energy can be measured by UV-Vis absorption spectroscopy.
800 400
Figure 5: FTIR spectra of pure and Mn doped ZnS nanocrystals.
[Figura 5: Espectros FTIR de nanocristais de ZnS puro e dopado com Mn.]
40003600 32002800 2400 2000 1600 1200
Wavenumber (cm-1)
T
ransmittance
Table II - Assignment of frequencies of FTIR spectra of Mn doped ZnS nanocrystals.
[Tabela II - Atribuições de freqüências dos espectros FTIR dos nanocristais de ZnS dopados com Mn.]
x=0 (cm-1)
x=0.02 (cm-1)
x=0.05 (cm-1)
x=0.10
(cm-1) Assignment of frequencies
439.60 668.15 913.18 1008.92 1219.97 1350.72 1420.73 1561.77 2350.37 3436.51
404.59 658.88 903.91 1027.45 1228.20 1350.72 1429.99 1552.50 2358.61 3427.25
439.60 668.15 905.68 1027.45 1219.97 1350.72 1429.99 1561.77 2358.61 3506.52
483.87 658.88 921.421 1018.18 1245.71 1350.72 1420.73 1570.00 2358.51 3436.51
Asymmetric bending ZnS stretching
Additional asymmetric stretching Shoulder with asymmetric stretching
Symmetric stretching Weak additional stretching C=O Asymmetric stretching
C=O Symmetric stretching Weak additional bands
O-H stretching
Figure 6: UV-vis spectra of pure and Mn doped ZnS samples.
[Figura 6: Espectros UV-vis das amostras de ZnS pura e dopada com Mn.]
0.9
0.7
0.5
0.3 0.8
0.6
0.4
0.2
0.1
200 400 600 800 1000
Wavelength (nm)
Figure 7: The plots of (ahν)2 vs. photon energy of Mn doped and undoped ZnS samples. [Figura 7: Gráfi co(ahν)2 vs energia dos fótons das amostras de ZnS pura e dopada com Mn.]
Figure 8: Energy band gap vs Mn content of Mn doped and undoped ZnS samples.
[Figura 8: Gap de energia vs teor de Mn das amostras de ZnS pura e dopada com Mn.]
It is well known that the cubic ZnS is a direct gap semiconductor [29]. The relation between the absorption coeffi cient (α) and incident photon energy (h ) allowed direct transition is [30]:
αhv = A(hv - Eg)1/2 (D)
Where A is the constant and Eg is the energy band gap of the material.
The plots of (αhυ)2 versus hυ for the undoped ZnS and Mn doped ZnS nanocrystals are represented in Fig. 7. By extra plotting the straight portion of the graph on hυ axis at α = 0, it is found that the band gap of the undoped and Mn doped ZnS nanoparticles for concentrations 0.00, 0.02, 0.05 and 0.10 to be 3.54, 3.51, 3.45 and 3.38 eV, respectively. These values can be compared with band gap values of 3.38-3.54 eV at room temperature for bulk ZnS [31]. From fi gure, it is noted that the absorption edges slightly shifted towards the lower energy side with increasing Mn upto 10%. The band gap is found to decrease with increasing Mn concentration as shown in Fig. 8. The same shifts of the absorption edge with increasing Mn concentration from 0 to 9 at % at fi xed size of ZnS nanoclusters were reported [32, 33]. But the variation of the band gap with the Mn concentration is the opposite is observed in Mn doped CdS nanocluster [34]. Levy et. al. reported that a minimum energy band gap was observed for 5-8% of Mn concentration CdS samples. These changes of the band gap with Mn concentration are due to exchange 3.5
2.5
1.5
0.5 3.0
2.0
1.0
0.0
1 2 3 4 5 6 7
hv (eV)
α
hv
2 (a.u.)
2.5 2.5
1.5 1.5
0.5 0.5
3.0
3.0
2.0 2.0
1.0 1.0
0.0 0.0
1 2 3 4 5 6 7 1 2 3 4 5 6 7
hv (eV) hv (eV)
α
hv
2 (a.u.)
α
hv
2 (a.u.) 3.5
2.5
1.5
0.5
-0.5 3.0 4.0
2.0
1.0
0.0
1 2 3 4 5 6 7
hv (eV)
α
hv
2 (a.u.)
(a)
(c)
(b)
(d)
0.00 0.02 0.04 0.06 0.08 0.10
Mn content
3.54
3.51
3.48
3.45
3.42
3.39
3.36
interaction in confi ned region.
In our case, the size of ZnS nanoparticles were found to be in the range of 2-4 nm which is same as the exciton Bohr radius (2.1nm) for a cubic ZnS structure. Hence the slight change of band gap may be assigned to weak quantum confi nement effect in ZnS clusters. This small change in the band gap suggests that there is direct energy transfer between the semiconductor-excited states and the 3d levels of Mn2+ ions [35].
CONCLUSIONS
The Mn doped ZnS nanocrystals were synthesized by a chemical method at room temperature. XRD patterns suggest that Mn ions go to Zn sites in the crystals without changing the cubic structure. The lattice parameter slightly increases with increasing Mn concentration. We also observed that the average crystallite size is reduced with increasing Mn concentration; it may be due to a small grain growth in comparison with undoped ZnS nanocrystals. No secondary phases were observed upto 10% of Mn doped ZnS samples. It indicate that the homogenous substitution of Mn ions into the ZnS lattice structure. The TEM image of pure ZnS nanocrystals exhibits an average particle size of about 3-4 nm. The TEM result is in good agreement with results of XRD. FTIR analysis confi rms the formation of ZnS and Mn doped ZnS samples. The UV-Vis measurement shows the reduction in the band gap with increasing Mn content. It may be due to the direct energy transfer between the semiconductor-excited states and the 3d levels of Mn2+ ions.
ACKNOWLEDGEMENT
B. N. Dole would like to thank University Grants Commission, New Delhi, India for fi nancial assistance (Project F-37-563/2009/SR) and Prof. S. S. Shah for his encouragement.
REFERENCES
[1] H. Weller, Angew. Chem. Int. Ed. Engl. 32 (1993) 41-53. [2] A. P. Alivisatos, J. Phys. Chem. 100 (1996) 13226-39. [3] P. Yang, M. Lu, D. Xu, D. Yuan, M. Pan, G. Zhou, Mater. Res. Bull. 36 (2001) 1301-06.
[4] J. Yu, H. Liu, Y. Wang, F.E. Fernandez, W. Jia, J. Lumin. 76 & 77 (1998) 252-55.
[5] R. N. Bhargava, D. Gallagher, T. welker, J. Lumin. 60 & 61 (1994) 275-80.
[6] K. Sooklal, B. S. Cullum, S. M. Angel, C. J. Murphy, J. Phys. Chem. 100 (1996) 4551-55.
[7] G. N. Lvanova, V. A. Kasiyan, N. D. Nedeoglo, D. D. Nedeogle, J. Lumin. 82 (1999) 277-83.
[8] A. A. Khosravi, M. Kundu, L. Jatwa, S. K. Deshpande, U. A. Bhagwat, M. Sastry, S. K. Kulkarni, Appl. Phys. Lett. 67 (1995) 2702-05.
[9] D. Denzler, M. Olschjewski, K. Sattler, Appl. Phys. Lett.
84 (1998) 2841-44.
[10] W. Chen, Z. Wang, Z. Lin, L. Lin, Appl. Phys. Lett. 70 (1997) 1466.
[11] L. Amirav, A. Amirav, E. Lifshitz, J. Phys. Chem. Lett. B 109 (2005) 9857-60.
[12] P. Balaz, E. Boldizarova, E. Godocikova, Briancin, J. Mater. Lett. 57 (2003) 1585-89.
[13] J. F. Xu, H. S. Jiw, Y. W. Tang, Du, Appl. Phys. A 66 (1998) 639-41.
[14] A. H. Souici, N. Keghouche, J. A. Delaire, H. Remita, M. Mostafavi, Chem. Phys. Lett. 422 (2006) 25-29.
[15] H. Yang, P. Hollway, J. Appl. Phys. 93 (2003) 586-93. [16] J. H. Chung, C. S. Ah, D. J. Jang, J. Phys. Chem. B 105 (2001) 4128-32.
[17] I. Yu, I. Tetsukio, M. Seena, J. Phys. Chem. Solids 57 (1996) 373-79.
[18] K. Manzoor, S. R. Vadera, N. Kumar, T. R. N. Kutty, Mater. Chem. Phys. 82 (2003) 718-25.
[19] N. Karan, R. Suchitra, F. Singh, J. Cryst. Growth 268 (2004) 585-89.
[20] S. J. Xu, S. J. Chua, B. Liu, L. M. Gan, C. H. Chew, G. Q. Xu, Appl. Phys. Lett. 73 (1998) 478-81.
[21] M. Konishi, T. Isobe, M. Senna, J. Lumin. 93 (2001) 1-8.
[22] L. X. Cao, J. H. Zhang, S. L. Ren, S. H. Huang, Appl. Phys. Lett. 80 (2002) 4300-03.
[23] M. W. Wang, L. D. Sun, C.H. Liu, C. S. Liao, C. H. Yan, Chin, J. Lumin. 20 (1999) 247.
[24] H. J. Yuan, X. Q. Yan, Z. X. Zhang, D. F. Liu, Z. P. Zhou, L. Cao, J. X. Wang, Y. Gao, L. Song, L. F. Liu, X. W. Zhao, X. Y. Dou, W. Y. Zhou, S. S. Xie, J. Cryst. Growth 271 (2004) 403-08.
[25] I. Chakraborty, S. P. Moulik, J. Nanopart. Res. 7 (2005) 237.
[26] B. S. Rema Devi, R. Raveendran, A. V. Vaidyan, Parama-J. Phys. 68 (2007) 679-87.
[27] S. K. kurian, S. Sebastian, J. Mathew, K. C. George, Ind J. Pure Appl. Phys. 42 (2004) 926-33.
[28] C. Jianfeny, L. Yaling, W. Yuhong, Y. Jimmy, C. Dapeng, Mater. Res. Bull. 39 (2004) 185-94.
[29] S. Sapra, N. Shanthi, D. D. Sarma, Phys. Rev. B 66 (2002) 205202-10.
[30] J. I. Pankove, “Optical Process in Semiconductors”, Prentice-Hall Inc., USA 36 (1971).
[31] B. Y. Geng, X. W. Liu, Q. B. Du, X. W. Wei, L. D. Zhang, Appl. Phys. Lett. 88 (2006) 163104-07.
[32] S. Sarpa, J. Nanda, A. Nanda, A. Anand, S. V. Bhat, D. D. Sarma, J. Nanosci. Nanotech. 3 (2003) 392.
[33] B. Bhattacharlee, D. Ganguli, K. Lakoubovskii, A. Stresmans, S. Chaudhari, Bull. Mat. Sci. 25 (2002) 175-80. [34] L. Levy, J. F. Hochepied, M. P. Pileni, J. Phys. Chem. 100 (1996) 18322-26.
[35] F. J. Brieler, M. Froba, L. Chem, P. J. Klar, W. Heimbrodt, H. A. Krug, V. Nidda, A. Loidl, Chem. Eur. J. 81(2002) 185.