Study of the Matrix Effect on the Plasma Characterization of Heavy Elements
in Soil Sediments using LIBS with a Portable Echelle Spectrometer
Walid Tawfik Y. Mohamed∗,†and Abeer Askar∗
∗
National Inst. of Laser Enhanced Science NILES, Dept. of Environmental Applications, Cairo University, Cairo, Egypt
†Faculty of Education for Girls, Department of Physics, Gurayyat, North of Al-gouf, Kingdom of Saudi Arabia
Corresponding author: Walid Tawfik Y. Mohamed. E-mail: [email protected]
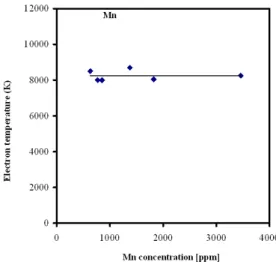
Laser-induced breakdown spectroscopy (LIBS) has been applied to perform a study of the matrix effect on the plasma characterization of soil sediment targets. The plasma is generated by focusing a pulsed Nd: YAG laser on the target in air at atmospheric pressure. The plasma emission spectrum was detected using a portable Echelle spectrometer (Mechelle 7500 — Multichannel Instruments, Stockholm, Sweden) with intensified CCD camera. Spectroscopic analysis of plasma evolution of laser produced plasmas has been characterized in terms of their spectra, and electron temperature. Four heavy elements V, Pb, Mn and Co were determined in the obtained spectra. The LTE and optically thin plasma conditions were verified for the produced plasma. The electron temperature and density were determined using the emission intensity and stark broadening, respectively, of the spectral lines of the heavy elements in the soil sediments. The electron temperature does not change with concentration. For environmental applications, the obtained results showed the capability of the proposed LIBS setup with the portable Mechelle 7500 spectrometer to be applied in-situ for real-time measurements of the variation of the matrix elemental composition of soil sediments by following up only a single element as a marker for the composition of the soil sediment without need of analysis of the other elements.
1 Introduction
The Laser Induced Breakdown Spectroscopy (LIBS) tech-nique has been already applied to the determination of ele-mental concentrations in a wide range of materials in solid, liquid and gaseous phase. Measurements consist of spectral and time resolved analysis of the atomic and ionic emis-sion lines, arising from the plasma generated by an intense laser pulse. In the case of condensed samples, the plasma is produced through laser-induced evaporation of the sample surface layer [1]. The use of laser induced breakdown spect-roscopy (LIBS) in the analysis of soil and soil sediments has been studied in recent years as a technique for in-situ detection of hazardous metals [2–7]. One of the main problems in the use of LIBS is the necessity of making a calibration curve with samples possessing the same matrix composition of the samples to be analyzed. In 1998, Valery Bulatov et al. proposed a method in which the composition of a sample could be determined without the need of calibra-tion curves [8]. However, this method is based on the mea-surement of the emission from all the species present in the sample, a requirement difficult to satisfy when dealing with soil sediments. The physical and chemical properties of the sample can affect the produced plasma composition, a phenomenon known as the matrix effect. The matrix effect can result in the sample being ablated differently from the target sample. The interaction between the laser and the
target in LIBS is influenced significantly by the overall com-position of the target, so that the intensity of the emission lines observed is a function of both the concentration of the elements of interest and the properties of the matrix that contains them. Plasma composition is dependent not only on the composition of the sample, but also on laser parameters, sample surface conditions as well as on thermal and optical properties of the sample. Previously published works studied the matrix effect under different experimental conditions to specify causes and find out the methods of correction [9–14]. The different approaches have been undertaken to discrim-inate between the problems resulting from the fractionation of the ablation and matrix effects. The most convenient ap-proach is to determine elemental abundance by comparing the analyte line intensities with signals obtained from the proper reference standards having a similar matrix composi-tion [15]. But it is not always possible to obtain such calibra-tion curves because there are no available standard samples, or it is impossible to have an internal standard of known concentration [16]. In addition, plasma formation dynamics, sample ablation and associated processes, are highly non-linear and not fully understood and may also play an import-ant rˆole in the matrix effect.
main constituents in samples from different matrices, still remains a difficult task because of the complex laser-sample and laser-plasma interaction mechanisms. As a rule, laser ablation plasma is characterized by complex spatial and tem-poral structures, and one meets a wide range of parameter variation during the plasma existence time.
In this paper we report on the optimized conditions for LIBS to analyze the emission spectrum of soil sediment samples with high resolution using a portable Echelle spec-trometer — Mechelle 7500 — equipped with an ICCD camera. Spectroscopic analysis of plasma evolution of laser produced plasmas has been characterized in terms of their spectra, and electron temperature. Four heavy elements V, Pb, Mn and Co were determined in the obtained spectra. The electron temperature was determined using the emission intensity of the spectral lines of the heavy elements in the soil sediments. The dependence of the electron temperature on the concen-trations of these heavy elements was studied.
The aim of this paper is to prove that the proposed LIBS setup could be used in the on-line environmental applications control. This could be done by following up only a single element as a marker for the composition of the soil sediment without need of analysis of the other elements.
2 Methodology
A typical LIBS experimental setup, described in detail else-where [3, 9, 10, 15], was used throughout the present inves-tigations. Laser induced plasma was produced by focusing 180 mJ of a Q-switched Nd: YAG laser (surelite I, continuum, USA) operating at 1064 nm (pulse duration of 7 ns) on soil sediment samples. An energy meter (Nova 978, Ophir Opt-ronics Ldt., USA) was employed to monitor the shot to shot pulse energy. The laser beam was focused on soil sediment samples by a 10 cm focal length quartz lens to generate the plasma. The focal point was set 5 mm below the surface of the sample in order to generate plasma of 800µm spot dia-meter. This also minimized breakdown above the surface of any particles and aerosols generally present above the sam-ple. A one meter length of used-silica optical fiber (600µm diameter) mounted on a micro xyz-translation stage was used to collect the emission light from the plasma plume and feed it to a portable Echelle spectrometer of a 0.17 m focal length (Mechelle 7500, Multichannel instruments, Sweden).
200–1000 nm displayable in a single spectrum. A gateable, intensified CCD camera, (DiCAM-Pro-12 bit, UV enhanced, 43000 channels, PCO Computer Optics, Germany) coupled to the spectrometer was used for detection of the dispersed light. The overall linear dispersion of the spectrometer cam-era system ranges from 0.006 (at 200 nm) to 0.033 nm/pixel (at 1000 nm). To avoid electronic interference and jitters, the intensifier high voltage was triggered optically. Echelle spectra display, control, processing and analysis were done using both Mechelle software (Multichannel Instruments, Stockholm, Sweden) and GRAMS/32 version 5.1 Spectro-scopic Data Analysis Software (Galactic Industries, Salem, NH, USA).
To improve LIBS precision, spectra from several laser shots have to be averaged in order to reduce statistical error due to laser shot-to-shot fluctuation. We reproduced the mea-surements at four locations on the sample surface in order to avoid problems linked to sample heterogeneity. Fifty laser shots were fired at each location and saved in separated files and the average (average of 250 spectra) was computed and saved to serve as the library spectrum. For each recorded spectrum, the peak intensity, the Lorentzian curve fitting, the full width at half maximum FWHM, and the center wavelength of each line, as well as the background emission continuum were determined. Data treatment preprocessing of the averaged spectra was performed in the Microsoft Win-dows XP environment on a Pentium 4 PC using GRAMS/32, Excel (Microsoft office Excel 2003) and Origin software version 7.0220 (Origin Lab corporation, USA). The averages of peak tables (lists of wavelengths and intensities) of the averaged spectra were roll generated in GRAMS/32 and exported for data evaluation.
Three certified reference samples were purchased from the International Atomic Energy Agency (IAEA). The stand-ard samples were named SL-1, SL-5 and IAEA-SL-7. Another three standard samples have been made by mixing of the IAEA-samples in different ratios. These sam-ples were named Mix A, Mix B, and Mix C. The composition of Mix A, Mix B and Mix C are (37.3% of IAEA-SL-1 +
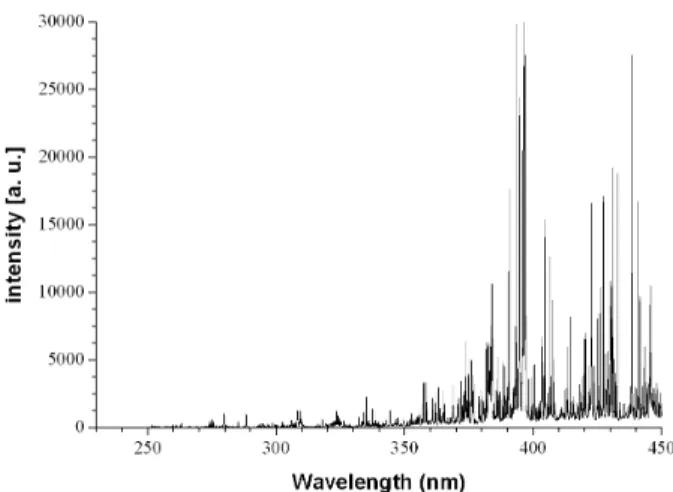
Fig. 1: Typical LIBS spectrum for soil sediment target. The laser energy was 100 mJ at wavelength 1064 nm, plasma emissions are accumulated with delay 2.5µs, and gate width 1µs.
Sample Mn Pb Co V
IAEA-SL-1 3460 37.7 19.8 170
IAEA-SL-5 852 129 14.8 151
IAEA-SL-7 631 60 8.9 66
Mix A 1825 95 16.6 158
Mix B 770 103.2 12.6 119.3
Mix C 1375 54.1 11.7 93.4
Table 1: The elemental concentrations of Mn, Pb, Co and V in the six standard soil sediments (in ppm).
good homogeneity and to simulate the properties of the ori-ginal standard samples. The powder of each of the six stand-ard samples was put into a stainless steel dish (30-mm dia-meter×7-mm deep) to be pressed into a form of tablet at a hydraulic press weight of 20 tons/cm2
to be suitable for handling in LIBS experiments. The elemental concentrations of Mn, Pb, Co and V in the six standard soil sediments are given in Table 1.
3 Results and discussion
3.1 LIBS spectrum
Figure 1 shows a typical plasma emission spectrum for soil sediment sample IAEA-SL-1. This spectrum is the average of 250 single shot spectra recorded at 2.5µs delay time and 1µs gate width.
The panoramic Echelle spectra in the spectral range 230– 450 nm show the UV emission lines. In particular, soil sedi-ment samples, made mostly of inorganic material consti-tuents, give rise to a dense spectrum due to the contribution of heavy atom emissions in the investigated range [6]. Moreover, our observed spectra reflect the wide spectral range and the high resolution of the spectroscopic system used.
Fig. 2: Shows a high resolution spectrum of Mn with concentration of 0.346% in soil sediment sample IAEA-SL-1. Intensities ratios of the manganese triplet at wavelengths: 403.08, 403.31 and 403.45 nm are consistent with the ratios of the statistical weights of their upper level (7:5:3).
3.2 Plasma characterization
In LIBS experiments, after the initial plasma decay and during the entire observation interval, the local thermodyn-amic equilibrium (LTE) conditions are assumed to hold.
On the other hand, optically thin plasma has been con-firmed by checking the intensity ratios of the manganese triplet at wavelengths: 403.08, 403.31 and 403.45 nm which are consistent with the ratios of the statistical weights of their upper level (7:5:3) as shown in Fig. 2 (refer to Table 2). This result indicates that the plasma was optically thin according to a procedure described previously by Simeonsson and Mi-ziolek [20].
For optically thin plasma, the re-absorption effects of plasma emission are negligible, so the emitted spectral line intensityI is a measure of the population of the correspond-ing energy level of this element in the plasma. For the LTE plasma, the population of an excited level can be related to the total densityN(T)of neutral atom or ion of this element by Boltzmann equation as:
I = hc 4πλN(T)
Akigk
U(T) exp
−Ek
KT
, (1)
whereλis the wavelength, Akiis the transition probability,
gk is the statistical weight for the upper level, Ek is the excited level energy,T is the temperature (in LTE all tempe-ratures are assumed to be equal, i.e.Te≈Tion≈Tplasma,K is Boltzmann’s constant,U(T)is the partition function.
The emitted spectral line intensity from a given state of excitation can be used to evaluate the plasma temperature. The lines must be well resolved for accurately evaluating their wavelengthsλ, intensitiesI, and their transition proba-bilitiesAkimust be well known [21].
Reformulating Eqn. 1 gives:
ln I λ
Akigk
=− 1
KT Ek+ ln C F
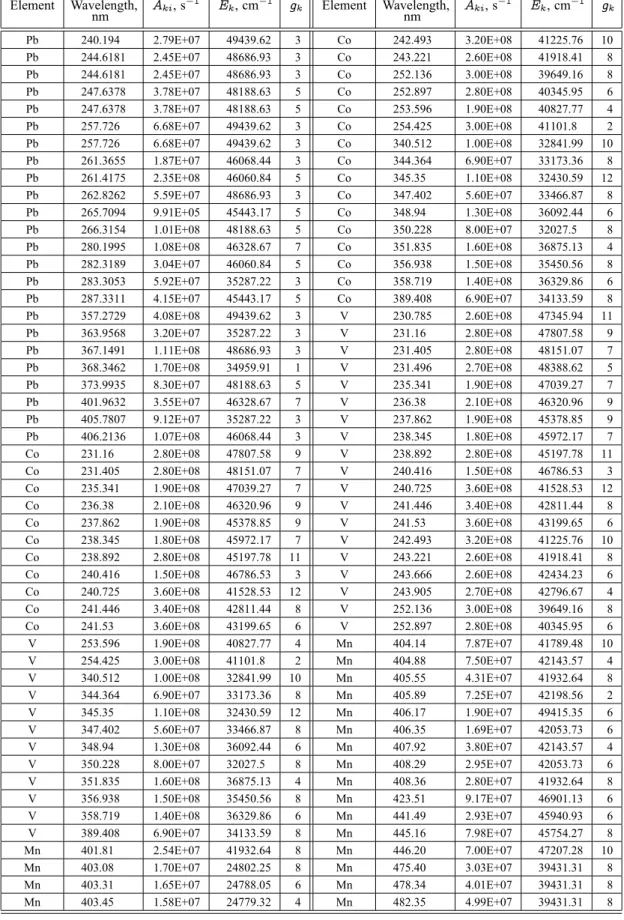
Pb 262.8262 5.59E+07 48686.93 3 Co 347.402 5.60E+07 33466.87 8 Pb 265.7094 9.91E+05 45443.17 5 Co 348.94 1.30E+08 36092.44 6 Pb 266.3154 1.01E+08 48188.63 5 Co 350.228 8.00E+07 32027.5 8 Pb 280.1995 1.08E+08 46328.67 7 Co 351.835 1.60E+08 36875.13 4 Pb 282.3189 3.04E+07 46060.84 5 Co 356.938 1.50E+08 35450.56 8 Pb 283.3053 5.92E+07 35287.22 3 Co 358.719 1.40E+08 36329.86 6 Pb 287.3311 4.15E+07 45443.17 5 Co 389.408 6.90E+07 34133.59 8 Pb 357.2729 4.08E+08 49439.62 3 V 230.785 2.60E+08 47345.94 11 Pb 363.9568 3.20E+07 35287.22 3 V 231.16 2.80E+08 47807.58 9 Pb 367.1491 1.11E+08 48686.93 3 V 231.405 2.80E+08 48151.07 7 Pb 368.3462 1.70E+08 34959.91 1 V 231.496 2.70E+08 48388.62 5 Pb 373.9935 8.30E+07 48188.63 5 V 235.341 1.90E+08 47039.27 7 Pb 401.9632 3.55E+07 46328.67 7 V 236.38 2.10E+08 46320.96 9 Pb 405.7807 9.12E+07 35287.22 3 V 237.862 1.90E+08 45378.85 9 Pb 406.2136 1.07E+08 46068.44 3 V 238.345 1.80E+08 45972.17 7 Co 231.16 2.80E+08 47807.58 9 V 238.892 2.80E+08 45197.78 11 Co 231.405 2.80E+08 48151.07 7 V 240.416 1.50E+08 46786.53 3 Co 235.341 1.90E+08 47039.27 7 V 240.725 3.60E+08 41528.53 12 Co 236.38 2.10E+08 46320.96 9 V 241.446 3.40E+08 42811.44 8 Co 237.862 1.90E+08 45378.85 9 V 241.53 3.60E+08 43199.65 6 Co 238.345 1.80E+08 45972.17 7 V 242.493 3.20E+08 41225.76 10 Co 238.892 2.80E+08 45197.78 11 V 243.221 2.60E+08 41918.41 8 Co 240.416 1.50E+08 46786.53 3 V 243.666 2.60E+08 42434.23 6 Co 240.725 3.60E+08 41528.53 12 V 243.905 2.70E+08 42796.67 4 Co 241.446 3.40E+08 42811.44 8 V 252.136 3.00E+08 39649.16 8 Co 241.53 3.60E+08 43199.65 6 V 252.897 2.80E+08 40345.95 6 V 253.596 1.90E+08 40827.77 4 Mn 404.14 7.87E+07 41789.48 10 V 254.425 3.00E+08 41101.8 2 Mn 404.88 7.50E+07 42143.57 4 V 340.512 1.00E+08 32841.99 10 Mn 405.55 4.31E+07 41932.64 8 V 344.364 6.90E+07 33173.36 8 Mn 405.89 7.25E+07 42198.56 2 V 345.35 1.10E+08 32430.59 12 Mn 406.17 1.90E+07 49415.35 6 V 347.402 5.60E+07 33466.87 8 Mn 406.35 1.69E+07 42053.73 6 V 348.94 1.30E+08 36092.44 6 Mn 407.92 3.80E+07 42143.57 4 V 350.228 8.00E+07 32027.5 8 Mn 408.29 2.95E+07 42053.73 6 V 351.835 1.60E+08 36875.13 4 Mn 408.36 2.80E+07 41932.64 8 V 356.938 1.50E+08 35450.56 8 Mn 423.51 9.17E+07 46901.13 6 V 358.719 1.40E+08 36329.86 6 Mn 441.49 2.93E+07 45940.93 6 V 389.408 6.90E+07 34133.59 8 Mn 445.16 7.98E+07 45754.27 8 Mn 401.81 2.54E+07 41932.64 8 Mn 446.20 7.00E+07 47207.28 10 Mn 403.08 1.70E+07 24802.25 8 Mn 475.40 3.03E+07 39431.31 8 Mn 403.31 1.65E+07 24788.05 6 Mn 478.34 4.01E+07 39431.31 8 Mn 403.45 1.58E+07 24779.32 4 Mn 482.35 4.99E+07 39431.31 8
Fig. 3: Four Boltzmann plots were determined form the emission line intensities of Pb, Mn, V, and Co (shown, respectively, from up to down) observed in the laser-induced plasma of soil sediments. The slope of the plotted curves yields temperatures of for the elements 8526 K, 7700 K, 9693 K, and 6658 K respectively.
Fig. 4: Temperature measured at 2.5µs delay time and 1µs gate width for different concentrations of manganese in soil sediment samples.
where F is an experimental factor and C is the species concentration.
By plotting the left hand side of Eqn. 2 against the excit-ed level energyEk, the plasma temperature can be obtained from the slope of the resulting straight line.
The temperatures were determined form the emission line intensities of Mn, V, Co, and Pb observed in the laser-induced plasma of soil sediments. Figure 3 shows four Boltzmann plots of Eqn. 2, for each of these four trace elements where the data were fitted with the least-squares approximation. The spectral line wavelengths, energies of the upper levels, statistical weights, and transition probabilities used for each element are obtained from Griem [21], NIST [22] and Kurucz [23], and listed in Table 2. The slope of the plotted curves yields temperatures 7700 K, 9693 K, 6658 K, and 8526 K for the elements Mn, V, Co, and Pb respectively. The average value of the plasma temperature is 8000 K for soil sediment, which agrees with the value obtained by V. Lazic et al. [27] under conditions similar to ours. The difference in the plasma temperature of the four elements may be attributed to the difference in the excitation and ionization potentials between these elements.
rumental line broadening∆ instrument:
∆λFWHM= ∆λobserved−∆λinstrument. (3) In our case ∆λinstrument was 0.05 nm (determined by measuring the FWHM of the Hg lines emitted by a standard low pressure Hg lamp).
The width of Stark broadened spectral lines depends on the electron densityNe. The electron densityNe(in cm−3) could be determined from the FWHM of the line from the formula [21]:
Ne≈
∆λ
FWHM
2w
×1016, (4) wherew is the electron impact parameter (stark broadening value). This formula is generally used for calculations of plasma generated from solid targets [7, 27, 28]. Substituting the values of Stark broadening w from [21], [30], [31], and [32] in Eqn. 4, the electron density for soil sediment samples is 3×1017cm−3. The obtained results agree with
those reported by O. Samek [29].
Finally, by knowing the electron density and the plasma temperature we can determine whether the local thermodyn-amic equilibrium (LTE) assumption is valid by applying the criterion given by McWhirter [26].
The lower limit for electron density for which the plasma will be in LTE is:
Ne>1.6×10¹²∆E T1/2, (5)
where ∆E is the largest energy transition for which the condition holds andT is the plasma temperature [20].
In the present case∆E=4.9 eV for Si (one of the main elements in soil sediments) and the electron density lower limit value given by Eqn. 5 is 6×1015cm−3 (see ref. 21).
The experimentally calculated densities are greater than this value, which is consistent with the assumption that the LTE prevails in the plasma.
4 Conclusion
In summary, we have carried out an accurate LIBS setup using a portable commercial Echelle spectrometer equipped with ICCD detector to study soil sediments matrix effects on the plasma characterization. Four trace heavy elements V, Pb, Mn and Co were determined in the obtained spectra. The
applications control. This could be done by following up only single element as markers for the composition of the soil sediment without need of analysis of the other elements.
Acknowledgements
The authors especially acknowledge Prof. M. Abdel Harith and Dr. M. F. Abdel-Sabour for offering the standard soil samples.
References
1. Piepmeier E.H. Laser ablation for atomic spectroscopy analyt-ical application of laser. John Wiley & Sons, N.Y., 1986.
2. Davies B.E. Trace metals in the environment: retrospect and prospect. In: Adriano D.C., Ed. Biogeochemistry of Trace Metals, Advances in Trace Substances Research, Lewis Pub-lishers, Boca Raton, FL, 1992, 1–17.
3. Soliman M., Tawfik W., and Harith M.A. Quantitative ele-mental analysis of agricultural drainage water using laser induced breakdown spectroscopy, First Cairo conference on plasma physics & applications. Cairo, Egypt, Forschungs-zentrum Juelich GmbH, Bilateral Seminars of the International Bureau, v. 34, 2003, 240–243.
4. Wisbrun R., Schechter I., Niessner R., and Shr ¨oder H. Laser induced breakdown spectroscopy for detection of heavy metals in environmental samples.SPIE, 1992, v. 1716 (SPIE, Bellin-gham, Washington), 2–14.
5. Colao F., Barbini R., Fantoni R., Lazic V., Palucci A., Capitelli F., and van der Steen H.J.L. Laser induced breakdown spectroscopy for semi-quantitative elemental analysis in soils and marine sediments.EARSeL Conference Proceeding, Dres-den, Germany, 1999.
6. Barbini R., Colao F., Fantoni R., Palucci A., Ribezzo S., van der Steen H.J.L., and Angelone M. Semi-quantitative time re-solved LIBS measurements.Appl. Phys. B, 1997, v. 65, 101– 107.
9. Sabsabi M., Detalle V., Harith M.A., Tawfik W., and Imam H. Comparative study of two new commercial Echelle spectr-ometers equipped with intensified CCD for analysis of laser-induced breakdown spectroscopy.Applied Optics, 2003, v. 42, No. 30, 6094–6098.
10. Ismail M.A., Imam H., Elhassan A., Youniss W.T., and Harith M.A. LIBS limit of detection and plasma parameters of some elements in two different metallic matrices.J. Anal. At. Spectrom., 2004, v. 19, 1–7.
11. Xu L., Bulatov V., Gridin V., and Schechter I. Absolute analysis of particulate materials by laser-induced breakdown spectroscopy.Anal. Chem., 1997, v. 69, 2103–2108.
12. Goode S.R., Morgan S.L., Hoskins R., and Oxsher A. Identi-fying alloys by laser-induced breakdown spectroscopy with a time-resolved high resolution echelle spectrometer.J. Anal. At. Spectrom., 2000, v. 15, 1133–1138.
13. Eppler A.S., Cremers D.A., Hickmott D.D., Ferris M.J., and Koskelo A.C. Matrix effects in the detection of Pb and Ba in soils using laser-induced breakdown spectroscopy. Appl. Spectrosc., 1996, v. 50, 1175–1181.
14. Quentmeier A., Sdorra W., and Niemax K. Internal standardiza-tion in laser induced fluorescencs spectrometry of microplasms produced by laser ablation of solid samples.Spectrochimica Acta B, 1990, v. 45, No. 6, 5371–5379.
15. Tawfik W. Quantitative elemental analysis of seawater by laser induced breakdown spectroscopy.Intern. J. of Pure and Applied Physics, 2006, v. 2, No. 1, 11–21.
16. Ciucci A., Corsi M., Palleschi V., Rastelli S., Salvetti A., and Tognoni E. A new procedure for quantitative elemental analyses by laser induced plasma spectroscopy. Applied Spectroscopy, 1999, v. 53, 960–964.
17. Bulajic D., Corsi M., Cristoforetti G., Legnaioli S., Palleschi V., Solvetti A., and Rognoni E. A procedure for correcting self-absorption in calibration-free laser induced breakdown spectroscopy.Spectrochim. Acta B, 2002, v. 57, 339–353. 18. Corsi M., Palleschi V., Salvetti A., and Tognoni E. Making
LIBS quantitative: a critical review of the current approaches to the problem.Res. Adv. Appl. Spectrosc., 2000, v. 1, 41–47. 19. Olesik J.W. Echelle grating spectrometers for inductively
coupled plasma-optical emission spectrometry. Spectroscopy, 1999, v. 14, No. 10, 27–30.
20. Simeonsson J.B. and Miziolek A.W. Time-resolved emission, studies of ArF laser-produced micro plasmas.Appl. Opt., 1993, v. 32, 939–947.
21. Griem H.R. Plasma spectroscopy. McGraw-Hill, N.Y., 1964.
22. NIST National Institute of Standards and Technology, USA. Electronic database, http://physics.nist.gov/PhysRefData/ASD/ lines_form.html.
23. Kurucz Atomic Line Database, http://www.cfa.harvard.edu/ amdata/ampdata/kurucz23/sekur.html.
24. Lida Y. Effects of atmosphere on laser vaporization and exci-tation processes of solid samples.Spectrochim. Acta B, 1990, v. 45, 1353–1367.
25. Nemet B. and Kozma L. Time-resolved optical emission spectrometry of Q-switched Nd: YAG laser-induced plasmas
from copper targets in air at atmospheric pressure. Spectro-chim. Acta B, v. 50, 1869–1888.
26. Kyuseok Song, Hyungki Cha, Jongmin Lee, and Yong Lee. Investigation of the line-broadening mechanism for laser-induced copper plasma by time-resolved laser-laser-induced break-down spectroscopy.Microchemical J., 1999, v. 63, 53–60. 27. Lazic V., Colao F., Barbini R., Fantoni R., and Palucci A.
Self-absorption model in quantitative laser induced breakdown spectroscopy measurements on soils and sediments. Spectro-chimica Acta B, 2001, v. 56, 807–820.
28. Sabsabi M. and Cielo P. Quantitative analysis of aluminum alloys by laser-induced breakdown spectroscopy and plasma characterization. Applied Spectroscopy, 1995, v. 49, No. 4, 499–507.
29. Samek O., Beddows D.C.S., Telle H.H., Kaiser J., Liska M., Caceres J.O., and Gonzales Urena A. Quantitative laser-induced breakdown spectroscopy analysis of calcified tissue samples.Spectrochimica Acta B, 2001, v. 56, 865–875. 30. Tankosic D., Popovic L.C., and Dimitrijevic M.S. The
electron-impact broadening parameters for Co III spectral lines. Astro-nomy and Astrophysics, 2003, v. 399, 795–797.
31. Popovic L.C. and Dimitrijevic M.S. Tables of the electron impact broadening parameters: Mn II, Mn III, Ga III, Ge III and Ge Iv Lines.Bull. Astron. Belgrade, 1997, No. 156, 173– 178.