©Revista Brasileira de Fisioterapia
IMPORTANCE AND CLARIFICATION OF MEASUREMENT PROPERTIES IN
REHABILITATION
G
ADOTTIIC, V
IEIRAER, M
AGEEDJ
Faculty of Rehabilitation Medicine, University of Alberta, Canada
Correpondence to: Inae C. Gadotti or Edgar Ramos Vieira, Faculty of Rehabilitation Medicine, University of Alberta, 3-48 Corbett Hall (mailbox), Edmonton, Alberta, Canada T6G 2G4, e-mail: [email protected]
Received: 27/01/2006 – Accepted: 07/03/2006
ABSTRACT
Objective: The purpose of this paper was to critically review the concepts and types of measurement reliability, validity, and responsiveness, and to discuss their implications for rehabilitation research and high-quality clinical practice. Method:A critical literature review considering the strengths, limitations, and appropriate applications of measurement properties in rehabilitation was conducted. Results and Discussion: Measurement quality is assessed using criteria such as reliability, validity, and respon-siveness. Many published studies do not report these measurement properties, which are related, sometimes overlapping, and are frequently confused. This review paper clarifies the meanings of the concepts and types of reliability, validity, and respon-siveness. It gives examples that are relevant for the field of rehabilitation. It discusses how the measurement properties interact with each other and influence the size of the effect and the power of studies. Conclusion: Measurements are essential in reha-bilitation research and clinical evaluation. Measurement properties should be reported to allow readers to evaluate the quality of the results presented. The clarification of measurement properties provided in this paper may contribute towards standardizing definitions and improving the quality of rehabilitation research and clinical practice.
Key words: measurements, reliability, validity, responsiveness, study power.
RESUMO
Importância e Esclarecimento das Propriedades de Medida em Reabilitação
Objetivo:O objetivo do presente artigo foi revisar criticamente os conceitos e tipos de confiabilidade, validade e responsividade de medidas, e discutir suas implicações para a pesquisa em reabilitação e para a prática clínica de qualidade. Método:Uma revisão crítica da literatura foi realizada considerando as vantagens, as limitações e o uso adequado das propriedades de medida em reabilitação. Resultados e Discussão: A qualidade das medidas é avaliada por critérios tais como confiabilidade, validade e responsividade. Muitos estudos publicados não apresentam estas propriedades de medida as quais estão relacionadas e algumas vezes sobrepõe-se sendo freqüentemente confundidas. Este artigo de revisão esclareceu os conceitos e tipos de confiabilidade, validade e responsividade. Exemplos relevantes para a área de reabilitação foram apresentados. Discutiu-se como as propriedades de medida interagem entre si e influenciam o tamanho do efeito e o poder dos estudos. Conclusões: Medidas são essenciais na pesquisa em reabilitação e na avaliação clínica. As propriedades de medida devem ser apresentadas para permitir que o leitor possa avaliar a qualidade dos resultados apresentados. Os esclarecimentos das propriedades de medida apresentados neste artigo podem contribuir para a padronização das definições e para a melhoria da qualidade da pesquisa em reabilitação e da prática clínica.
INTRODUCTION
With the increasing awareness of the importance of evidence based practice, researchers and clinicians are interested on objective evaluations of the value and effectiveness of rehabilitation assessment and treatment techniques. These objective evaluations can only be performed by accurately measuring research results and/or treatment outcomes. Thus, meaningful measurement has become an essential part of the rehabilitation process. Measurement is the act or process that allows quantitative comparison of results. However, the usefulness of measurements in clinical research and in the decision making process depends on the extent to which one can rely on the data as accurate and meaningful indicator of behavior, attribute, or phenomena1.
The quality of a measurement is often judged by such criteria as reliability, validity, and responsiveness. Measurement validity, reliability, and responsiveness are important characteristics that should be considered when reading and/ or writing a paper, but often, they are not reported in rehabilitation studies. These measurement characteristics are related to each other and sometimes overlap. In addition, authors frequently disagree on their definitions and sub-classifications. The terms are frequently confused, often used generally (neglecting the sub-classifications) or interchangeably, and sometimes they are used inappropriately or incorrectly. Thus, a review and clarification of the concepts is important.
Ideally, any measurement should be reliable, valid, responsive, practical, and easy to obtain. Thus, a gold standard measurement should fulfill several requirements in order to be justifiable and clinically useful. The degree of reliability, validity, and responsiveness necessary for each study (experimental or clinical), the applicability of the intended instrument in each setting, as well as the purposes of the research or clinical assessment should be of concern to both rehabilitation researchers and clinicians in order to choose the most appropriate measurement in specific situations. Thus, the characteristics of a measurement, along with the objectives of measuring the event in question, should guide the decision concerning which measurements proprieties or its types, are the most important for a specific study2,3.
The purpose of this paper was to critically review the concepts and types of measurement reliability, validity, and responsiveness, and to discuss the implications of their inclusion in studies for high quality rehabilitation research and clinical practice. It is hoped this paper will contribute to improve the quality of measurements which are fundamental for good evidence based practice. Examples were used to facilitate comprehension of the measurements properties and their sub-classifications. The Lachman’s test was used in most of the examples to standardize the comparisons. This test was chosen due to the fact that it
has been frequently studied, it is used clinically in rehabilitation, and its outcomes are important to the patient. The Lachman’s test was developed to assess anterior knee instability resulting from injury to the anterior cruciate ligament4. The test
evaluates anterior displacement of the tibia in relation to the femur. Injuries to the anterior cruciate ligament may cause progressive dysfunction leading to rotatory instability, meniscal tears, articular cartilage degeneration, and possible arthritis5.
MEASUREMENT RELIABILITY
Reliability is defined as the degree to which a measure is free of random error (measurement mistakes by chance)1.
It is quantified by the degree to which measurements are consistent (constant/stable) and reproducible (repeatable)6.
For example, the measurements performed, before and after a treatment, need to be reliable in order to show any differences pre and post treatment. In this case, if there were no changes (the treatment had no effect) the measurements would be the same. If the reliability of the measurements is not reported in a study, the consistency of the measurements performed may be questionable and consequently, the results of the study may also be questioned because differences found (or the lack of it) in the study could have been caused by random measurement errors and not real changes (or the absence of it) in the variable been evaluated. Measurements that are composed of the true value of the variable being assessed along with measurement error are not reliable7, unless
one knows what the measurement error is and corrects it. Thus, reliability is an essential characteristic of a meaningful measurement because often it is not possible to distinguish between the true value and the amount of measurement error8.
The statistical analysis of measurement reliability is frequently performed using the Pearson correlation coefficient and the intraclass correlation coefficient (ICC). Correlation values range from -1.0 to 1.0. There is no consensus for cut-point values, but it is usually agreed that the values should be greater than 0.75 to indicate good reliability and those below 0.75 indicate poor to moderate reliability1. Another
form of statistically testing reliability is the non-parametric Kappa test, which is a measure of rater agreement on a discrete outcome (nominal scale of measurement) such as “yes” / “no” for classifying treatment effect, for example. The Kappa test results range from 0.0 to 1.0. Kappa values between 0.61 and 0.80 are considered as demonstrating “substantial” reliability and values greater than 0.80 are considered as demonstrating “almost perfect agreement”9.
capabilities due to pain, fear, and psychosocial issues)10. The
different types of reliability are presented and exemplified on the following sub-sections.
Intra-Tester Reliability
Intra-tester reliability, or intra-rater reliability, is related to the repeatability of measurements taken by the same tester at different times (stability over-time). It demonstrates the consistency of the tester to measure the same “thing” repeatedly2,8. The subject, the performance level (see
intra-subject reliability), and the instrument remain the same. For example, the intra-tester reliability of the Lachman’s test was assessed on 32 subjects with knee problems11. Each subject
was assessed two times. The intra-tester reliability (Kappa test) was 0.51. The Kappa value should be at least 0.61 to be considered reliable. Therefore, Lachman’s test was found to have low intra-tester reliability in this study.
Inter-Tester Reliability
Inter-tester reliability, or inter-rater reliability, evaluates the reproducibility of measurements taken by different testers. It is used to detect whether the recorded values change when different testers measure the same “thing”1. As in the case
of intra-tester reliability, the tester is evaluated as a possible source of bias and error, but in the case of inter-tester reliability, possible differences between testers measuring the same thing are assessed. For example, the inter-tester reliability of the Lachman’s test was also evaluated by Cooperman et al.11. Measures of four testers were compared.
They found Kappa values equal or less than 0.42 (low inter-tester reliability). One of the justifications of the author for the low inter-tester reliability was that the method of administration of the Lachman’s test was not standardized in their study.
Intra-Subject Reliability
Intra-subject reliability involves the reproducibility of the subjects’ performance. It compares the measures of the same subject taken at two or more times when the same tester performs the measures. In this case, the intra-tester reliability must be high so that any possible variations in the measurements can be attributed to the subject’s performance variation10. Low intra-tester reliability (<0.75) can be a
confounder for the intra-subject reliability assessment and the reverse is also true. Thus, high intra-tester reliability is a pre-requisite for testing intra-subject reliability and vice-versa. For example, a possible explanation for the low intra-tester reliability found for the Lachman’s test by Cooperman et al.11 is a low intra-subject reliability. The subjects may have
been more relaxed or in less pain in one trial than on the other. Consequently different levels of muscular activity may have occurred around their knee joints during one of the tests affecting the results.
Instrument Reliability
Instrument reliability, or test-retest reliability, evaluates the ability of the measuring instrument or test (e.g. device, tool, scale, questionnaire, or interview protocol) to give the same consistent measurements or results. It is tested by taking repeated measures of the same “thing” using the same instrument or test10. Low intra-tester reliability can be a
confounder for the instrument reliability assessment. Thus, high intra-tester reliability is a pre-requisite to assess the instrument reliability and vice-versa. For example, Johnson et al.12 evaluated the instrument reliability of the Lachman’s
test. The authors controlled the intra-tester reliability by repeating the Lachman’s test measurements at least 3 times or until reaching equal values within the testing session. Two sessions were performed in different days and the results were compared. The differences between the measurement sessions were not significant (p=0.07). For this reason, the authors considered the instrument (Lachman’s test) reliability to be satisfactory. Many other studies do not report or consider the intra-tester reliability when assessing the instrument reliability making it impossible to separate the two. In addition to high intra-tester reliability, high intra-subject reliability is needed to test the instrument reliability with no confounders. In other words, if the instrument reliability is the ability of the instrument to replicate its own measures, the consistency of the subject and tester must be ensured.
Internal Consistency
Internal consistency reflects the degree to which different items or set of questions in a test, scale, questionnaire, or interview protocol are associated to each other. Such instruments are ideally composed of questions or items that measure particular parts or attributes of a greater question. The most common approach to testing the internal consistency of questionnaires and interview protocols involves the calculation of the correlation between different items of the instrument1. In this case, high internal consistency depends
on good correlation (r> 0.75) among the items of the instrument1. For example, the internal consistency of the
International Knee Documentation Committee Questionnaire to assess knee function was tested byIrrgang et al.13. The
results showed that the questionnaire had high internal consistency; meaning the items were highly correlated to each other (r= 0.92).
Parallel Reliability
Parallel reliability, or equivalence reliability, is determined by comparing the values or results taken by different instruments or tests at the same time. It evaluates whether measurements or results from different devices or tests are similar or the same2,8. Thus, parallel reliability is used when
be highly correlated or not differ significantly when the same variable is assessed at the same time. It is important to note that for the parallel reliability analysis, the referential tool needs to have been previously tested and reliable. For example, the parallel reliability of the measures of a new device (Rolimeter) to test anterior knee instability and of the Lachman’s test measures was assessed using the KT-1000 arthrometer measures as reference14. Thirty healthy subjects and 30 patients
with anterior knee joint instability participated in the study. No significant differences between the measures of the Rolimeter and of the KT-1000 arthrometer were found, but significant differences were found between the Lachman’s test measures and the KT-1000 arthrometer measures (p<0.05). Therefore, since the KT-1000 was considered the reference device, the Rolimeter device showed high parallel reliability, while the Lachman’s test measures presented low parallel reliability. In other words, given that the measures from the KT-1000 were considered as reference and the measures of the Rolimeter agreed with them, the Rolimeter measures demonstrated high parallel reliability. On the other hand, since the measures of the Lachman’s test did not agree with the KT-1000 ones, the former presented low parallel reliability.
Overall, the inter-tester and the parallel reliability tend to be respectively lower than the intra-tester and the instrument reliability because the former involve measurements of different raters or different devices which are susceptible to grater variation. Confounders, such as increased muscle contraction during the Lachman’s test, for example, could affect most of the reliability measures, such as instrument vs. subject reliability, for example, and should be discussed in the studies.
MEASUREMENT VALIDITY
Validity is a quality that is attributed to those measurements that quantify what they are supposed to and that provide a true depiction of what is being measured2,10,15.
In other words, does the instrument truly measure what it says it does? For example, the Lachman’s test is supposed to measure anterior knee joint instability. Thus, it needs to represent anterior knee stability and nothing else. If the validity of the Lachman’s test (or any other measurement) is not tested, the statements made from the results are questionable. When a measurement is valid, the inferences made from the results are appropriate. In other words, a valid measure allows one to rely on the study (test) results and interpretations when making clinical decisions. Therefore, validity deals with accuracy (correctness), with the ability to make inferences (conclusions reached on the basis of evidence), and also with the presence of no systematic errors (lack of consistent measurement mistakes)2. A systematic error of 15%, for
example, occurs when the measurements are consistently 15% lower than the actual value.
The Pearson correlation and ICC tests are statistical methods often used to analyse the validity of measurements. The difference between Pearson and ICC is that the latter not only tests the correlation between variables, but also the agreement between them. If the Pearson correlation is used to assess the validity of a measurement, then the regression equation that the Pearson correlation coefficient relates to needs to be evaluated to assess possible systematic errors. ANOVA and T-tests may also be used to test if there are significant differences between the variables. If there are significant differences between the variables under study, the measurements are not valid. ICC, T-test, and ANOVA should only be used when the units (e.g. cm, degrees, kg) of the variables under study are the same or are normalized. Meaning that the numbers need to be directly comparable.
Face Validity
Face validity, the lowest level of validity, is related to the intuitive “feeling” that a measurement seems to be valid15.
The evaluator accepts the assumption that the measurement is valid at “face value”. It offers no evidence on which to base the assumption. For example, without doing any analysis of the test, the measurement of the knee instability obtained using the Lachman’s test seem to be valid (face validity).
Construct Validity
Construct validity is similar to face validity, but it includes a theoretical framework and reasoning to support that the measurement is valid. Construct validity is divided into convergent validity and discriminate validity:
Convergent validity
Supports those measurements that are believed to reflect the same variables that yield similar results and are comparable. For example, since the anterior drawer test, the Lachman test, and the pivot shift test are three of the most commonly applied tests to determine an anterior cruciate ligament injury16, their results are expected to be very similar
if not the same. Discriminate validity
Indicates that measurements that are supposed to assess different characteristics yield different results and are not comparable3. Thus, discriminative validity depends on the
fact that measurements that lack a relationship should not be related. For example, the Lachman’s test is used to determine anterior cruciate ligament injuries while the posterior drawer test is used to determine posterior cruciate ligament injuries17. Therefore, if a subject has an anterior cruciate
ligament injury but the posterior cruciate ligament is not injured, the Lachman’s test should be positive, but the posterior drawer test should be negative.
Content Validity
deals with the scope of the evaluation method and with how well the information gathered fully reflects the variable under study15. An example of a question that deals with content
validity is “Do the questions in this independence for daily activities’ assessment questionnaire fully cover the problems that a disable person will face in his/hers daily life activities?” In this case, the measurements of pain included in the questionnaire (for example) will have a higher “content validity” if the questionnaire includes an assessment of different characteristics of pain such as location, type, duration, and intensity3.
Criterion-Related Validity
This type of validity can be determined by comparing a measurement with a particular factor or criterion, and it can be divided into predictive, concurrent, and prescriptive validity:
Predictive validity
Can be assessed by determining whether the predictions originating from the measurements come true. In this case, the outcomes act as the criterion2. The predictive value of
a positive test is the number of true positives divided by the total number of positive responses (true and false positives). The predictive value of a negative test is the number of true negatives divided by the total number of negatives responses (true and false negatives). For example, the predictive validity of the Lachman’s test was evaluated by Cooperman et al.11.
In this study, the predictive value of a positive Lachman’s test was defined as the likelihood that a subject with a positive test had an injured anterior cruciate ligament. The predictive value of a negative test was defined as the likelihood that a subject with a negative Lachman’s test did not to have an injured anterior cruciate ligament. The authors found 47% predictive value for a positive test, and 70% predicted value for a negative test. This means that in less that half of the cases when the Lachman’s test was positive the subjects had an injured anterior cruciate ligament, while in 7 out of 10 cases with negative Lachman’s test the ligament was not injured. Concurrent validity
Evaluates whether measurements taken using different instruments agree with each other15. It is used to test whether
a new instrument is interchangeable with an established “gold standard”10. Concurrent validity and parallel reliability are
similar. The difference is that concurrent validity requires the reference measurements to come from a valid instrument, while parallel reliability only requires reliable measurements from the criterion instrument8. Thus, reliability is a
pre-requisite for validity. For example, the concurrent validity of the Lachman’s test can be tested using the arthroscopy examination as a reference to evaluate anterior cruciate ligament injury because this examination is considered the valid gold standard, while the parallel reliability of this the Lachman’s test can be tested using the Rolimeter because this instrument was shown to have high parallel reliability14.
Prescriptive validity
Is related to how appropriate it is to use a measurement to recommend a treatment15. It is determined by the positive
or negative outcome of a prescribed treatment2,3. For example,
the Lachman’s test was performed immediately before and 24 months after anterior cruciate ligament reconstruction in subjects with acute or chronic injury to the anterior cruciate ligament confirmed by magnetic resonance imaging and arthroscopy examination18. Before ligament reconstruction,
72% of the subjects had a moderate or severe Lachman’s test (n=128). Two years after the reconstruction, no patient had a moderate or severe Lachman’s test. Thus, a moderate or severe Lachman’s test seems to have high prescriptive validity for success of reconstruction.
MEASUREMENT VALIDITY VS. STUDY VALIDITY
In addition to “measurement” validity discussed in the previous section, there is another concept called “study” validity that is related to the study in general. Study validity refers to the internal and external validity of the study. The external validity of a study is related to the extent to which the results of a study can be generalized outside the experimental situation. In other words, how much the research findings and conclusions of the study on a given sample are applicable to a larger population. On the other hand, internal validity of a study refers to the degree to which the relationship between the independent and dependent variables are free from the effects of extraneous factors and/or confounders3.
Internal and external validity are related to the study itself and not specifically to the validity of the measurements taken.
INSTRUMENT RESPONSIVENESS
Instrument responsiveness is the ability of the instrument, device, tool, test, or scale to accurately detect meaningful changes19. The measurements of an instrument used for clinical
evaluation needs to identify clinically significant differences between and within patients over time20. For example, the
Lachman’s test must detect meaningful changes in knee stability before and after treatment (i.e. ligament reconstruc-tion). The measurements should show changes in the variable being assessed, but they should not be influenced by changes in other variables if the one under study remains stable (does not change)21. Instrument responsiveness includes the concepts
of sensitivity and specificity.
Sensitivity
subjects with acute or chronic injury is a measure of its sensitivity18. The Lachman’s test was performed in subject
before and after anterior cruciate ligament reconstruction; no patient presented moderate or severe Lachman’s test after the reconstruction, while 72% of the patients had moderate or severe Lachman’s test before the reconstruction. Therefore, the measurements using Lachman’s test is considered as having sensitivity because it was able to detect meaningful changes after treatment.
Specificity
The stability or ability of an instrument measure not to change when no changes in the variable under study occur is defined as the instrument’s specificity. Note that changes to other variables may happen, but if the variable of interest remains stable, the measurement taken should not change (specificity). Thus, specificity is related to the actual testing of the discriminate validity of a measure (see construct validity). In other words, specificity evaluates if the variable under study is not influenced by changes in other variables. It can be considered as the actual analysis of the discriminate validity (see construct validity). For example, the Lachman’s test specificity can be analyzed by performing the test in subjects with non-injured anterior cruciate ligament but with injured posterior cruciate ligament. The tests’ results would have to be negative because there would be no anterior cruciate ligament injury and the test is supposed to detect injuries to this ligament and not injuries to the posterior cruciate ligament17.
Sensitivity and specificity of diagnostic tests
In studies involving a diagnostic test, such as the Lachman’s test, the assessment of the instrument’s sensitivity corresponds to the probability that the measures will detect a positive test among patients with disease or injury (true positive test). When a test incorrectly identifies problem as positive or negative, this is referred to as a false positive or false negative respectively. The sensitivity of a diagnostic test is calculated as true positive tests divided by true positives plus false negatives3. If the test detects several positive tests
in subjects without the dysfunction, the false positives increase and consequently, the credibility of the test decreases and it may not be useful for what it is trying to measure. For example, when testing for knee instability using the Lachman’s test, the sensitivity is represented by the ability of the test to detect positive results (abnormal laxity in the anterior cruciate ligament) in subjects who have the abnormality. Kim and Kim5 evaluated the sensitivity of diagnostic tests for
injuries of anterior cruciate ligament. The tests evaluated were the anterior drawer test, the Lachman’s test, and the pivot shift test. One-hundred forty-seven patients with an injured anterior cruciate ligament (confirmed by arthroscopy) were tested under anesthesia before surgery. The anterior drawer, Lachman, and pivot shift tests were positive, respectively,
on approximately 80%, 99%, and 90% of the sample. Thus, the Lachman’s test was the most sensitive diagnostic test with only 1% false negatives.The false negatives in the Lachman’s test (n = 2) were explained by arthroscopically confirmed combination of firm reattachment of the injured anterior cruciate ligament to the posterior cruciate ligament and bucket handle tear of the medial meniscus increasing the anterior stability of the knee5. It is important to know
that the sensitivity of the tests is decreased when the subjects are not under anesthesia, due to pain (hamstring muscle contraction/spasm). However, in the Donaldson et al.22 study,
these factors did not significantly affect the results of the Lachman’s test. They found positive Lachman’s tests on 100% and 99% of the sample, respectively with and without anesthesia. On the other hand, the authors found positive pivot shift tests on 98% and 35% of the sample, respectively with and without anesthesia22. This means that the Lachman’s
test was robust to overcome possible confounders presented by muscle contraction while the pivot shift test was not.
Instrument specificity is evaluated by the probability of a negative test among patients without disease or injury (true negative test). The specificity of a diagnostic test can be calculated as true negative tests divided by true negatives plus false positives3. For example, when testing for knee
instability using the Lachman’s test, the specificity is represented by the ability of the test to detect negative results (normal laxity) in subjects who are normal. Katz and Fingeroth23 found that the specificity of the Lachman, anterior
drawer sign, and pivot shift tests were higher than 95%. When a study evaluates instrument responsiveness in a sample of subjects with a disease or dysfunction, only sensitivity can be tested because only false negatives can be found. Without including normal subjects (without the disease or dysfunction), it is impossible to analyze if the test has false positives. Both sensitivity and specificity of a test need to be known because a test should have low frequency of both false positives and false negatives in order to be useful in the decision making process.
INTERACTIONS BETWEEN MEASUREMENT PROPRIETIES
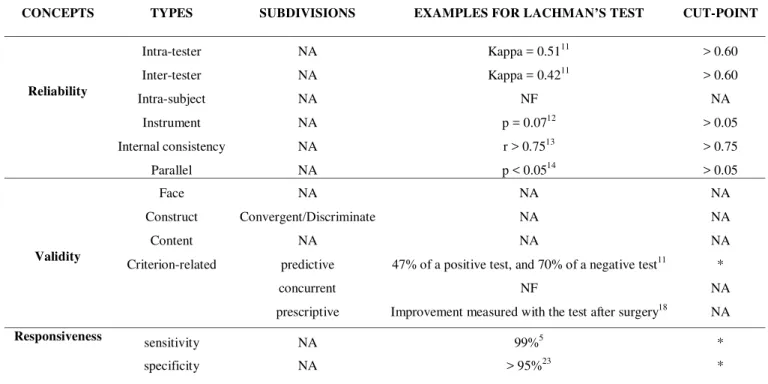
The measurement properties can be presented and tested separately; however, they are inter-related and affect each other. Table 1 presents the different measurements properties and examples for the Lachman’s test. Selected interactions between measurements properties are presented in the following sections.
Reliability and Validity
Reliability is a pre-requisite for validity2. A measure can
be reliable but not valid10,15, however, a measurement cannot
be valid if it is not reliable19. A measurement can only be
error (reliability). Consistent and reproducible measurements do not indicate that the variable of interest is in fact being measured. For example, a questionnaire can have internal consistency (homogeneity among items), but not content validity (the items do not reflect the variable under study). High reliability (low random errors) along with low systematic error results in validity (assuming that the measurement in fact reflects what it is supposed to measure)8,10. It is important
to note that the measurement properties can be tested separately, but they depend on each other to provide useful measures.
Validity and Responsiveness
A measure that is valid at one point in time should also be valid at a different point in time. Consequently, in order to provide valid measurement, an instrument should be responsive to changes over time19. Thus, a valid measure needs
to be responsive (and have high reliability as discussed before). However, some measures can be valid only at one point in time. For example, the concurrent validity of the Lachman’s test can be tested in normal subjects using arthroscopy. The measures may be responsive and valid, but they may be different if a second Lachman’s test was performed. The second measure may be different because the knee stability has changed or was affected by muscle contraction/spasm
and the measurements captured the change or confounding muscle stabilization.
According to Portney and Watkins3 and Hays and
Hadorn19, responsiveness is one aspect of validity rather than
a separate characteristic. Hays and Hadorn19 stated that the
fact that an instrument’s measurements are responsive to a clinical intervention supports the hypothesis that the instrument’s measurements are valid. The instrument responsiveness adds longitudinal information (i.e. the ability to capture changes over time) into the process of evaluating measurement validity19. When selecting an instrument for
evaluation, one should extend his or her concern for measurement validity beyond the face and construct validity to the discussion of the responsiveness of the instrument3.
On the other hand, Guyatt et al.24 proposed that responsiveness
is distinct from reliability and validity. They stated that an instrument’s measurements can have reliability, but no responsiveness; have responsiveness, but no validity; and have no reliability, but responsiveness. Despite, all measurement characteristics that may affect the findings should be addressed in a study’s discussion section in order to provide a full understanding of the strengths and weaknesses of the results and conclusions. The measurement properties may need to be evaluated separately depending on the objectives of the study.
Table 1. Overview of measurement reliability, validity and responsiveness.
NA= Not Applicable; NF= Not Found; *The decision of determine these cut-points depend on the importance of these measurement properties for the study3.
CONCEPTS TYPES SUBDIVISIONS EXAMPLES FOR LACHMAN’S TEST CUT-POINT
Intra-tester NA Kappa = 0.5111 > 0.60
Inter-tester NA Kappa = 0.4211 > 0.60
Intra-subject NA NF NA
Instrument NA p = 0.0712 > 0.05
Internal consistency NA r > 0.7513 > 0.75
Reliability
Parallel NA p < 0.0514 > 0.05
Face NA NA NA
Construct Convergent/Discriminate NA NA
Content NA NA NA
predictive 47% of a positive test, and 70% of a negative test11 *
concurrent NF NA
Validity
Criterion-related
prescriptive Improvement measured with the test after surgery18 NA
sensitivity NA 99%5 *
Responsiveness
Reliability and Responsiveness
A measurement can have high reliability (consistency), even when the instrument is unresponsive (i.e. not able to detect meaningful differences). Conversely, a measurement can have low reliability, yet the instrument may be responsive24.
Both reliability and responsiveness are pre-requisite of validity, but responsiveness is not a pre-requisite for reliability.
IMPLICATIONS OF NEGLECTING MEASUREMENT PROPERTIES
Many published studies fail to report the validity, reliability, and responsiveness of the measurements taken. Some instruments are often used but their measurement characteristics are frequently overlooked and assumed to be adequate. However, this may not be true, and the measurements may have low quality resulting in insufficient statistical power. The power of a study is the extent to which an investigator can detect a difference when a true difference exists. It may also be stated as the probability of correctly rejecting the null hypothesis that “there are no differences” when null hypothesis is false25. Thus, the power of a study
relates to how capable the measurement is in detecting differences between or within groups. Every study should have sufficient ability (power) to detect the effect caused by the application of an independent variable (e.g. treatment technique). It should also have a low probability of a type I (alpha) error, which corresponds to rejecting the null hypothesis, when it should not be rejected (for example: finding differences before and after a treatment when, in reality, there were no changes). The determinants of the power of a study include:
Sample size
The larger the sample, the greater the power, because with a large sample, the general population is more likely to be represented. This means the study has greater external validity. Therefore, the results can be generalized to a larger population, and the true differences between groups are more likely to be recognized.
Effect size
The larger the effect size, the greater the power. Effect size is the magnitude of the difference before and after treatment, or between groups25. Thus, the power is influenced
by the size of the effect of the experimental variable (e.g. treatment). The larger the effect produced by a treatment on a given dependent variable (e.g. knee stability), the more likely it is that the differences before and after will be statistically significant26.
Statistical significance level used (α-level)
The higher the α-level (i.e. higher than 0.05), the greater the power, but also the higher the chances of making a type I error. The α-level is the probability that the researcher is willing to accept that he or she might be wrong in rejecting
the null hypothesis, or the extent to which the researcher could be wrong in saying that there are differences. The most common α-level used is 0.05 which means that the researcher is accepting that he or she could be wrong in rejecting the null hypothesis 5 times out of 100 or 5% of the time. Lowering the α-level reduces the chances of a type I error by requiring stronger evidence to demonstrate significant differences. Increasing the α-level makes it easier to find differences (it may increase the power), but the probability that one will find a difference that actually does not exist (type I error) also increases.
Variability of the data
The lower the variance, the greater the power. Variance is a measure of the variability within the group (e.g. injured vs. non-injured; before vs. after treatment). The ability to detect a difference between groups is enhanced when the groups are distinctly different. When the variability within groups is large, the difference between groups will be less evident because the measurements may overlap. This, in turn will lower the power or the ability to detect a difference25.
Most of the determinants of power described above depend on the quality of the measurements. If the measurements’ reliability, validity, and responsiveness are not adequate the study’s ability to detect the effect of an independent variable (e.g. treatment) will be low or inexistent. For example, the amount of variation in the scores obtained for a particular sample or group (i.e. the standard deviation) depends on the variation in the scores and the amount of random measurement error. When the measurement error is big (e.g. the measurements have low reliability), differences between groups and changes over time may become undetectable. Thus, the effect size will be small decreasing the power of the study27. The responsiveness of a
measurement instrument is also related to the effect size and will also influence the power of a study. If the instrument measures are not precise enough to capture meaningful changes (low responsiveness), then the differences may be too small to be identifiable. This, in turn, will cause the effect size and the power of the study to be small.
Studies with limited power do not always yield erroneous conclusions but their findings are questionable. The chances that such studies will detect differences rejecting the null hypothesis are small. In other words, studies with low power may not be able to identify differences that exist between groups, leading to erroneous results and conclusions. Many studies in the literature fail to achieve statistical significance which is often related to the low power of the study and not to an actual lack of difference between groups or sample populations25. It is relevant to state that the power of the study
of a study will be big enough if the statistical techniques, study design, including sample size and measurements are adequate26,29. Thus, assessing and reporting the measurement
properties should be a standard procedure in order to increase power and to allow readers to rely on the presented results. Unfortunately, this procedure is still an exception rather than the rule in the rehabilitation field.
MEASUREMENT PROPERTIES IN THE CRITICAL ANALYSIS OF REHABILITATION RESEARCH
A critical analysis of the rehabilitation research found common methodological limitations that resulted in weak studies30. Flaws were found in the experimental design,
measurement techniques, procedures to control for confounding variables, sample size, and in the statistical analysis of the studies. Thus, there is a need to improve the quality of rehabilitation research studies. The following are examples of questions that should be asked when designing, presenting and analyzing the quality of published studies. The answers to these questions are essential if one is to accept the results and conclusions of a study.
1) Did the study report the reliability, validity, and responsiveness of the measurements used?
2) Did the study control the sources of measurement error?
3) Did the study have sufficient power to detect possible difference between groups?
FINAL CONSIDERATIONS
Not all measurements properties and their types need to be tested in one study. For example, if the Lachman’s test is used to measure knee laxity of a subject on three consecutive occasions by the same tester, then the intra-tester reliability of the measurements may be of the most concern. However, if the absolute value of a measurement taken with an alternative instrument (other than the gold standard) is important to make a decision about whether a patient will or will not undergo surgery (for example), then the concurrent validity of the measurements may be the most important aspect to consider. When assessing a treatment outcome, the responsiveness of the instrument is essential because the instrument must be able to detect meaningful differences due to treatment. Independently, the measurement properties that are important for the study should always be reported. One alternative to actually testing measurement characteristics in the study is to use previous studies about these measurement characteristics to justify the use of specific procedures or instruments. A word of caution must be added. To use measurement characteristics from another study, the researcher must ensure the same “thing” is being measured.
For example, visual analogue scales have been show to be valid and reliable for some pain measures, but they have not been showed to be valid and reliable for many of the other variables they are purported to measure. Sometimes the concepts of measurements properties are incorrectly used to define the measurement characteristic being tested. For example, reliability and validity, and responsiveness and its sub-division of sensitivity to change have been used to denote the same property.
This review paper clarified the meanings of the concepts and types of reliability, validity, and responsiveness. It gave examples that are relevant to the rehabilitation field. It discussed how the measurement properties interact with each other and influence the effect size and power of studies. The authors hope that the presented definitions, explanations, and discussions contribute to the dissemination and encourage the use of common terminology and meanings for these measurement properties to facilitate improved communication between researchers and clinical practitioners. Reporting the measurement characteristics can improve the quality of rehabilitation research and clinical evaluation processes which are fundamental for ideal evidence based practice.
Acknowledgments: The authors would like to thank Dr. Sharon Warren (Faculty of Rehabilitation Medicine, University of Alberta) for reviewing and making suggestions for early versions of this paper. ICG and ERV have financial support from the Alberta CIHR Training Program in Bone and Joint Health (Canada) and from the Brazilian Government, Education Ministry (CAPES - Brazil, proc.# 1340018).
REFERENCES
1. Portney LG, Watkins MP. Reliability. In: Portney LG, Watkins MP. Foundations of Clinical Research: applications to practice. 2nd ed. New Jersey: Prentice Hall Health; 2000. P. 53-68.
2. Sim J, Arnell P. Measurement validity in Physical Therapy re-search. Phys Ther 1993; 73: 102-15.
3. Portney LG, Watkins MP. Validity of Measurements. In: Portney LG, Watkins MP. Foundations of Clinical Research: ap-plications to practice. 2nd ed. New Jersey: Prentice Hall Health;
2000. P. 79-112.
4. Torg JS, Conrad W, Kalen V. Clinical diagnosis of anterior cru-ciate instability in the athlete. Am J Sports Med 1976; 4:84-93. 5. Kim SJ, Kim HK. Reliability of the anterior drawer test, the pivot shift test, and the lachman test. Clin Orthop Relat Res 1995; 317: 237-42.
6. Christensen HW. Precision and accuracy of an electrogoniometer. J Manipulative Physiol Ther 1999; 22: 10-4.
7. Walmsley RP, Amell TK. The application and interpretation of intraclass correlation in the assessment of reliability in Isokinetic dynamometry. Isokinet Exerc Sci 1996; 6: 117-24.
9. Sim J, Wright CC. The kappa statistic in reliability studies: use, interpretation, and sample size requirements. Phy Ther 2005; 85: 257-68.
10. Domholdt E. Measurement Theory. In: Domholdt E. Physical Therapy Research: principles and applications. 2nd ed.
Phila-delphia: WB Saunders Company; 2000.
11. Cooperman JM, Riddle DL, Rothstein JM. Reliability and va-lidity of judgments of the integrity of the anterior cruciate liga-ment of the knee using the lachman’s test. Phys Ther 1990; 70: 225-33.
12. Johnson DS, Ryan WG, Smith RB. Does the Lachman testing method affect the reliability of the International Knee Documen-tation Committee (IKDC) Form? Knee Surg Sports Traumatol Arthrosc 2004; 12: 225-28.
13. Irrgang JJ, Anderson AF, Boland AL, Harner CD, Kurosaka M, Neyret P, Richmond JC, Shelborne KD. Development and vali-dation of the international knee documentation committee sub-jective knee form. Am J Sports Med 2001; 29: 600-13. 14. Balasch H, Schiller M, Friebel H, Hoffmann F. Evaluation of
anterior knee joint instabilitywith the Rolimeter - A test in com-parison with manual assessment and measuring with the KT-1000 arthrometer. Knee Surg, Sports Traumatol, Arthrosc. 1999; 7: 204-8.
15. Rothstein JM. Reliability and Validity: implications for research. In: Bork CE, editor. Research in Physical Therapy. Philadelphia: JB Lippincott; 1993. P. 18-36.
16. Malanga GA, Andrus S, Nadler SF, McLean J. Physical Exami-nation of the Knee: A Review of the Original Test Description and Scientific Validity of Common Orthopedic Tests. Arch Phys Med Rehabil 2003; 84: 592-603.
17. Loos WC, Fox JM, Blazina ME, Del Pizzo W, Friedman MJ. Acute posterior cruciate ligament injuries. Am J Sports Med 1981; 9: 86-92.
18. Scranton PE, Jr Bagenstose JE, Lantz, BA, Friedman MJ, Khalfayan, EE, Auld MK. Quadruple hamstring anterior cruciate ligament reconstruction: a multicenter study. Arthroscopy 2002; 18: 715-24.
19. Hays R D, Hadorn D. Responsiveness to change: an aspect of validity, not a separate dimension. Qual Life Res 1992; 1: 73-5.
20. Kirshner B, Guyatt G. A methodological framework for assess-ing health indices. J Chronic Dis 1985; 38: 27-36.
21. Deyo RA, Centor RM. Assessing the responsiveness of func-tional scales to clinical change: an analogy to diagnostic test per-formance. J Chronic Dis. 1986; 39: 897–906.
22. Donaldson III WF, Warren RF, Wickiewicz T. A comparison of acute anterior cruciate ligament examinations. Am J Sports Med 1985; 13: 5-9.
23. Katz JW, Fingeroth RJ. The diagnostic accuracy of ruptures of the anterior cruciate ligament comparing the Lachman test, the anterior drawer sign, and the pivot shift test in acute and chronic knee injuries. Am J Sports Med 1986; 14: 88-91.
24. Guyatt G, Walter S, Norman G. Measuring change over time: assessing the usefulness of evaluative instruments. J Chronic Dis. 1987; 40: 171-8.
25. Portney LG, Watkins MP. Power and sample size (Appendix C). In: Portney LG, Watkins MP. Fundations of Clinical Re-search: applications to practice. 2nd ed. New Jersey: Prentice
Hall Health; 2000. P.705-29.
26. Lipsey, M. Design sensitivity: statistical power for experimental research. Newbury Park, CA: Sage; 1990.
27. Coe, R. What is an effect size: a guide for users [homepage on the Internet]. UK: Evidence-Based Education UK [updated 2000 Jan; cited 2005 Jun 15]. Available from: http:// www.cemcentre.org/ebeuk/research/effectsize/ESguide.htm
28. Lachin JM. Introduction to sample size determination and power analysis for clinical trials. Control Clin Trials 1981; 2:93-113.
29. Cohen J. Statistical power for the behavioral Sciences, 3rd ed.
Hillsdale, NJ: Lawrence Erlbaum; 1988.