Article
J. Braz. Chem. Soc., Vol. 22, No. 6, 1040-1049, 2011. Printed in Brazil - ©2011 Sociedade Brasileira de Química 0103 - 5053 $6.00+0.00
A
*e-mail: [email protected]
Determination of Metal Impurities in Carbon Nanotubes by Direct Solid Sampling
Electrothermal Atomic Absorption Spectrometry
Paola A. Mello, Luiz Frederico Rodrigues, Matheus A. G. Nunes, Julio Cezar P. Mattos, Edson I. Müller, Valderi L. Dressler and Erico M. M. Flores*
Departamento de Química, Universidade Federal de Santa Maria, 97105-900 Santa Maria-RS, Brazil and Instituto Nacional de Ciência e Tecnologia de Bioanalítica, Campinas-SP, Brazil
A determinação de Al, Cd, Co, Cr, Cu, Mg, Mn e Pb em nanotubos de carbono (CNTs) foi realizada por espectrometria de absorção atômica com atomização eletrotérmica e amostragem direta de sólidos (DSS-ET AAS, corretor de fundo com fonte de deutério). Foram avaliados os parâmetros de aquecimento, uso de Pd como modiicador químico, possibilidade de calibração com soluções aquosas e massa máxima de amostra. Para comparação dos resultados as amostras foram analisadas por espectrometria de massa com plasma indutivamente acoplado (ICP-MS) e espectrometria de emissão óptica com plasma indutivamente acoplado (ICP OES) após decomposição por via úmida em sistema de alta pressão assistida por micro-ondas e também por combustão iniciada por micro-ondas. Não foram observadas diferenças signiicativas entre os resultados obtidos pelo método proposto e pelas outras técnicas. A exatidão também foi avaliada por comparação com resultados de análise por ativação neutrônica (NAA). A calibração foi possível com soluções de referência aquosas. Os sinais de fundo foram sempre inferiores a 0,02 (altura de pico) e o uso de modiicador químico não foi necessário. O método proposto possibilitou a determinação de todos os analitos, com menores limites de detecção quando comparados com as outras técnicas.
Metal impurities (Al, Cd, Co, Cr, Cu, Mg, Mn and Pb) were determined in carbon nanotubes (CNTs) by direct solid sampling electrothermal atomic absorption spectrometry (DSS-ET AAS, deuterium lamp background corrector). Parameters as pyrolysis and atomization temperatures, use of Pd as chemical modiier, feasibility of calibration using aqueous standard solutions and maximum sample mass were investigated. Results obtained by the proposed method were compared with those obtained by neutron activation analysis (NAA) and also by inductively coupled plasma mass spectrometry (ICP-MS) and inductively coupled plasma optical emission spectrometry (ICP OES) after high-pressure microwave assisted wet digestion and microwave-induced combustion methods. No signiicant differences were observed between the results obtained by DSS-ET AAS, ICP-MS and ICP OES after both digestion methods and also by NAA. Calibration was performed using aqueous standards. Background signals were always lower than 0.02 (peak height) and no chemical modiier was used. The proposed method allowed the determination of all elements in CNTs with lower limits of detection in comparison with other techniques.
Keywords: carbon nanotubes, metal impurities, solid sampling, electrothermal atomic absorption spectrometry
Introduction
Since the advent of nanotechnology the development of new materials with a wide range of special properties has been performed for very different applications in almost all technological ields. With the discovery of carbon nanotubes (CNTs) by Iijima,1 this new class of nanomaterials provided
unique chemical, mechanical and electronic properties. In
recent years, carbon nanotubes have received a growing interest in several ields as materials industry, electronics, medicine and also in analytical applications.2-7 Carbon nanotubes can
During the synthesis of CNTs, generally by chemical vapor deposition, arc discharge or laser ablation, it is necessary the use of metallic catalysts and the most common ones are based on nickel, cobalt, iron, lanthanum or their combinations.2,8,9 In general, commercial carbon
nanotubes must be submitted to a inal processing step for the removal of amorphous carbon, residues of metallic catalysts and side products10 by chemical and physical
methods.11,12 However, even after an acid washing step (the
most common method for CNTs puriication, e.g., 36 h at 80 °C using HNO3), metals are still present in relatively
high levels because a signiicant part of them is sheathed by several graphite layers inside the CNTs structure.13,14
The presence of metal impurities can affect the physical, chemical and surface properties of CNTs making dificult their use for industrial applications.5,9,11,12 In addition, the
toxicity by inhalation and the risk assessment have been recently discussed in literature due to the increasing use of CNTs in medicine and related areas.15-18 Moreover, the
presence of metal impurities can increase the potential risk of these materials. In this way,the development of methods for the determination of metallic elements in low concentration is strongly required for CNTs.10,11
The most common way of sample introduction using atomic spectrometric techniques is as aqueous solutions. However, the main problem concerning the determination of impurities in CNTs is the sample preparation step since these materials are extremely dificult to bring into solution in view of their stable structure.13,14 Recently,
some methods for CNTs digestion have been discussed in literature. Microwave-assisted digestion using a mixture of nitric and perchloric acids (1 h heating) was applied before the determination of Al, Cr, Fe, Mo, and Ni by inductively coupled plasma optical emission spectrometry (ICP OES).19 In another work, a digestion method of CNTs
for metals determination by inductively coupled plasma mass spectrometry (ICP-MS) was recently proposed using a combination of dry ashing and wet digestion, with concentrated nitric acid and hydrogen peroxide for the determination of Cr, Mn, Fe, Co, Ni, Cu, Zn and Mo, and results were compared with those obtained by neutron activation analysis (NAA).20 In the same work, it was also
pointed out the possibility of using microwave-assisted digestion. However, only a very small sample mass (20 mg) of MWCNT could be digested with concentrated nitric acid even by 30 min at 200 °C.20
In spite of the relatively good results obtained using the previously described procedures, they are considered as time consuming (dry ashing) and required the use of concentrated reagents (wet digestion). As a consequence, they are prone to analyte losses or contamination and can
result in generation of highly concentrated acid residues (specially wet digestion). It is also important to mention that incomplete digestion, high acid content (or the presence of perchloric and hydrochloric acids) in the digests can cause systematic errors for the determination using atomic spectrometric techniques.21,22
Recently, the determination of Co, Cr, Cu, Fe, Mo, Ni, and Zn by ICP-MSand ICP OES was evaluated after microwave-assisted digestion. Good results were found in comparison with those obtained by NAA.23 However,
only 5 mg of CNT samples were digested even using concentrated nitric acid and hydrogen peroxide by 45 min making dificult to obtain low limits of detection (LOD). In addition, nonspectral interferences caused by carbon residues in sample solution were reported.23
Microwave-induced combustion (MIC) has been successfully applied for organic samples most of them considered hard to be digested using concentrated acids in closed systems. This method has been also recently proposed for the determination of La and Ni as catalyst residues by ICP OES,24 and for halogens determination by ICP-MS
and ion chromatography.25 Despite the previously reported
methods for CNTs digestion, some drawbacks can be pointed out as the low eficiency of decomposition and also the interferences that can be caused by the high acid concentration and/or residual carbon content. Moreover, the digestion step is generally associated with a signiicant dilution and sometimes a pre-concentration and/or matrix separation step might be employed spending more time and reagents.21,22,26
Owing to the limitations of wet digestion, several approaches have been considered for the development of reagent free digestion methods. On this aspect, NAA is one of the most powerful techniques for direct analysis of solid samples and it has been proposed for determination of trace elemental impurities in SWCNT and MWCNT.10
However, despite some advantages as high sensitivity and selectivity for many elements it requires a nuclear reactor that makes dificult its use for routine analysis.23
On the other hand, the direct analysis of solid samples has been proposed as an alternative in atomic absorption spectrometry.27-30
Direct solid sampling electrothermal atomic absorption spectrometry (DSS-ET AAS) has proven to be a highly worthwhile method for the analysis of several very dificult matrices to digest, as aluminum oxide,31 silicon carbide,32
silicon nitride,33 sand,34 alumina based catalysts,35 zirconium
dioxide,36 boron nitride,37 polymers38 and graphite.32
step can be minimized or even excluded, this technique allows increasing the sample throughput and hence none or only very small amount of reagents are required. As a consequence, residues generation can be strongly reduced. In addition, the very low limits of detection and relative robustness make this technique suitable for trace element analysis for routine aplication.27,32,39-42
In the present study DSS-ET AAS was applied to the determination of eight elements (Al, Cd, Co, Cr, Cu, Mg, Mn and Pb) in SWCNTs and MWCNTs. The operational parameters were evaluated in order to achieve feasible calibration using aqueous standards. For accuracy evaluation, the results obtained by DSS-ET AAS were compared with those obtained by ICP-MS and ICP OES after sample digestion and also with the results obtained by NAA.
Experimental
Instrumentation
All measurements were carried out with a Model AAS 5 EA atomic absorption spectrometer (Analytik Jena, Jena, Germany) equipped with a deuterium background correction system, a transversely heated graphite atomizer and an Model SSA 5 manual solid sample introduction system. Pyrolytically coated graphite tubes, platforms, hollow cathode lamps and deuterium lamp were supplied by Analytik Jena. A model M2P microbalance with resolution of 0.001 mg (Sartorius, Göttingen, Germany) was used for sample weighing.
A microwave sample preparation system (Multiwave 3000, software version v1.27-Synt, Anton Paar, Graz, Austria) equipped with high-pressure quartz vessels (internal volume of 80 mL, maximum operating temperature and pressure of 280 °C and 80 bar, respectively) was used for high-pressure microwave-assisted wet digestion and for MIC digestion. Commercial combustion quartz holders (Anton Paar, part number 16427) were used for MIC.
Determination of metals after sample digestion was performed using an inductively coupled plasma mass spectrometer (PerkinElmer-SCIEX, Model Elan DRC II, Thornhill, Canada) equipped with a concentric nebulizer (Meinhard Associates, Golden, CO, USA), a cyclonic spray chamber (Glass Expansion, Inc., West Melbourne, Australia) and a quartz torch with a quartz injector tube (2 mm i.d.). Radiofrequency power was 1400 W, plasma, auxiliary and nebulizer gas low-rates were 15.0, 1.2 and 1.15 L min-1, respectively. Measurements were performed
using 114Cd, 59Co, 63Cu, 55Mn, and 208Pb isotopes. A
simultaneous inductively coupled plasma optical emission
spectrometer (Model Optima 4300 DV, PerkinElmer, Shelton, CT, USA) was also used for CNTs analysis. A concentric nebulizer and a cyclonic spray chamber (Glass Expansion Inc.) were used. The radiofrequency power was set at 1300 W and plasma gas low rates were 15.0, 0.2 and 0.8 L min-1 for principal, auxiliary and nebulizer,
respectively. The selected wavelengths were 396.152 nm (Al), 228.802 nm (Cd), 228.616 nm (Co), 267.716 nm (Cr), 327.396 nm (Cu), 279.553 nm (Mg), 257.611 nm (Mn) and 220.353 nm (Pb). Instrumental parameters for ICP-MS and ICP OES measurements were selected following the instructions of the respective manufacturer.43,44 Argon
(99.996%, White Martins - Praxair, São Paulo, SP, Brazil) was used for ICP-MS and ICP OES.
All statistical calculations, including one-way analysis of variance (ANOVA, P < 0.05), were performed using GraphPad InStat (GraphPad InStat Software Inc, Version 3.00, 1997) software.
Reagents and samples
Water was distilled, deionized and puriied in a Milli-Q system (18.2 MΩ cm, Millipore, Billerica, MA, USA). Analytical grade nitric acid (Merck, Darmstadt, Germany) was doubly distilled using a sub-boiling distillation system (model DuoPur, Milestone, Sorisole, Italy). Calibration standard solutions were daily prepared by serial dilution of single-element stock standard solutions (1000 mg L-1
in 2% v/v HNO3, Merck). Ammonium nitrate (Merck)
was used as igniter for MIC method (6 mol L-1 solution in
water).
Five commercial single and multi-wall carbon nanotube samples (named as CNT samples A to E) obtained by catalytic chemical vapor deposition with nickel catalysts were used in this study. Sample characteristics are shown in Table 1.
Procedures
balance to atomizer. Calibration curves were obtained by manual pipetting different volumes of the respective aqueous standard solution onto the platform (from 2 to 20 µL). Integrated absorbance mode was used for the evaluation of absorption signals. Owing to the high vaporization temperatures of sample matrix, the cleanout step was shown to be ineficient for sample removal from platform. Sample residues from the graphite platform were easily removed using pressurized air and, as a result, the cleanout step was not necessary. Alternative lines and the use of Ar low-rate during atomization step were selected when necessary to reduce the sensitivity of ET AAS for
quantiication for samples with higher analyte contents. Instrumental parameters and temperature programs are presented in Tables 2 and 3, respectively.
Results obtained by the proposed method for metals determination in CNTs were compared with those obtained by ICP-MS and ICP OES after sample digestion. Microwave-assisted wet digestion was used with 50 mg of sample and 6 mL of concentrated nitric acid (maximum pressure and temperature were set at 80 bar and 280 °C, respectively). Microwave heating program was (i) 1000 W for 60 min (10 min ramp); and (ii) 0 W for 20 min for cooling step. Digestion of CNTs was also performed by MIC for
Table 1. Characteristics of CNT samples used in this studya
Sample Type Minimum purity / (%) Outside diameter / nm Length / µm
A SWCNT 99 not informed not informed
B MWCNT 95 20-40 1-2
C MWCNT 95 20-40 5-15
D MWCNT 90 10-30 1-10
E SWCNT 98 not informed not informed
aInformation in Table 1 was provided by the manufacturer.
Table 2. Instrumental parameters used for the individual elements
Parameter
Element
Al Cd Co Cr Cu Mg Mn Pb
Wavelength / nm 394.4a 228.8 240.7/241.2a 425.4a 324.8/327.8a 202.6a 279.5 283.3
Spectral bandpass / nm 0.5 0.8 0.2 0.2 0.8 0.8 0.2 0.8
HCL current / mA 6 5 12 5 6 7 6 6
awavelength used for less sensitive condition.
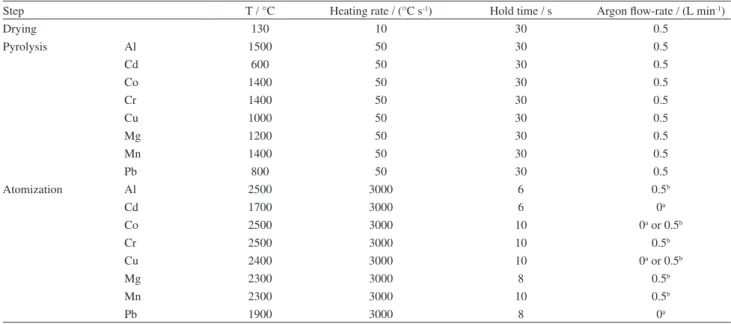
Table 3. Temperature program used for analysis of CNTs by DSS-ET AAS
Step T / °C Heating rate / (°C s-1) Hold time / s Argon low-rate / (L min-1)
Drying 130 10 30 0.5
Pyrolysis Al 1500 50 30 0.5
Cd 600 50 30 0.5
Co 1400 50 30 0.5
Cr 1400 50 30 0.5
Cu 1000 50 30 0.5
Mg 1200 50 30 0.5
Mn 1400 50 30 0.5
Pb 800 50 30 0.5
Atomization Al 2500 3000 6 0.5b
Cd 1700 3000 6 0a
Co 2500 3000 10 0a or 0.5b
Cr 2500 3000 10 0.5b
Cu 2400 3000 10 0a or 0.5b
Mg 2300 3000 8 0.5b
Mn 2300 3000 10 0.5b
Pb 1900 3000 8 0a
comparison of results. In this case, MIC was carried out according to previous works24,45 using 6 mL of concentrated
nitric acid as absorbing solution, 50 µL of a 6 mol L-1
NH4NO3 solution as igniter
46 and 20 bar of O
2 for digestion
of 200 mg of sample. For both digestion methods, samples were diluted with water up to 30 mL in polypropylene vials prior to analysis by ICP-MS and ICP OES.
One sample of CNT (sample C) was selected to be analyzed by NAA. Analysis was performed at Institute of Energetic and Nuclear Research (IPEN, Laboratório de Análise por Ativação Neutrônica, Comissão Nacional de Energia Nuclear, São Paulo, SP, Brazil) under a neutron low of 3 × 10¹² n cm2 s-1 for 8 h. Gamma activity measurements
were performed using a hyperpure Ge detector (GX 2020, Canberra) linked to a spectrometer. The radioisotopes measured were 60Co at 1332.5 keV (5.24 years), 51Cr at
320.10 keV (27.8 days), 66Cu at 1039.00 keV (5.10 min), 27Mg at 1014.40 keV (9.45 min) and 56Mn at 1642.7 keV
(2.58 h).
Results and Discussion
Pyrolysis and atomization curves
Initially, pyrolysis and atomization curves for Al, Cd, Co, Cr, Cu, Mg, Mn and Pb in aqueous solutions and solid samples were established in order to select suitable conditions for each element. The main aspects considered for this evaluation were the repeatability of absorption proiles, sensitivity and background signal intensity. When the heating program was applied to solid CNT samples the highly refractory matrix remained on the platform practically unchanged even using temperatures up to 2600 °C. As a consequence of the non volatilization of sample matrix, no signiicant gas-phase interference due to carbon compounds were observed. When analyzing both aqueous standard solutions or solid samples, background signals were always lower than 0.02 (peak height) for all the analytes. The maximum mass loss at 2600 °C was below 2% for all CNT samples. As performed in previous work and based on the thermally stable behavior of sample matrix, a cleanout step was considered as not necessary.47 Then, after the heating
program the platform was removed from the graphite furnace and cleaned using a low of pressurized air before the next weighing step as previously reported.32 No memory effects
were observed for all the analytes including also carbide forming elements, such as Cr. This effect was evaluated by applying a subsequent heating program without the cleanout step and also matrix removing. However, no difference was observed when compared with the experiment with the removal of matrix after the atomization step.
The use of oxygen low during the pyrolysis step was also evaluated. In these experiments pyrolysis was applied for 40 s and in the irst 30 s an O2 low-rate of 0.5 L min-1
was applied. When using oxygen the sample matrix (about 7 mg) was completely eliminated. However, no differences were observed in absorbance or absorption proile for the results with and without oxygen during pyrolysis. Then, in order to avoid the use of an additional gas and also to improve the tube and platform lifetime, the use of oxygen was not considered in this work for further experiments.
Based on these previous tests, pyrolysis and atomization temperatures for Al, Cd, Co, Cr, Cu, Mg, Mn and Pb were established based on the thermal behavior of aqueous standard solution and solid CNT matrix. Table 3 shows pyrolysis temperatures for CNT samples which are the maximum temperatures where no signiicant losses were observed for both standard solution and solid CNT sample. Pyrolysis temperatures ranged from 600 °C (for Cd) up to 1500 °C (for Al). In general, analyte losses in CNT samples were observed in temperatures between 100 to 200 °C higher in comparison to the temperature where losses in aqueous standard solutions were observed. Atomization temperatures are also given in Table 3 and they ranged from 1700 °C (for Cd) to 2500 °C (for Al, Co and Cr). For most of elements the selected atomization temperatures were comparable to the conditions used in previous work for a similar matrix (graphite) also without chemical modiiers and using the same model of equipment.32 Using the
selected conditions, the platform lifetime was about 400 runs and for graphite tubes it was about 600 heating cycles.
Analytical signals and calibration
Signals for analytes atomized from aqueous standard solution and solid samples presented similar absorption proiles. Figure 1 shows, as an example, the Pb signals for aqueous standard solution and solid samples of CNTs.
masses (ANOVA, P < 0.05). This behavior is generally observed for the analytes vaporization from solid samples and can be attributed to physical (diffusion) and chemical interactions of the elements with the matrix. Taking into account that no signiicant interferences were observed, this effect was not further investigated in the present work. A similar behavior was observed for other analytes.
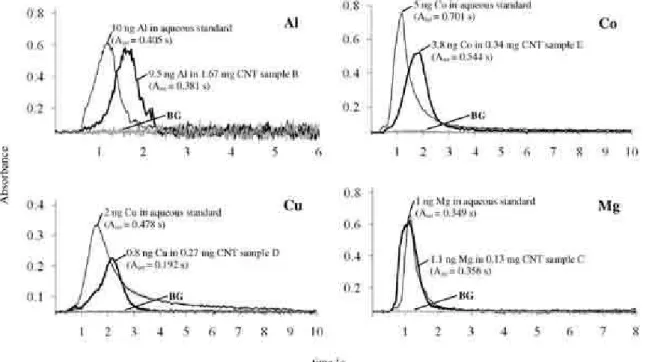
For Al, Cd, Co and Cu, atomized from sample matrix, the maximum peak height was about 0.4 to 0.7 s delayed in relation to the signal observed for aqueous solution. In case of Mg, a similar behavior was observed regarding
absorption proile for this analyte. No delay was observed for Mg when analyzing solid sample matrix. As example, Figure 2 shows the analytical signals for Al, Co, Cu and Mg in aqueous solution and solid CNT sample. It is important to mention that some differences between the transient signals in atomization from the CNT sample and from aqueous standard solution do not affect the accuracy by using integrated absorbance mode.
The only exception regarding to the analyte release from aqueous standard solution and solid sample matrix was observed for Cr. In this case (Figure 3) it was observed
Figure 1. Atomic absorption signals for Pb obtained for aqueous standard solution and solid CNT samples and background signals (BG) for the same solid sample (for temperature programs see Table 3). a) 250 pg Pb in aqueous standard solution, Aint = 0.099 s; b) 250 pg Pb pipetted onto 3.55 mg of residual matrix remained after heating program for CNT sample A, Aint = 0.099 s; c) 530 pg Pb (3.63 mg of CNT sample A), Aint = 0.210 s; d) 250 pg Pb pippeted onto 1.53 mg CNT sample A (220 pg Pb), Aint = 0.184 s (470 pg Pb); e) 544 pg Pb (7.07 mg CNT sample B), Aint = 0.218 s.
Figure 2. Atomic absorption signals for Al, Co, Cu, and Mg obtained for aqueous standard solutions (—) and solid CNT samples (—) and background signals (BG). (For temperature programs see Table 3).
a faster release from sample matrix (peak b) when it is compared to aqueous solution (peak a). For both signals b and d spikes of aqueous solutions were added to residual matrix (after atomization) or to the CNT matrix (previously to heating program), respectively. For these signals it is possible to observe that the peak appearance starts before the correspondent to aqueous standard (peak a) or to the normal Cr content in CNT sample (peak c). It can be explained, as expected, by the similar volatility of Cr from spikes.
Chemical modiier
The necessity of using a chemical modiier was also investigated in this work in order to evaluate the thermal behavior of sample matrix and analyte atomization. Palladium solution (correspondent to 5 µg Pd) was added directly on the solid sample after the weighing step on the graphite platform. No differences were observed related to the absorption proile and integrated area with or without the use of Pd. However, for all the analytes an increase in pyrolysis temperature was possible with Pd for both aqueous standard solution and solid CNTs. All signals were completely recorded within the selected integration time with and without chemical modiier. No improvement in sensitivity was found when using Pd. In addition, background signals were always lower than 0.02 (peak height) with or without Pd. Therefore, in order to simplify the analytical method the use of chemical modiier was considered as not necessary in the present work.
Analysis of carbon nanotube samples
In general, analysis of solid materials has been performed using calibration with aqueous standard solutions.33,34,36, 40-42 Sometimes, solid reference materials
can be required or even it could be necessary to add the standard solution onto the residual matrix remaining from the previous sample run.47 One of the main requirements
for the development of a calibration method using aqueous standard solutions is that when analyzing solid samples the matrix effect on the absorbance signal is negligible. In order
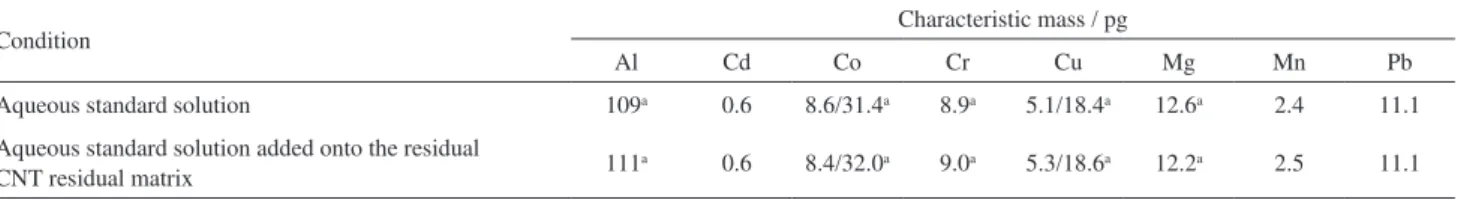
to verify this effect, characteristic masses were determined with the aqueous standard solution in the absence and in the presence of CNT solid matrix. This evaluation was performed for all the CNT samples. About 7 mg of sample were weighed onto the sample platform and the selected heating program was applied (according to Table 3). After inishing the DSS-ET AAS heating program the sample remained practically unchanged in graphite platform. Then, aqueous standard solution was added onto the residual matrix in order to observe the absorption proile for all analytes. Characteristic masses obtained for all investigated elements are presented in Table 4.
According to the results obtained from this study no signiicant difference was found between the characteristic masses obtained by pipetting the standard solution onto graphite platform with or without residual sample matrix for all elements. The absorption proile and transiency were delayed in sample matrix as discussed previously, but no signiicant change in sensitivity was observed (see Figures 1 and 2). Thus, calibration could be performed for all the analytes using aqueous standard solution added directly onto the graphite platform without sample matrix.
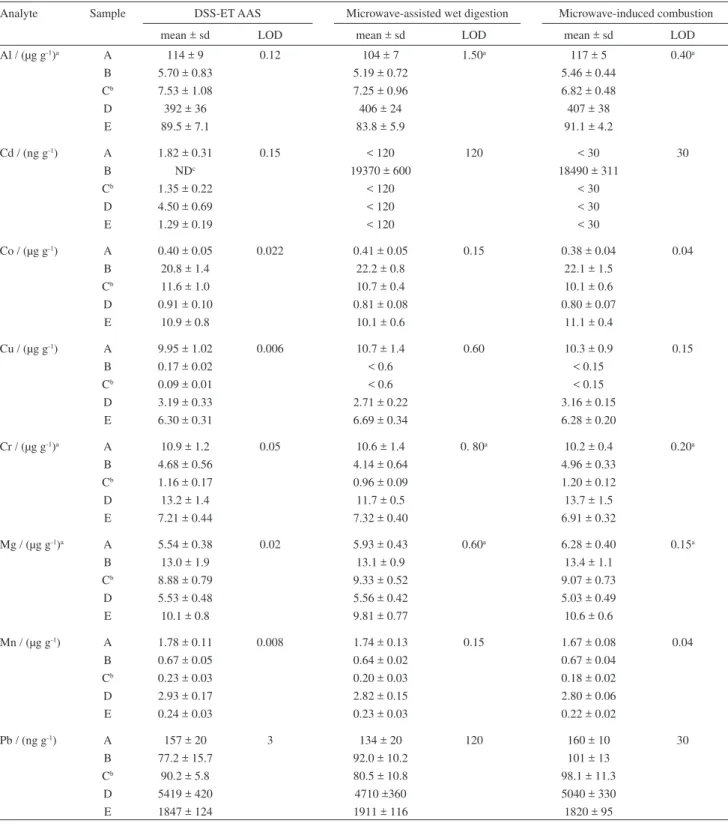
As no certified reference material is available for metals in CNTs, the accuracy of the proposed DSS-ET AAS method was checked by comparison of the results with those obtained by high-pressure microwave-assisted wet digestion or MIC followed by analysis by ICP-MS and ICP OES. Due to the interferences that could be observed for elements with m/z lower than 80 using quadrupole ICP-MS. Results for Al, Cr and Mg were obtained only by ICP OES. Cadmium, Co, Cu, Mn and Pb were determined by both ICP-MS and ICP OES and when their concentration was higher than the LOD no statistical difference (t-test at the signiicance level of P = 0.05) was observed. Table 5 shows the results obtained by the proposed DSS-ET AAS method and by ICP-MS (for Cd, Co, Cu, Mn and Pb) and ICP OES (for Al, Mg and Cr) after two different sample digestion methods.
No statistical difference (ANOVA, P < 0.05) was observed for the results obtained by DSS-ET AAS and ICP-MS after digestion by both high-pressure microwave-assisted wet digestion and MIC. In addition,
Table 4. Characteristic masses obtained for aqueous standard solution with or without residual sample matrix
Condition Characteristic mass / pg
Al Cd Co Cr Cu Mg Mn Pb
Aqueous standard solution 109a 0.6 8.6/31.4a 8.9a 5.1/18.4a 12.6a 2.4 11.1
Aqueous standard solution added onto the residual
CNT residual matrix 111
a 0.6 8.4/32.0a 9.0a 5.3/18.6a 12.2a 2.5 11.1
the results obtained by the proposed method for Co, Cr, Cu, Mg and Mn in CNT sample C were also compared with the results obtained by NAA (see footnotes in Table 5). Aluminum, Cd and Pb were not determined by NAA. For
Co, Cr and Mn, no signiicant difference was observed between the results obtained by the proposed method and those obtained by NAA (results obtained by NAA were lower than LOD for Mg and Cu). For Mg the result obtained
Table 5. Results obtained for analysis of carbon nanotube samples by DSS-ET AAS (n ≥ 6) and comparison with those obtained by ICP-MS after high-pressure microwave-assisted wet digestion (n = 3) and microwave-induced combustion (n = 3)
Analyte Sample DSS-ET AAS Microwave-assisted wet digestion Microwave-induced combustion
mean ± sd LOD mean ± sd LOD mean ± sd LOD
Al / (µg g-1)a A 114 ± 9 0.12 104 ± 7 1.50a 117 ± 5 0.40a
B 5.70 ± 0.83 5.19 ± 0.72 5.46 ± 0.44
Cb 7.53 ± 1.08 7.25 ± 0.96 6.82 ± 0.48
D 392 ± 36 406 ± 24 407 ± 38
E 89.5 ± 7.1 83.8 ± 5.9 91.1 ± 4.2
Cd / (ng g-1) A 1.82 ± 0.31 0.15 < 120 120 < 30 30
B NDc 19370 ± 600 18490 ± 311
Cb 1.35 ± 0.22 < 120 < 30
D 4.50 ± 0.69 < 120 < 30
E 1.29 ± 0.19 < 120 < 30
Co / (µg g-1) A 0.40 ± 0.05 0.022 0.41 ± 0.05 0.15 0.38 ± 0.04 0.04
B 20.8 ± 1.4 22.2 ± 0.8 22.1 ± 1.5
Cb 11.6 ± 1.0 10.7 ± 0.4 10.1 ± 0.6
D 0.91 ± 0.10 0.81 ± 0.08 0.80 ± 0.07
E 10.9 ± 0.8 10.1 ± 0.6 11.1 ± 0.4
Cu / (µg g-1) A 9.95 ± 1.02 0.006 10.7 ± 1.4 0.60 10.3 ± 0.9 0.15
B 0.17 ± 0.02 < 0.6 < 0.15
Cb 0.09 ± 0.01 < 0.6 < 0.15
D 3.19 ± 0.33 2.71 ± 0.22 3.16 ± 0.15
E 6.30 ± 0.31 6.69 ± 0.34 6.28 ± 0.20
Cr / (µg g-1)a A 10.9 ± 1.2 0.05 10.6 ± 1.4 0. 80a 10.2 ± 0.4 0.20a
B 4.68 ± 0.56 4.14 ± 0.64 4.96 ± 0.33
Cb 1.16 ± 0.17 0.96 ± 0.09 1.20 ± 0.12
D 13.2 ± 1.4 11.7 ± 0.5 13.7 ± 1.5
E 7.21 ± 0.44 7.32 ± 0.40 6.91 ± 0.32
Mg / (µg g-1)a A 5.54 ± 0.38 0.02 5.93 ± 0.43 0.60a 6.28 ± 0.40 0.15a
B 13.0 ± 1.9 13.1 ± 0.9 13.4 ± 1.1
Cb 8.88 ± 0.79 9.33 ± 0.52 9.07 ± 0.73
D 5.53 ± 0.48 5.56 ± 0.42 5.03 ± 0.49
E 10.1 ± 0.8 9.81 ± 0.77 10.6 ± 0.6
Mn / (µg g-1) A 1.78 ± 0.11 0.008 1.74 ± 0.13 0.15 1.67 ± 0.08 0.04
B 0.67 ± 0.05 0.64 ± 0.02 0.67 ± 0.04
Cb 0.23 ± 0.03 0.20 ± 0.03 0.18 ± 0.02
D 2.93 ± 0.17 2.82 ± 0.15 2.80 ± 0.06
E 0.24 ± 0.03 0.23 ± 0.03 0.22 ± 0.02
Pb / (ng g-1) A 157 ± 20 3 134 ± 20 120 160 ± 10 30
B 77.2 ± 15.7 92.0 ± 10.2 101 ± 13
Cb 90.2 ± 5.8 80.5 ± 10.8 98.1 ± 11.3
D 5419 ± 420 4710 ±360 5040 ± 330
E 1847 ± 124 1911 ± 116 1820 ± 95
by DSS-ET AAS was in agreement with the result obtained using digestion methods. For Cu all the results (NAA and ICP-MS after both digestion methods) were lower than the LOD with the exception of the result obtained by the proposed DSS-ET AAS method. For this sample the use of spikes was the only alternative to evaluate the accuracy (recovery better than 98%).
For all elements in Table 5, relative standard deviations (RSDs) for DSS-ET AAS were between 4.9% (for Cu in CNT sample E) to 14.7% (for Cd in CNT sample A). The only exception was Cd in CNT samples A, C and D (17.0, 16.3 and 15.3%, respectively), and Pb in sample B (20.3%). It is important to mention that these higher RSDs were obtained only for Cd and Pb which were in ng g-1 level. Results obtained by ICP-MS with previous
digestion by high-pressure microwave-assisted wet digestion and MIC showed RSD in the range of 3.1% (for Cd in CNT sample B which is in mg kg-1 level) to 15.5%
(for Cr in sample B) and 1.7% (also for Cd in sample B) to 16.8% (for Mn in sample A), respectively. For Cd in CNT sample B it was not possible to use DSS-ET AAS due to the high concentration. In general, atomic absorption spectrometry presents limited linear working ranges for most elements.28 The analysis of solid samples
containing high analyte concentrations is limited in this case by the minimum sample amount applicable and by the relative sensitivity of available spectral lines. Moreover, solid samples are very dificult to dilute and assuring suitable homogeneity. This possibility is also restricted by the low availability of very pure solid diluents with similar particle size distribution and mainly by physical characteristics of the diluents that can be different of the matrix to be diluted. In this way, some approaches for sensitivity decreasing sometimes have to be applied to direct solid sampling analysis for relatively high analyte concentrations, as the use of alternative lines and inert gas low-rate during atomization. In this work, these approaches were used when necessary as can be seen in conditions reported in Tables 2 and 3 (both approaches were used for Al, Cr and Mg).
Regarding to the health concern, results in Table 5 show the necessity to determine metal contaminants in CNT samples once some elements, as Cd and Pb were found at relatively high level. Other elements, such as Al, Cu, Co and Mg, were found in mg kg-1 levels in some samples and,
depending on the industrial application, they can affect the properties of the inal materials.9,10,12
In Table 5 it is possible to see that DSS-ET AAS allowed LODs ranging from 2 to 200 times lower than the values obtained with digestion methods even using ICP-MS which is generally considered as a powerful technique for
the determination of trace elements. Values for LOD were calculated for the maximum applicable sample mass for each method that was 7, 50 and 200 mg for DSS-ET AAS, microwave-assisted wet digestion and MIC, respectively. Using the wet digestion method, solid residues of non decomposed material remained for sample masses higher than 50 mg, which is considered a disadvantage for obtaining low LODs.
In the present work RSDs were relatively low for results obtained by DSS-ETAAS showing that the investigated materials can be considered as homogeneous even using sample masses limited to 7 mg due to the platform sample mass capacity. It is important to mention that the proposed DSS-ET AAS method does not require a previous time consuming sample treatment then allowing the reduction of analyte losses and contamination risks. On the other hand, residues generation and manipulation of concentrated acids conventionally used in decomposition methods can be avoided in DSS-ET AAS.
Conclusions
The increasing use of carbon nanotubes especially in industry and medicine requires the development of suitable analytical methods for the determination of metal impurities in this kind of material. The proposed DSS-ET AAS method showed to be suitable for this purpose. Eight elements could be determined in CNTs with calibration performed using aqueous standard solutions, without the use of chemical modiiers and with a relatively high sample mass (7 mg). Especially when considering analysis time, simplicity, reagents consumption, residues generation and achievable low limits of detection, DSS-ET AAS can be considered as an advantageous method for quality control of metal impurities in CNTs.
Supplementary Information
Supplementary information data (Figures S1-S3) are available free of charge at http://jbcs.sbq.org.br as a PDF ile.
Acknowledgments
References
1. Iijima, S.; Nature 1991, 354, 56.
2. Burchell, T. D.; Carbon Materials for Avanced Technologies; Elsevier Science: Oxford, 1999.
3. Lin, Y.; Taylor, S.; Li, H.; Fernando, K. A. S.; Qu, L.; Wang, W.; Gu, L.; Zhou, B.; Sun, Ya-P.; J. Mater. Chem. 2004, 14, 527. 4. Misra, R.; Acharya, S.; Sahoo, S. K.; Drug Discovery Today
2010, 15, 842.
5. Trojanowicz, M.; Trends Anal. Chem. 2006, 25, 480. 6. Merkoçi, A.; Microchim. Acta2006, 152, 157.
7. Valcárcel, M.; Cárdenas, S.; Simonet, B. M.; Moliner-Martínez, Y.; Lucena, R.; Trends Anal. Chem. 2008, 27, 34.
8. Dresselhaus, M. S.; Dresselhaus, G.; Eklund, P. C; Science of Fullerenes and Carbon Nanotubes; Academic Press: San Diego, 1996.
9. Tasis, D.; Tagmatarchis, N.; Bianco, A.; Prato, M.; Chem. Rev.
2006, 106, 1105.
10. Braun, T.; Rausch, H.; Biró, L. P.; Konya, Z.; Kiricsi, I.; J. Radioanal. Nucl. Chem. 2004, 262, 31.
11. Hou, P.-X.; Liu, C.; Cheng, H.-M.; Carbon 2008, 46, 2003. 12. Ismail, A. F.; Goh, P. S.; Tee, J. C.; Sanip, S. M.; NANO 2008,
3, 127.
13. Pumera, M.; Langmuir 2007, 23, 6453.
14. Banks, C. E.; Crossley, A.; Salter, C.; Wilkins, S. J.; Compton, R. G.; Angew. Chem., Int. Ed. 2006, 45, 2533.
15. Liu, X.; Guo, L.; Morris, D.; Kane, A. B.; Hurt, R. H.; Carbon
2008, 46, 489.
16. Dawan, A.; Sharma, V.; Anal. Bioanal. Chem. 2010, 398, 589. 17. Lam, C. W.; James, J. T.; McCluskey, R.; Arepalli, S.; Hunter,
R. L.; Crit. Rev. Toxicol. 2006, 36, 189.
18. Hurt, R. H.; Monthioux, M.; Kane, A. B.; Carbon 2006, 44, 1028. 19. Ishikuro, M.; Sato, Y.; Tohji, K.; Wagatsuma, K.; Bunseki
Kagaku 2006, 55, 117.
20. Ge, C.; Lao, F.; Li, Wri, Chen, C.; Qiu, Y.; Mao, X.; Li, Bai.; Chai, Z.; Zhao, Y.; Anal. Chem. 2008, 80, 9426.
21. Todolí, J.-L.; Mermet, J.-M.; Spectrochim. Acta, Part B1999, 54, 895.
22. Matusiewicz, H. In Comprehensive Analytical Chemistry. Sample Preparation for Trace Element Analysis; Mester , Z.; Sturgeon, R., eds.; Elsevier: Amsterdam, 2003, ch. 6. 23. Yang, K. X.; Kitto, M. E.; Orsini, J. P.; Swami, K.; Beach, S.
E.; J. Anal. At. Spectrom. 2010, 25, 1290.
24. Mortari, S. R.; Cocco, C. R.; Bartz, F. R.; Dressler, V. L.; Flores, E. M. M.; Anal. Chem. 2010, 82, 4298.
25. Pereira, J. S. F.; Antes, F. G.; Diehl, L. O.; Knorr, K. L.; Mortari, S. R.; Dressler, V. L.; Flores, E. M. M.; J. Anal. At. Spectrom.
2010, 25, 1268.
26. Trevizan, L. C.; Donati, G. L.; Nogueira, A. R. A.; Nóbrega, J. A. In Trends in Sample Preparation; Arruda, M. A. Z. ed; Nova Science Publishers: New York, 2006, ch. 2.
27. Kurfürst, U.; Solid Sample Analysis - Direct and Slurry Sampling using GF-AAS and ETV-ICP; Springer: Berlin, 1998. 28. Welz, B.; Sperling, M.; Atomic Absorption Spectrometry; 3rd
ed.; Wiley-VCH: Weinheim, 1999.
29. Flores, E. M. M.; Costa, A. B.; Barin, J. S.; Dressler, V. L.; Paniz, J. N. G.; Martins, A. F.; Spectrochim. Acta, Part B2001, 56, 1875.
30. Flores, E. M. M.; Paniz, J. N. G.; Saidelles, A. P. F.; Müller, E. I.; Costa, A. B.; J. Anal. At. Spectrom. 2003, 18, 769. 31. Lucic, M.; Krivan, V.; Fresenius J. Anal. Chem. 1998, 13, 1133. 32. Schäffer, U.; Krivan, V.; Fresenius J. Anal. Chem. 2001, 371,
859.
33. Mattos, J. C. P.; Flores, E. M. M.; Krivan V.; J. Anal. At. Spectrom. 2008, 23, 931.
34. Silva, C. S.; Nomura, C. S.; Nóbrega, J. A.; Oliveira, P. V.; Microchim. Acta 2008, 161, 109.
35. Rodrigues, L. F.; Mattos, J. C. P.; Dressler, V. L.; Pozebon, D.; Flores, E. M. M.; Spectrochim. Acta, Part B 2007, 62, 933. 36. Krivan, V.; Janickova, P.; Anal. Bioanal. Chem. 2005, 382, 1949. 37. Barth, P.; Hassler, J.; Kudrik, I.; Krivan, V.; Spectrochim. Acta,
Part B 2007, 62, 924.
38. Resano, M.; Briceño, J.; Belarra, M. A.; Spectrochim. Acta, Part B2009, 64, 520.
39. Belarra, M. A.; Resano, M.; Vanhaecke, F.; Moens, L.; Trends Anal. Chem.2002, 21, 828.
40. Vale, M. G. R; Oleszezuk, N.; Santos, W. N. L.; Appl. Spectrosc. Rev. 2006, 41, 377.
41. Nomura, C. S.; Oliveira, P. V. In Trends in Sample Preparation; Arruda, M. A. Z. ed; Nova Science Publishers: New York, 2006, ch. 1.
42. Nomura, C. S.; Silva, C. S.; Oliveira, P. V.; Quim. Nova 2008, 31, 104.
43. PerkinElmer-SCIEX; Elan Version 3.0, Software Guide, 1006920 A, Thornhill, Canada, 2003.
44. Optima 4000 Series Hardware Guide, 0993-6376, Shelton, USA, 2002.
45. Duarte, F. A.; Pereira, J. S. F.; Barin, J. S.; Mesko, M. F.; Dressler, V. L.; Flores, E. M. M.; Knapp, G.; J. Anal. At. Spectrom. 2009, 24, 224.
46. Pereira, J. S. F.; Diehl, L. O.; Duarte, F. A.; Santos, M. F. P.; Guimarães, R. C. L.; Dressler, V. L.; Flores, E. M. M.; J. Chromatogr., A2008, 1213, 249.
47. Huang, M. D.; Krivan, V.; Fresenius J. Anal. Chem. 2000, 368, 227.
Submitted: December 31, 2010 Published online: February 10, 2011
Supplementary Information
S
I
J. Braz. Chem. Soc., Vol. 22, No. 6, S1, 2011. Printed in Brazil - ©2011 Sociedade Brasileira de Química 0103 - 5053 $6.00+0.00
*e-mail: [email protected]
Determination of Metal Impurities in Carbon Nanotubes by Direct Solid Sampling
Electrothermal Atomic Absorption Spectrometry
Paola A. Mello, Luiz Frederico Rodrigues, Matheus A. G. Nunes, Julio Cezar P. Mattos, Edson I. Müller, Valderi L. Dressler and Erico M. M. Flores*
Departamento de Química, Universidade Federal de Santa Maria, 97105-900 Santa Maria-RS, Brazil and Instituto Nacional de Ciência e Tecnologia de Bioanalítica, Campinas-SP, Brazil
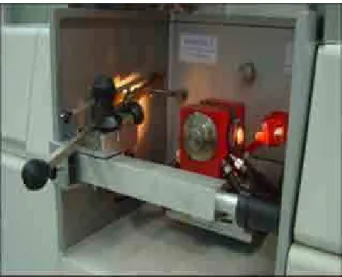
Figure S1. In detail, atomic absorption spectrometer (Model AAS 5 EA, Analytik Jena, Germany) showing the manual sample introduction system (Model SSA 5) for DSS-ET AAS, during atomization step (2500 °C) used for determination of metal impurities in carbon nanotubes.
Figure S2. Carbon nanotube sample (about 7 mg) weighed onto sample platform before DSS-ET AAS heating program.
Figure S3. Aspect of graphite platform after DSS-ET AAS heating program for CNT: drying at 130 °C (30 s, heating rate of 10 °C s-1, argon
low-rate 0.5 L min-1), pyrolysis at 1400 °C (30 s, heating rate of 50 °C s-1,
argon low-rate 0.5 L min-1), atomization at 2500 °C (10 s, heating rate
of 3000 °C s-1, argon low-rate 0.5 L min-1). After heating program the