STRUCTURE AND DYNAMICS OF THE MACROBENTHIC
COMMUNITIES OF UBATUBA BAY,
SOUTHEASTERN BRAZILIAN COAST
Maria Fernanda Lopes dos Santos* & Ana Maria S. Pires-Vanin**
Instituto Oceanográfico da Universidade de São Paulo (Praça do Oceanográfico 191, 05508-900, São Paulo, SP, Brasil)
*[email protected] - **[email protected]
A
B S T R A C TSpecies composition, distribution, density, biomass, diversity and trophic relationships of the macrobenthic communities in Ubatuba Bay, southeastern Brazilian coast, were investigated seasonally from August 1995 to June 1996. Sampling was carried out at 9 stations of between 4 and 13 m depth and taken in duplicate with a 0.1m² van Veen grab. Two hundred and five macrofaunal species were identified, presenting low dominance and frequency. Polychaetes and nematodes dominated, representing 89% of the whole fauna. Spatial variations in the structure of the communities were correlated to sediment type whereas seasonal variations were correlated to the increase in wave size and current disturbance over the substrate during the rainy period. Carnivore and surface deposit-feeder polychaetes were dominant, totalling 81% of the species. Mean grain size, fine sand, very fine sand, silt and clay contents were among the main factors related to the patterns of macrofaunal distribution, density and diversity and to the dominance of trophic groups. Multivariate analysis showed that the area may be divided into two groups of stations each of them characterized, respectively, by the presence of Magelona papillicornis and Mediomastus capensis.
R
E S U M OA composição, distribuição, densidade, biomassa, diversidade e relações tróficas das comunidades macrobênticas da Enseada de Ubatuba, costa sudeste brasileira, foram estudadas sazonalmente, de agosto de 1995 a junho de 1996. As amostragens foram realizadas em 9 estações de coleta, situadas entre 4 e 13 m de profundidade, e obtidas em duplicata com pegador de fundo van Veen de 0,1 m² de área amostral. Duzentas e cinco espécies macrobênticas foram obtidas, a maioria apresentando baixa dominância e freqüência. Poliquetas e nemátodes dominaram, representando 89% da fauna total. As variações espaciais na estrutura das comunidades foram correlacionadas ao tipo de sedimento, ao passo que as variações temporais o foram com o aumento da perturbação causada pelas ondas e correntes sobre o substrato durante o período de chuvas. Poliquetas carnívoros e detritívoros foram dominantes, totalizando 81% das espécies. O diâmetro médio das partículas, conteúdo de areia fina, areia muito fina, silte e argila estiveram entre os principais fatores relacionados aos padrões de distribuição da fauna, densidade, diversidade e com a dominância dos grupos tróficos. Análises multivariadas mostraram que a área de estudo pode ser dividida em dois grupos de estações, caracterizados, respectivamente, pela presença de Magelona papillicornis e Mediomastus capensis.
Descriptors: Benthic community, Trophic groups, Benthic ecology, Ubatuba Bay.
Descritores: Comunidade bêntica, Grupos tróficos, Ecologia bêntica, Enseada de Ubatuba.
I
NTRODUCTIONMost of the studies on marine macrobenthic communities have been conducted in north temperate regions, and the knowledge of community structure is based largely on these results. By contrast, the tropical macrobenthos is less well-known, especially the South Atlantic fauna. As the structure of benthic communities has been used in monitoring programmes
__________
Contr. No. 857 do Inst. oceanogr. da Usp.
on pollution-effects, it is of great importance to establish baselines for tropical regions (Warwick &
Ruswahyuni, 1987), since comparisons with data from temperate areas are conflicting.
Coastal zones are variable environments, directly subject to continental, atmospheric and oceanic influences. The instability of the coastal zone affects the benthic community, determining the patterns of distribution and density and the trophic relationships among the species.
1970; Weinberg, 1984) and abiotic factors such as depth (Hyland et al., 1991), current speed (Wildish & Peer, 1983; Moller et al., 1985), salinity (Jones et al., 1986), temperature (Persson, 1982), sediment type (Gray, 1974: Weston, 1988), organic loading (Dauer & Conner, 1980) and disturbance (Probert, 1984; Hall et al., 1992; Hall, 1994). Much research effort has been concentrated on studies dealing with the effects of multiple environmental factors in structuring the communities (Aschan, 1990; Pires-Vanin, 1993; Bachelet et al., 1996; Santos & Pires-Vanin, 1999). Other studies have sought to establish an index that integrates macrobenthic community structure in terms of response to habitat characteristics (Paiva, 1993; Engle et al., 1994).
The analysis of the trophic structure of benthic communities is a useful way to determine the main energy flow at the ecosystem level. However, in the tropical zone this kind of study is more complex since a large number of species are present and are frequently represented by only a few individuals. The high biological diversity obscures the recognition of specific food webs responsible for the larger part of the energy flow (Paiva, 1993).
In the past two decades, several studies have been conducted on the Ubatuba continental shelf of the southeastern Brazilian coast, in the attempt to understand the dynamics of the benthic system. Some of them deal with the structure of benthic communities (Amaral, 1980; Pires, 1992; Pires-Vanin, 1993; Sumida & Vanin, 1997; Santos & Pires-Vanin, 1999), and others have investigated the trophic relationships of polychaete associations (Paiva, 1993; Muniz et al., 1998, Muniz & Pires, 1999). However, our knowledge of the structure of benthic communities off the Ubatuba shore is still scanty. The existing only works are those of Sumida et al. (1993) and Muniz et al. (1996) on Fortaleza Bay and the Mar Virado Bay, respectively, and deal with the distribution and diversity of the whole macrobenthic fauna, polychaetes included.
The present study deals with the structure of macrobenthic communities in Ubatuba Bay. It investigates seasonally the species composition, distribution, abundance, biomass, diversity and species richness of macrobenthos, determines the trophic structure of polychaetes and evaluates the changes in the patterns formed in relation to the oceanographic and meteorological characteristics of the area. Also, as the region is subject to a constant anthropic impact this study constitutes a baseline for future monitoring programmes in the area, besides filling up the previously existing gap between our knowledge of the shelf and shelf break areas already studied (Paiva, 1993; Petti et al., 1996; Santos
& Pìres-Vanin, 1999; Sumida & Pires, 1997) and the almost unknown near shore.
S
TUDYA
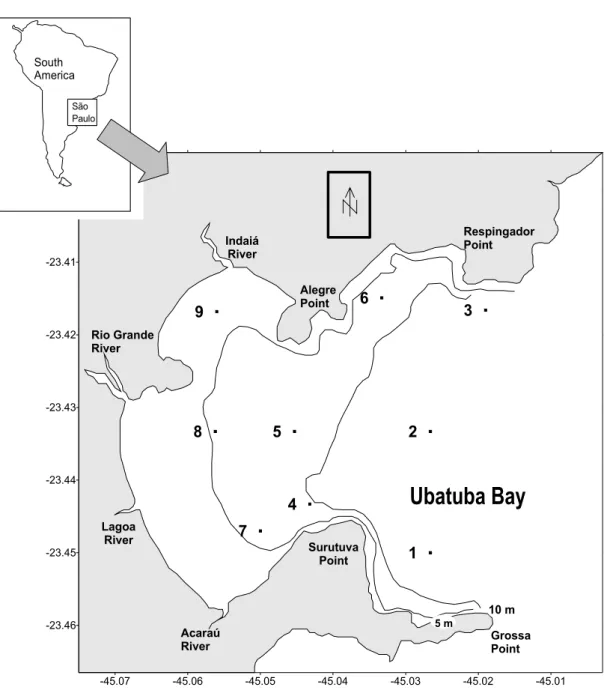
REAUbatuba Bay is one of the several bays of the northern sector of the coast of São Paulo State, southeastern Brazil. However, it differs from the others in including the harbor of Ubatuba City itself,a touristic centre affected by increasing anthropic influence. The study area is located between 23°25’S - 23°27’S and 45°01’W - 45°03’W and varies from 4 to 16 m in depth (Fig. 1). It is eastward-facing and is protected from the southerly and southwesterly waves arising on the open sea, and has an outlet between Respingador Point and Grossa Point. It may be divided into an inner and an outer part, the inner part extending from the coastline to 10 m depth, characterized by weak hydrodynamic movement; the outer part laying between 10 and 16 m depth and influenced by currents and waves from the open sea.
Due the proximity of the Serra do Mar (the coastal mountain range) the bay receives an considerable continental flux of particulate material that spreads over the bottom and may be reworked and resuspended by waves and local currents. The principal intrusion of water in the area occurs from the south, near Grossa Point, and presents a circular, clockwise motion (Mahiques, 1995). This movement creates a large central zone where finer sediments are deposited.
Two different water masses are present in the Ubatuba coastal region throughout the year. During spring and summer, the cold and dense South Atlantic Central Water (SACW) intrudes inshore from the shelf break near the bottom and gives rise to a strong thermocline in midwater. At the same time the warm and light Coastal Water (CW) is compressed along the coast by northeasterly winds, filling the surface layer. In autumn and winter, the SACW retreats offshore and is replaced by CW (Castro Filho et al., 1987).
This seasonal water mass dynamics occur on the southern Brazilian shelf and as SACW is rich in nutrients it eutrophicates shallow areas, enhancing the organic material available to the benthic communities (Pires, 1992).
-45.07 -45.06 -45.05 -45.04 -45.03 -45.02 -45.01 -23.46
-23.45 -23.44 -23.43 -23.42 -23.41 -23.40
1
2
3
4
5
6
7
8
9
Ubatuba Bay
Indaiá River
Rio Grande River
Lagoa River
Acaraú
River GrossaPoint
Respingador Point
5 m
10 m Alegre
Point
Surutuva Point
Fig. 1. Location of the sampling sites in Ubatuba Bay, São Paulo State, southeastern Brazil.
M
ATERIAL ANDM
ETHODSSampling was carried out at 9 stations located on 3 transects between 4 and 13 m depth, every two months - August (winter), October (early spring), December (late spring), February (summer), April (autumn) and June (winter), from August 1995 to June 1996 (Fig. 1). Some stations were located in the inner area of the bay (4, 5, 7, 8, 9) and some in the outer area (1, 2, 3, 6).
At each station and in each sampling period the benthic macrofauna was collected in duplicate with a 0.1 m² van Veen grab. Sediment samples were washed with water through three sieves of 2.0, 1.0 and 0.5 mm mesh screen, respectively, and fixed in 70% alcohol. After that the sediment was washed again in an elutriator (Santos et al., 1996), and the resulting material was sorted under a stereomicroscope. The organisms obtained were counted and identified to species level.
South America
Surface and bottom temperatures and salinity were obtained at each station in each sampling period. The salinity was measured using an inductive salinometer, and the non-dimensional Practical Salinity Unity (PSU) was employed. Dissolved oxygen content was determined by the Winkler titration method (Strickland & Parsons, 1968).
Sediment samples were collected for textural analysis. Grain size was determined by sieving and pipetting techniques (Suguio, 1973). Folk and Ward´s parameters (Folk & Ward, 1957) were obtained for granulometric classification. The quantity of CaCO3
and total organic matter in the sediment were measured by acid dissolution and oxidation with H2O2, respectively (Gross, 1971).
As the Mann-Whitney Test (Siegel, 1956) showed significant differences between the duplicates sampled by grab, the number of individuals obtained by both catches was summed up and density is expressed as number of individuals per 0.2 m². Species richness, according to Margalef´s index (S), diversity (Shannon´s index H´), evenness (Pielou´s index J) and biomass were also evaluated. Biomass was obtained as wet weight (shells included) and expressed in grams per 0.2 m².
Species of polychaetes were classified into trophic groups based on Fauchald & Jumars (1979), Gambi & Giangrande (1985) and Gaston (1987). Five feeding modes were considered, as follows: carnivores (C), surface deposit-feeders (S), subsurface-deposit feeders (B), suspension-feeders (F) and omnivores (O). Anyspecies classified in more than one trophic group was included in both. The feeding guild approach allows different species with similar roles in the food web to be grouped together. It classifies them as “ecological units” and may replace species in functional studies (Paiva, 1993).
To evaluate the degree of ecological importance of each trophic group in the sampling station the Trophic Group Importance Index (Ti) has been employed (Paiva, 1993; Muniz & Pires, 1999). This index reduces the importance of density by applying log transformation of abundance and thus preserving the species richness factor (Paiva, 1993).
Pearson´s linear correlations between density, diversity, species richness, biomass and trophic groups and the abiotic variables were calculated after data standardization [x = (x-xmed /s)], with a significance level of 0.05.
Cluster Analysis (Q-mode and R-mode), Multiple Discriminant Analysis, Principal Component Analysis (PCA) and Stepwise Multiple Linear Regression Analysis (SMLR) were employed to identify and interpret the spatial and temporal changes in the macrobenthic communities. Clusters were calculated employing the Weighted Pair-Group
Method (WPGMA) and Morisita-Horn, similarity coefficient (Sneath & Sokal, 1973).
The abiotic variables were standardized before performing Multiple Discriminant Analysis. The stations’ scores obtained in PCA were considered as dependent variables and abiotic factors as independent variables in the Stepwise Multiple Linear Regression.
R
ESULTSEnvironmental Variables
Thirteen variables were analyzed for the study area: depth, temperature, salinity, dissolved oxygen, sedimentary organic matter, sedimentary CaCO3,
mean grain size, coarse sand, medium sand, fine sand, very fine sand, silt and clay.
The bottom water temperature varied between 21.1°C (austral winter) and 34.5°C (austral summer), while it was around 22°C during the rest of the year. The bottom salinity values ranged from 32.8 (autumn) to 35.0 (early spring and summer) and showed no temporal or spatial pattern.
The warm and low saline Coastal Water (CW) predominated in the area during the study period. In general, a thermal homogeneity was observed, with warmer water occurring in the shallow zone, near stations 3, 6 and 9. However, at the end of spring (December) the cold and dense South Atlantic Central Water (SACW) was detected mixed with the CW at 13 m depth (station 2) lowering the water temperature.
The dissolved oxygen content varied between 3.51 ml/l (station 3 – austral summer) and 5.35 ml/l (station 4 – austral winter). The sedimentary organic matter (0.62 - 4.00%) presented higher values in the middle part of the area, near stations 4, 5 and 9. The sedimentary CaCO3 content increased
towards the south, and values above 50% were obtained at station 1.
Table 1. Values of density (nº ind./0.2 m2), biomass (g/0.2 m2 – wet weigth), diversity (H´), species richness (S) and eveness (J)
at 9 stations for the period of study. W = winter 1995; ES = early spring; LS = late spring; Wi = winter 1996.
Station Density Biomass H' S J' Station Density Biomass H' S J'
Austral Winter 1995 Austral Summer
W1 527 4.674 3.30 48 0.50 S1 313 13.103 3.88 42 0.72
W2 188 17.020 3.05 27 0.64 S2 53 6.474 3.36 17 0.82
W3 334 1.143 2.04 17 0.50 S3 9 0.326 2.72 7 0.97
W4 259 5.712 2.98 25 0.81 S4 74 8.753 1.50 14 0.95
W5 33 0.805 3.64 17 0.89 S5 13 1.332 2.35 7 0.84
W6 74 0.804 2.18 13 0.47 S6 4 0.893 2.69 3 0.71
W7 176 5.749 2.91 27 0.61 S7 150 12.019 2.99 21 0.68
W8 265 14.587 3.14 28 0.65 S8 149 14.841 3.69 25 0.79
W9 124 4.576 3.37 19 0.79 S9 4 0.302 0.00 1 0.00
Early Spring Autumn
ES1 395 1.756 3.36 36 0.65 A1 851 7.325 3.27 60 0.55
ES2 183 21.262 2.96 24 0.65 A2 637 15.616 1.92 26 0.41
ES3 155 0.336 2.83 16 0.71 A3 18 0.043 3.12 10 0.94
ES4 235 6.668 3.6 31 0.83 A4 372 6.395 2.10 51 0.70
ES5 124 0.956 3.08 14 0.81 A5 9 0.066 1.97 4 0.99
ES6 86 0.181 3.12 20 0.63 A6 113 0.055 4.15 8 0.73
ES7 106 7.528 3.39 22 0.76 A7 117 5.614 3.24 20 0.75
ES8 322 15.654 3.92 41 0.73 A8 181 29.073 3.55 21 0.81
ES9 1404 1.724 1.10 21 0.25 A9 15 0.001 1.90 5 0.82
Late Spring Austral Winter 1996
LS1 344 4.576 3.57 43 0.66 Wi1 492 7.279 3.28 46 0.59
LS2 345 9.301 2.59 25 0.56 Wi2 194 5.267 3.11 26 0.66
LS3 88 0.767 3.19 14 0.84 Wi3 12 0.056 2.62 7 0.93
LS4 131 5.577 1.84 24 0.79 Wi4 401 8.553 1.97 38 0.85
LS5 47 0.224 3.21 12 0.90 Wi5 18 0.174 2.10 6 0.81
LS6 29 0.143 3.60 5 0.79 Wi6 23 0.096 3.09 5 0.59
LS7 201 11.948 3.06 29 0.63 Wi7 401 17.397 3.33 37 0.64
LS8 95 17.677 3.64 23 0.80 Wi8 352 16.186 3.62 33 0.72
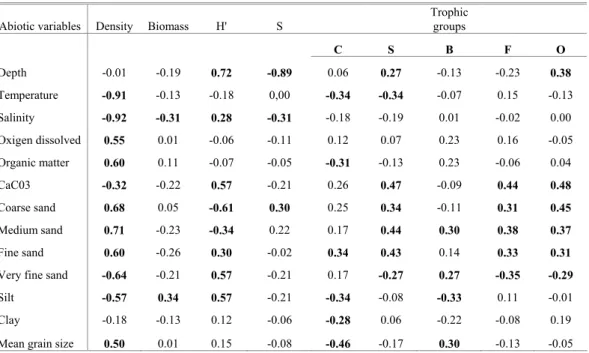
Table 2. Pearson linear correlation between density (nº ind./0.2 m2), diversity (H´), species richness (S), biomass (g/0.2 m2),
throphic groups and abiotic variables. Significant values are in bold.
Abiotic variables Density Biomass H' S
Trophic
groups
C S B F O
Depth -0.01 -0.19 0.72 -0.89 0.06 0.27 -0.13 -0.23 0.38
Temperature -0.91 -0.13 -0.18 0,00 -0.34 -0.34 -0.07 0.15 -0.13
Salinity -0.92 -0.31 0.28 -0.31 -0.18 -0.19 0.01 -0.02 0.00
Oxigen dissolved 0.55 0.01 -0.06 -0.11 0.12 0.07 0.23 0.16 -0.05
Organic matter 0.60 0.11 -0.07 -0.05 -0.31 -0.13 0.23 -0.06 0.04
CaC03 -0.32 -0.22 0.57 -0.21 0.26 0.47 -0.09 0.44 0.48
Coarse sand 0.68 0.05 -0.61 0.30 0.25 0.34 -0.11 0.31 0.45
Medium sand 0.71 -0.23 -0.34 0.22 0.17 0.44 0.30 0.38 0.37
Fine sand 0.60 -0.26 0.30 -0.02 0.34 0.43 0.14 0.33 0.31
Very fine sand -0.64 -0.21 0.57 -0.21 0.17 -0.27 0.27 -0.35 -0.29
Silt -0.57 0.34 0.57 -0.21 -0.34 -0.08 -0.33 0.11 -0.01
Clay -0.18 -0.13 0.12 -0.06 -0.28 0.06 -0.22 -0.08 0.19
Mean grain size 0.50 0.01 0.15 -0.08 -0.46 -0.17 0.30 -0.13 -0.05
Benthic Fauna
Of the 205 macrobenthic species identified, Mollusca (70 species) and Crustacea (69 species) were the most diverse groups. They were followed by Polychaeta (40 species) and Echinodermata (14 species). Gastropoda represented 93% of the total species of Mollusca, whereas Brachyura accounted for 68% of the Crustacea Decapoda and Amphipoda for 48% of the Crustacea Peracarida.
According to Guille’s criteria (1970), for the overall study period the rarer species comprised 81% (166 species), 35 species were classified as common (17%), and 4 species (2%) were constant. Among the rarer species were Exogone arenosa (9.3%), Corbula caribaea (8.3%), Apseudes paulensis (5.6%); among the common species, Cirrophorus branchiatus (34.3%), Mediomastus capensis (30%), Palythoa cf.variabilis (14.8%), and the constant species, Magelona papillicornis (80.5%), Parandalia tricuspis (68.5%) and Glycinde multidens (59.3%).
During the study period a total of 21,766 individuals were obtained with a mean density of 403 ind./0.2 m2. Lower mean values occurred in the austral summer (86 ind./0.2m2) and higher mean values in early spring (335 ind./0.2m2). Polychaeta (a total of 9,984 individuals) and Nematoda (a total of 9,153 individuals) were the most abundant groups, followed by Mollusca (778 ind.), Crustacea (605 ind.),
Echinodermata (437 ind.), Sipuncula (320 ind.) and Coelenterata (268 ind.).
Table 1 shows the structural community variables analyzed at each sampling station. Generally higher values of density occurred at station 1, where Magelona papillicornis, Owenia fusiformis, Thysanocardia catharinae, Eunice prayensis dominated. However, the highest values were observed at station 9 in early and late spring, when Mediomastus capensis reached 1,266 ind./0.2m² and 1,005 ind./0.2m², respectively. The density was positively correlated with sand (coarse, medium and fine sand), sedimentary organic matter, dissolved oxygen and mean grain size and was negatively related to salinity, temperature, very fine sand, silt and sedimentary CaCO3 (Table 2).
The total number of species varied seasonally with the lowest value in the austral summer (137 species at 9 stations) and the maximum value in early spring (225 species at 9 stations), and was positively correlated with percentage of coarse sand and negatively with depth and salinity (Tables 1 and 2).
of diversity were present especially at station 1 where Magelona papillicornis, Eunice prayensis, Owenia fusiformis and Thysanocardia catharinae were evenly distributed. Diversity values were positively correlated with depth, finer sediment, salinity and sedimentary CaCO3,and negatively correlated with coarser grains
(Table 2).
A total of 310.77g were obtained for the macrobenthic organisms with a medium number of 5.75g/ 0.2m2. The biomass values showed slight variation, ranging from 5.82g/ 0.2m2 (late spring) to 7.13g/ 0.2m2 (autumn). In general, high values occurred at stations 2 and 8 where large sized organisms were present. Species such as Notomastus lobatus and Parandalia tricuspis (Polychaeta), Amphiodia atra and Hemipholis elongata (Ophiuroidea), Periploma compressa and Tellina alternata (Bivalvia) and Pinnixa rapax (Crustacea) contributed to the increase in biomass at both stations. Low values were found mainly at station 9 where the small species Mediomastus capensis dominated. Biomass values were positively correlated with silt and negatively with salinity (Table 2).
Trophic Structure of the Polychaetes
Deposit-feeders, represented by surface feeders (S) (34%) and subsurface deposit-feeders (B) (15%), were dominant in the area, followed by carnivores (C) (39%), suspension-feeders (F) (6%) and omnivores (O) (6%).
The surface deposit-feeders were Spiophanes missionensis, Magelona papillicornis, Magelona variolamellata and Owenia fusiformis. These species presented higher values for the Trophic Index at station 1 in the austral winter, early and late spring and autumn. Station 1 is situated on fine sand and silt, with a high coarse and medium sand content. In general, this group of species dominated throughout the period of study and presented higher percentages in autumn (37%) and the austral winter (June) (39%). It was positively correlated with sedimentary CaCO3, coarse sand and negatively with very fine
sand (Table 2).
The subsurface deposit-feeder group consisted of Mediomastus capensis, Notomastus lobatus, Scoloplos (Leodamas) ohlini, Scoloplos (Scoloplos) sp. and Euclymene sp. The group was the third most important in Ubatuba Bay, with higher percentages in autumn (20%) and late spring (18%), when Mediomastus capensis dominated. It correlated negatively with temperature, coarse sand and sedimentary CaCO3 (Table 2).
Carnivores were represented by Parandalia tricuspis, Glycinde multidens, Eunice prayensis, Ancystrosyllis jonesi, Diopatra cf. cuprea, Diopatra
tridentata, Glycera americana, Nephtys simoni and Sigambra grubii. This is an important group in the study area, with higher values of the Trophic Index at stations 1 (austral winter, early spring and autumn), 8 (early spring) and 9 (late spring) and was especially abundant during the austral winter (43%), early spring (43%), late spring (42%) and austral summer (37%). It showed positive correlation with fine sand and negative correlation with mean grain size, temperature, silt, clay and sedimentary organic matter (Table 2).
Suspension-feeders were consisted of Spiochaetopterus costarum and Owenia fusiformis (both also surface deposit-feeder). This group presented a high Trophic Index at stations 1 (early and late spring), 7 (late spring, autumn and austral winter) and 8 (austral winter), and was relatively more numerous only in summer (11%). It correlated positively with sedimentary CaCO3 and coarse sand
and negatively with very fine sand (Table 2).
The omnivores showed very low Trophic Index values, associated with both small numbers of species and abundance. The group was represented by Neanthes bruaca, Neanthes succinea and Nereis (Nereis) sp. and presented no relation to sediment type. A high Trophic Index occurred at stations 1 (autumn and austral winter), 2 (autumn and austral winter) and 5 (early spring) and was correlated positively with sedimentaryCaCO3, coarse sand and
depth and negatively with very fine sand (Table 2).
Faunal Dynamics
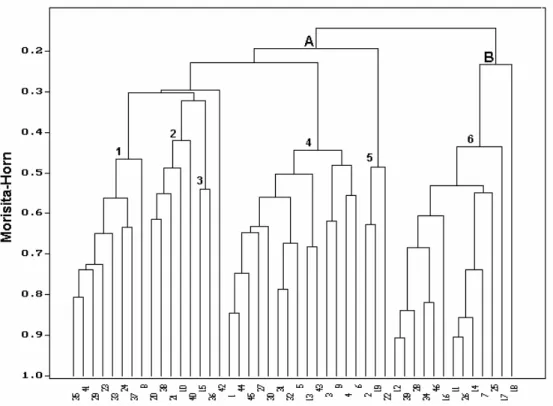
The dendrogram among stations (Q-mode) showed two distinct groups in the first branch, both related to the presence of Magelona papillicornis and Mediomastus capensis, respectively (groups A and B) (Table 3; Fig. 2). Group A includes stations located in the middle and southern parts of Ubatuba Bay (stations 1, 2, 4, 7 and 8), with a mean temperature of 24.7 °C, sediment composed of silt and a significant percentage of CaCO3, coarse and medium sand, and
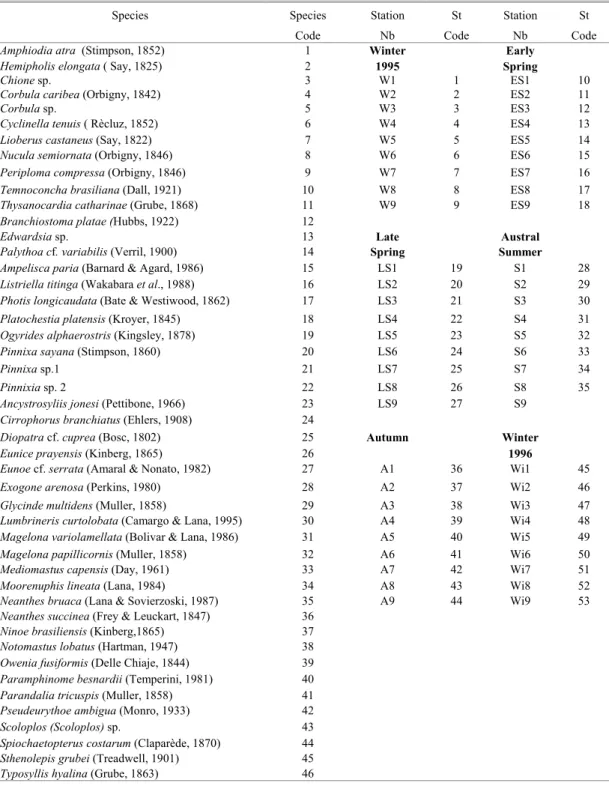
Table 3. List of species and sampling stations with their respective code numbers included in Cluster Analysis and Principal Components Analysis.
Species Species Station St Station St
Code Nb Code Nb Code
Amphiodia atra (Stimpson, 1852) 1 Winter Early
Hemipholis elongata ( Say, 1825) 2 1995 Spring
Chione sp. 3 W1 1 ES1 10
Corbula caribea (Orbigny, 1842) 4 W2 2 ES2 11
Corbula sp. 5 W3 3 ES3 12
Cyclinella tenuis ( Rècluz, 1852) 6 W4 4 ES4 13
Lioberus castaneus (Say, 1822) 7 W5 5 ES5 14
Nucula semiornata (Orbigny, 1846) 8 W6 6 ES6 15
Periploma compressa (Orbigny, 1846) 9 W7 7 ES7 16
Temnoconcha brasiliana (Dall, 1921) 10 W8 8 ES8 17
Thysanocardia catharinae (Grube, 1868) 11 W9 9 ES9 18
Branchiostoma platae (Hubbs, 1922) 12
Edwardsia sp. 13 Late Austral
Palythoa cf. variabilis (Verril, 1900) 14 Spring Summer
Ampelisca paria (Barnard & Agard, 1986) 15 LS1 19 S1 28
Listriella titinga (Wakabara et al., 1988) 16 LS2 20 S2 29
Photis longicaudata (Bate & Westiwood, 1862) 17 LS3 21 S3 30
Platochestia platensis (Kroyer, 1845) 18 LS4 22 S4 31
Ogyrides alphaerostris (Kingsley, 1878) 19 LS5 23 S5 32
Pinnixa sayana (Stimpson, 1860) 20 LS6 24 S6 33
Pinnixa sp.1 21 LS7 25 S7 34
Pinnixia sp. 2 22 LS8 26 S8 35
Ancystrosyliis jonesi (Pettibone, 1966) 23 LS9 27 S9
Cirrophorus branchiatus (Ehlers, 1908) 24
Diopatra cf. cuprea (Bosc, 1802) 25 Autumn Winter
Eunice prayensis (Kinberg, 1865) 26 1996
Eunoe cf. serrata (Amaral & Nonato, 1982) 27 A1 36 Wi1 45
Exogone arenosa (Perkins, 1980) 28 A2 37 Wi2 46
Glycinde multidens (Muller, 1858) 29 A3 38 Wi3 47
Lumbrineris curtolobata (Camargo & Lana, 1995) 30 A4 39 Wi4 48 Magelona variolamellata (Bolivar & Lana, 1986) 31 A5 40 Wi5 49
Magelona papillicornis (Muller, 1858) 32 A6 41 Wi6 50
Mediomastus capensis (Day, 1961) 33 A7 42 Wi7 51
Moorenuphis lineata (Lana, 1984) 34 A8 43 Wi8 52
Neanthes bruaca (Lana & Sovierzoski, 1987) 35 A9 44 Wi9 53
Neanthes succinea (Frey & Leuckart, 1847) 36
Ninoe brasiliensis (Kinberg,1865) 37
Notomastus lobatus (Hartman, 1947) 38
Owenia fusiformis (Delle Chiaje, 1844) 39
Paramphinome besnardii (Temperini, 1981) 40
Parandalia tricuspis (Muller, 1858) 41
Pseudeurythoe ambigua (Monro, 1933) 42
Scoloplos (Scoloplos) sp. 43
Spiochaetopterus costarum (Claparède, 1870) 44
Sthenolepis grubei (Treadwell, 1901) 45
Fig. 2. Dendrogram showing the groups of stations formed by Cluster Analysis (Q-mode) for the study area. Stations code numbers are shown in Table 3.
The dendrogram among species (R-mode) showed two groups in the first branch (groups A and B) (Table 3; Fig. 3). Group A has widely distributed species, present at all the stations of the group, such as Parandalia tricuspis. It also presents more abundant species in the middle and northern parts of the area (stations 2, 5, 6, 8 and 9), such as Mediomastus capensis,orin the middle and southern parts (stations 1, 2, 5, 7 and 8), such as Magelona papillicornis. Species from particular stations such as Notomastus lobatus (stations 2 and 4), Amphiodia atra (stations 4, 7 and 8) and Spiochaetopterus costarum (stations 7 and 8) also occur in Group A. Group B is formed of species present only in the southern part of Ubatuba Bay, such as Owenia fusiformis, Thysanocardia catharinae, Branchiostoma platae and Diopatra cf. cuprea.
Multiple Discriminant Analysis was performed in terms of the two main groups in the Q-mode dendrogram (Table 4). The discriminant function 1 accounts for 100% of total variance and distinguishes group A on the negative side of the axis from group B on the positive side. Very fine and fine sand, silt, mean grain size and sedimentary CaCO3 in
positive correlation, and coarse sand in negative correlation contribute greatly to this function.
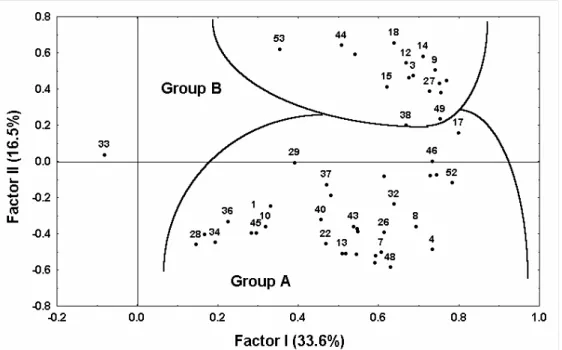
Principal Component Analysis indicated two factors (factor I and II) as responsible for 50.1% of the total explained variance. According to the Stepwise Multiple Linear Regression results, axis I correlated positively to the mean grain size, and negatively to clay, silt, very fine sand, fine sand, sedimentary CaCO3, temperature and salinity. Axis II correlated
positively with mean grain size, coarse sand and fine sand and negatively with silt and clay. The fitted model accounted for 99.6% of the variability of axis I and 98.6% of the variability of axis II. Of the variables analyzed clay accounted for 41.1% of the variability on axis I, and mean grain size for 61.3% of that on axis II (Table 5).
Table 4. Relative percentage of the discriminant function 1 and correlation of abiotic variables. The data were standardized before correlation analysis.
Discriminant Relative Canonical Degrees p Abiotic Correlation
Function Percentage Correlation Freedom Variables r
Depth 0.533
1 100 0.741 13 <0.001 Temperature 1.304
Salinity 1.311
Oxigen dissolved -1.408
Organic matter 0.014
CaC03 5.693
Coarse sand -1.481
Medium sand 1.156
Fine sand 3.105
Very fine sand 8.122
Silt 2.251
Clay 1.315
Mean grain size 6.608
Table 5. Fitted model, partial correlation (r2) and abiotic variables contribution to variabilities in axes I and II of the PCA.
Significant values are in bold.
Axis I Axis II
Abiotic
variables Fitted Partial p Percentage Fitted Partial p Percentage Model Correlation Contribution Model Correlation Contribution
99.6% 98.6%
Depth -0.39 0.0106 0.242 0.1045
Temperature -0.485 0.0011 5.9
Salinity -0.31 0.045 1.0
Oxigen
dissolved -0.085 0.5912 0.149 0.3216
Organic
matter 0.188 0.2095
CaC03 -0.5 0.0007 5.6
Coarse sand 0.125 0.4276 0.621 < 0.001 14.9
Medium sand -0.292 0.5969
Fine sand -0.429 0.0045 2.3 0.458 0.0013 3.4
Very fine
sand -0.507 < 0.001 7.7
Silt -0.549 < 0.001 17.7 -0.558 < 0.001 7.4
Clay -0.641 < 0.001 41.1 -0.322 1.3
Mean grain
size 0.518 < 0.001 11.0 0.783 < 0.001 61.3
Axis II (16.5%) divides Ancystrosyllis jonesi, Cirrophorus branchiatus, Glycinde multidens, Mediomastus capensis and Ninoe brasiliensis on the positive side, from Amphiodia atra, Scoloplos (Scoloplos) sp., Spiochaetopterus costarum, Magelona
Fig. 3. Dendrogram showing groups of species formed by Cluster Analysis (R-mode) for the study area. Species code numbers are shown in Table 3.
Fig. 5. Principal Component Analysis of the stations for the study area. Distribution of stations is shown as a function of the first two axes (Factors I and II).
D
ISCUSSIONThe most important factors responsible for the structure and maintenance of the macrobenthic communities in Ubatuba Bay are linked to sediment granulometry, as has been pointed out by many authors. Weston (1988), studying the benthic macrofauna of the continental shelf off Cape Hatteras, North Carolina, verified that very fine sand, silt and clay were the most important variables in differentiating benthic assemblages. He assumed that the importance of the sediment is, in part, a consequence of its role in determining the type and abundance of food available to deposit-feeders.
The division of Ubatuba Bay into the southern, northern and middle parts, according to the predominance of sand, silt or clay is reflected in the macrofaunal distribution. Of the two dominant species in the area, Magelona papillicornis is widely distributed, despite its considerable dominance in the middle and southern parts, whereas Mediomastus capensis was restricted to the middle and northern parts. Where both species occurred simultaneously, the number of individuals of Mediomastus capensis decreased. In spite of their ability to share the same habitat, both species are present in different levels of the sediment, according to their feeding strategies: M. papillicornis is a surface deposit feeder whereas M. capensis feeds below the surface. However, apparently they are somehow competing for space.
Another view of this problem might focus on the sedimentary oxygen content. Ubatuba Bay presents low levels of oxygen in the sediment, mainly in the northern and middle parts, due to its finer fractions (silt and clay) (Mahiques, 1995; Burone et al., 2003). Such depletion interferes directly with the vertical distribution and abundance of the subsurface deposit-feeders in the substrate, such as Mediomastus capensis, and this keeps the species within a narrow superficial oxygenated layer. The restriction of deposit-feeder organisms to a narrow belt in the muddy sediments of the middle area of Ubatuba Bay might lead to the encounter of Mediomastus capensis and Magelona papillicornis which probably means that they compete here for space and food.
According to Hall et al. (1992), estimates of anoxic events are difficult to make, but this source of disturbance seems to be relatively predictable in some areas. Those authors have suggested that an increase in the frequency of anoxic events may be linked to an increase in nutrient concentration resulting from land runoff and waste disposal practices.
suspension-feeders (Owenia fusiformis), and carnivores (Eunice prayensis, Hepatus pudibundus).
However, changes occur in the substrate in Ubatuba Bay during the rainy season when large waves cause considerable instability in the sediments, resuspending the particles and benthic organisms carrying them around. In fact, the lowest mean density and diversity obtained in this study occurred in the austral summer after three days of heavy (396 mm) rainfall (February 12-14, 1996). This value was far beyond the climatological monthly average for the month for this town, which is of 301 mm (Calbete et al., 1996). Among the deleterious effects of the disturbance for macrobenthos might be included resource depletion, inhibition of feeding, burial and removal of organisms, with exposure of infauna to predators. All of these events may cause the death of species, thus affecting the density and diversity of the communities.
Besides the abiotic variables, biological factors such as predation must be important regulators of the abundance and exercise an influence on the distribution and density of species in the study area. Macrobenthic species are a particular feeding resource for several organisms of the benthic and demersal fauna, and their role in the energy flow of marine ecosystems has been evidenced by their contribution to the diet of fish and crabs (Petti et al., 1996). Common demersal fish such as Paralonchurus brasiliensis, Micropogonias furnieri, Ctenosciaena gracilicirrhus and Raja agassizi are active predators of the macrobenthic organisms in the Ubatuba region (Nonato et al., 1983), and constitute an important structural factor for benthic communities of sandy-muddy bottoms (Amaral & Migoto, 1980). Some brachyuran crabs such as Persephona mediterranea, Libinia spinosa and Portunus spinimanus, common on the Ubatuba continental shelf, may play the same role as the fish cited above, since from 15 to 90% of their diet may consist of polychaetes (Petti et al., 1996).
Small carnivorous polychaetes were highly abundant in the area and showed a correlation with coarse sedimentary particles. The same dependence was observed by Paiva (1993), Muniz et al. (1998) and Muniz & Pires (1999), respectively, for the inner shelf of the Ubatuba and São Sebastião regions. The preference of carnivores for coarser sediments with low levels of mud and clay is well known (Maurer & Leathem, 1981; Gaston, 1987; Gaston & Nasci, 1988; Tena et al., 1993). On these bottoms, the large interstices among grains can create space enough to favour the mobility and feeding of carnivores, abundance of prey and oxygenation of the sediments (Fenchel, 1970).
The macrobenthic communities in Ubatuba Bay seem to be based on a detritus food web, the
main input of which is of continental origin (Mahiques, 1995; Burone, 2003), and the polychaete associations play an important role in the local energy flow. Benthic deposit-feeders are of special importance since they influence the structure of soft bottoms and also interfere with the chemical and physical characteristics of the sediment, such as pH, Eh, grain-size, grain-shape and spatial distribution of the grain (Knox, 1977). They were the dominant trophic group in the study area, specially the surface deposit feeders, which were twice in number in relation to the subsurface feeders.
The dominance of the surface deposit-feeder polychaetes was expected as they are normally frequent and abundant in soft-bottom communities (Levinton, 1995) and can exploit the resources of the sediment-water interface. They constitute a good indicator of environmental quality, as they reflect the occurrence of any changes that may be taking place. The species of this group, such as Spiophanes missionensis, Magelona papillicornis and Magelona variolamellata, showed some dependence on sandy substrate with high sedimentary CaCO3 content, which
might be associated with accumulation of the superficial detritus on the coarse particles. On the other hand, the shell fragments could also help to protect the organisms against predation.
Subsurface deposit-feeder polychaetes, presenting low density and negative correlation with coarse sand and sedimentary CaCO3 content, confirm
the results obtained by Paiva (1993) for the continental shelf off Ubatuba. This fact might be a consequence of the effect of shell fragments in hampering the feeding of the species that ingest sediment and digest only organic matter and microorganisms associated with the substrate. The presence of fine grained sediments with a high organic matter content makes Ubatuba Bay a suitable place for subsurface deposit-feeders; though in spite of this they were not abundant. Probably their distribution and abundance may be limited by high quantities of food in the substrate and by a low exchange of chemical substances between the bottom and the adjacent water, as pointed out by Mahiques (1995).
Suspension-feeder polychaetes were poorly represented in the area, except for Owenia fusiformis, which occurred in the southern part (station 1), where coarser sediment and considerable hydrodynamic movement predominate. Studying the trophic structure of benthic macrofauna in the Santander Bay (Spain), Lastra et al. (1991) also observed a close relationship between an abundance of suspension-feeders and water motion.
outfall within the Bay. Since the surface deposit-feeders live in a narrow surface layer of the substrate, they could be the first organisms to be influenced by environmental changes caused by the growing contamination of the area.
R
EFERENCESAmaral, A. C. Z. 1980. Anelídeos poliquetos do infralitoral em duas enseadas da região de Ubatuba. II. Aspectos ecológicos. Bolm Inst. oceanogr., S Paulo, 29(1):69-87. Amaral, A. C. Z. & Migoto, A. E. 1980. Importância dos
anelídeos poliquetas na alimentação da macrofauna demersal e epibentônica da região de Ubatuba. Bolm Inst. oceanogr., S Paulo, 29(2):31-35.
Aschan, M. 1990. Changes in soft bottom macrofauna communities along environmental gradients. Annls zool. Fenn., 27:329-336.
Bachelet, G.; Montaudouin, X. de & Dauvin, J. C. 1996. The quantitative distribution of subtidal macrozoobenthic assemblages in Arcachon Bay in relation to environmental factors: a multivariate analysis. Estuar. coast. Shelf Sci., 42:371-391.
Burone, L.; Muniz, P.; Pires-Vanin, A. M. S & Rodrigues, M. 2003. Spatial distribution of organic matter in the surface sediments of Ubatuba Bay (southeastern Brazil). An. Acad. Bras. Cienc., 75(1):77-90.
Calbete, N. O.; Calbete, S. R.; Rozante, J. R. & Lemos, C. F. 1996. Precipitações intensas ocorridas no período de 1986 a 1996 no Brasil. Climanálise 10 anos (Publ. esp.), p.106-109.
Castro Filho, B. M. de; Miranda, L. B. & Myao, S. Y. 1987. Condições hidrográficas na plataforma continental ao largo de Ubatuba: Variações sazonais e em média escala. Bolm Inst. oceanogr., S Paulo, 35(2):135-151.
CETESB. 1996. Relatório de Balneabilidade das Praias Paulistas - 1995. Secretaria do Meio Ambiente. 112 p. Dauer, D. M. & Conner, W. G. 1980. Effects of moderate
sewage input on benthic polychaete populations. Estuar. coast. mar. Sci., 10:335-346.
Engle, V. D.; Summers, J. K. & Gaston, G. R. 1994. A benthic index of environmental condition of Gulf of Mexico estuaries. Estuaries, 2:372-384.
Fauchald, K. & Jumars, P. A. 1979. The diet of worms: a study of polychaete feeding guilds. Oceanogr. mar. Biol. a. rev., 17:193-284.
Fenchel, T. 1970. Studies on the decomposition of organic detritus derived from the turtle grass Thalassia testudinum. Limnol. Oceanogr., 15(1):14-20.
Folk, R. L. & Ward, W. C. 1957. Brazos River bar: a study of the significance of grain size parameters. J. sedim. Petrology, 27:3-26.
Gambi, M. C. & Giangrande, A. 1985. Analisi della struttura trofica del popolamento dei policheti nei fondi mobili di due aree del Mar Tirreno. Oebalia, 11:215-222.
Gaston, G. R. 1987. Benthic polychaeta of the Middle Atlantic Bight: feeding and distribution. Mar. Ecol. Progr. Ser., 36:251-262.
Gaston, G. R. & Nasci, J. C. 1988. Estuarine macrobenthos in Calcasieu, Lousiana: community and trophic structure. Estuaries, 11:201-211.
Gray, J. S. 1974. Animal - sediment relationships. Oceanogr. mar. Biol. a. rev., 12:233-261.
Gross, M. E. 1971. Carbon determination. In: Carvier, R. E. ed. Producers in Sedimentary Petrology. New York, Wiley - Interscience, New York, p.573-596.
Hall, S. J. 1994. Physical disturbance and marine benthic communities: life in unconsolidated sediments. Oceanogr. mar. biol. a. rev., 32:179-239.
Hall, S. J.; Raffaelli, D. & Thrush, S. F. 1992. Patchiness and disturbance in shallow water benthic assemblages. In: Guiller, P. S.; Heldrew, A .G & Raffaelli, D. G. eds. Aquatic Ecology, Scale, Pattern and Process. New York, Blackwell Science. p.333-373. Hyland, J.; Baptiste, E.; Campbell, J.; Kennedey, J.; Kropp,
R. & Williams, S. 1991. Macroinfaunal communities of the Santa Maria Basin on the California outer continental shelf and slope. Mar. Ecol. Prog. Ser., 78: 147-161. Jones, A. R.; Watson-Russel, C. S. & Murray, A. 1986.
Spatial patterns in the macrobenthic communities of the Hawkesbriry estuary, New South Wales. Aust. J. mar. Freshwat. Res., 37:521-543.
Knox, G. A. 1977. The role of polychaetes in benthic soft-bottom communities. In: Reisch, D. & Fauchald, K. eds. Essays on Polychaetous Annelids in Memory of Dr. Olga Hartman. Allan Hancock Foundation, Los Angeles. p.547-604.
Lastra, M.; Palacio, J.; Sanchez, A. & Mora, J. 1991. Estructura trófica infralitoral de la Bahia de Santander. Cah. Biol. mar., 32:333-351.
Levinton, J. S. 1995. Marine Biology - Function, Biodiversity, Ecology. Oxford University Press. 420p. Mahiques, M. M. 1995. Dinâmica sedimentar atual nas
enseadas da região de Ubatuba, Estado de São Paulo. Bolm Inst. oceanogr., S Paulo, 43(2):111-122.
Maurer, D.; Leathem, W. & Menzie, C. 1981. The impact of drilling fluid and well cuttings on polychaete feeding guilds from the US Northeastern continental shelf. Mar. Pollut. Bull., 13:342-347.
Moller, P.; Pihl, L. & Rosenberg, R. 1985. Benthic faunal energy flow and biological interaction in some shallow marine soft bottom habitats. Mar. Ecol. Prog. Ser., 27:109-121.
Muniz, P.; Sumida, P. Y. G. & Pires-Vanin, A. M. S. 1998. Trophic structure of polychaetes in two bays of the southeastern Brazilian Coast (Mar Virado and Fortaleza, Ubatuba, São Paulo). Oebalia, 24:39-53.
Muniz, P. & Pires, A. M. S. 1999. Trophic structure of polychaetes in the São Sebastião Channel (Southeastern Brazil). Mar. Biol., 134(3):517-528.
Nonato, E. F.; Amaral, A. C. Z. & Figueiredo, J. L. 1983. Contribuição ao conhecimento da fauna de peixes do litoral norte do Estado de São Paulo. Bolm Inst. oceanogr., S Paulo, 32(2):143-152.
Persson, L. E. 1982. Macrozoobenthic associations of Hano Bigth, Southern Baltic. Sarsia, 67:93-106.
Petti, M. A. V; Nonato, E. F. & Paiva, P. C. 1996. Trophic relationships between polychaetes and brachyuran crabs on the southeastern Brazilian coast. Rev. bras. oceanogr., 44(1):61-67.
Pires, A. M. S. 1992. Structure and dynamics of the benthic megafauna from the continental shelf offshore of Ubatuba, southeastern Brazil. Mar. Ecol. Prog. Ser., 86(1):63-76.
Pires-Vanin, A. M. S. 1993. A macrofauna bêntica na plataforma continental ao largo de Ubatuba, São Paulo, Brasil. Publção esp. Inst. oceanogr., (10):137-158. Probert, P. K. 1984. Disturbance, sediment stability and
trophic structure of soft-bottom communities. J. mar. Res., 42:893-921.
Rhoads, D. C. & Young, D. K. 1970. The influence of deposit-feeding organisms on sediment stability and community trophic structure. J. mar. Res., 28: 150-178. Santos, M. F. L. dos; Pires-Vanin, A. M. S. & Muniz, P.
1996. A simple and efficient device for sorting large marine benthic samples. Rev. bras. oceanogr., 44 (1):57-60.
Santos, M. F. L. dos & Pires-Vanin, A. M. S. 1999. The Cumacea community of the southeastern Brazilian Continental Shelf: structure and dynamics. Sci. Mar., 63(1):15-25.
Siegel, S. 1956. Nonparametric statistics for the behavioral sciences. International Student Edition. Mc Graw-Hill Book Company. 312p.
Sneath, P. H. & Sokal, R. R. 1973. Numerical taxonomy. The principles and practice of numerical classification. San Franscisco, W.H. Freeman & Co. 573p.
Strickland, J. D. H. & Parsons, T. R. 1968. A pratical handbook of sea water analysis. Bull. Fish. Res. Bd. Can., 167:1- 311.
Suguio, K. 1973. Introdução à Sedimentologia. São Paulo, Blucher/EDUSP. 312p.
Sumida, P. Y.; Pires, A. M. S.; Milanelli, J. C.; Gallerani, G. & Heitor, S. 1993. Macroinfauna da Enseada da Fortaleza, Ubatuba, Estado de São Paulo. São Paulo, ACIESP, 87(2):300-314.
Sumida, P. Y. & Pires-Vanin, A. M. S. 1997. Bentic associations of the shlefbreak and upper slope off Ubatuba-SP, South-eastern Brazil. Estuar. coast. Shelf Sci., 44(6):779-784.
Tena, J.; Capaccioni-Azzati, R.; Torres-Gavila, F. J. & Porras, R. 1993. Anélidos poliquetos del antepuro de Valencia: distribuición y categorías tróficas. Publ. esp. Inst. Esp. oceanogr., 11:15-20.
Warwick, R. M. & Ruswahyun, I. 1987. Comparative study of the structure of some tropical and temperate marine soft-bottom macrobenthic communities. Mar. Biol., 95:641-649.
Wildish, D. J. & Peer, D. 1983. Tidal current speed and production of benthic macrofauna in the lower Bay of Fundy. Can. J. Fish. aquat. Sci., 40:309-321.
Weinberg, J. R. 1984. Interactions between functional groups in soft-substrata: do species differences matter ? J. expl. mar. Biol. Ecol., 80:11-28.
Weston, D. P. 1988. Macrobenthos-sediment relationships on the continental shelf off Cape Hatteras North Carolina. Continent. Shelf Res., 8(3):267-286.