Article
J. Braz. Chem. Soc., Vol. 24, No. 9, 1451-1460, 2013. Printed in Brazil - ©2013 Sociedade Brasileira de Química 0103 - 5053 $6.00+0.00
A
*e-mail: [email protected]
Degradation of the Commercial Herbicide Glyphosate by Photo-Fenton Process:
Evaluation of Kinetic Parameters and Toxicity
Danilo R. de Souza,*,a Alam G. Trovó,b Nelson R. Antoniosi Filho,c
Marcos A. A. Silvac and Antonio E. H. Machadob,d
aInstituto de Ciências Ambientais e Desenvolvimento Sustentável, Universidade Federal da Bahia,
Rua Prof. José Seabra, s/n, 47805-100 Barreiras-BA, Brazil
bLaboratório de Fotoquímica e Ciência de Materiais, Instituto de Química,
Universidade Federal de Uberlândia, CP 593, 38400-902 Uberlândia-MG, Brazil
cLaboratório de Métodos de Extração e Separação, Instituto de Química,
Universidade Federal de Goiás, Campus Samambaia, 74001-970 Goiânia-GO Brazil
dDepartamento de Química, Universidade Federal de Goiás, Campus Catalão,
75704-020 Catalão-GO, Brazil
Parâmetros que influenciam a eficiência da degradação do glifosato (adição única de Fe2+, adição simultânea de Fe2+ e Fe3+ numa razão molar de 1:1 (Fe2+/Fe3+), adição de íons oxalato e de H2O2) foram avaliados em escala de laboratório. Efeitos sinérgicos sobre a degradação e formação de fosfato foram observados utilizando a adição simultânea de Fe2+/Fe3+, bem como adicionando oxalato. Por outro lado, aumentos nas concentrações de Fe2+/Fe3+, oxalato e H
2O2 não proporcionaram incremento linear da mineralização de glifosato e liberação de fosfato. Utilizando concentrações elevadas dessas espécies, a eficiência de mineralização de glifosato e de liberação de fosfato foi constante ou até mesmo reduzida. Sob condições otimizadas (0,27 mmol L-1 de Fe2+/Fe3+; 1,13 mmol L-1 de oxalato e 10,3 mmol L-1 de H
2O2), os resultados obtidos em escala laboratorial e de planta piloto solar foram próximos. Uma relação direta entre a redução da toxicidade e concentração de glifosato também foi observada.
Parameters that influence the efficiency of the degradation of glyphosate (addition of Fe2+, simultaneous addition of Fe2+ andFe3+ at a 1:1 (Fe2+/Fe3+) molar ratio, addition of oxalate and of H2O2) were evaluated at lab-scale. Synergic effects on its degradation and release of phosphate were observed using Fe2+/Fe3+, as well as adding oxalate. On the other hand, the concentration increase of Fe2+/Fe3+, oxalate and H
2O2 did not promote a linear increase of glyphosate mineralization and release of phosphate. Using high concentrations of these species, the efficiency of glyphosate mineralization and release of phosphate was constant or even decreased. Under optimized conditions (0.27 mmol L-1 of Fe2+/Fe3+; 1.13 mmol L-1 of oxalate and 10.3 mmol L-1 of H
2O2), close results for mineralization and release of phosphate were obtained in lab-scale and using a solar pilot plant. A direct ratio between reducing the toxicity and glyphosate concentration was also observed.
Keywords:herbicide, sunlight, agricultural effluent, mineralization, detoxification
Introduction
Glyphosate (GLP), N-(phosphonomethyl) glycine, is a broad-spectrum systemic organophosphate herbicide, non-selective, being the most widely used worldwide.1 In Brazil, glyphosate is classified as class IV (low toxicity) for rats and class III (hazardous material) to the environment.2
development of viable technologies with a focus on disposal of such waste.
Advanced oxidation processes (POAs) appear as an alternative for the treatment of wastewater containing glyphosate. These processes are based on the generation of hydroxyl radicals (HO•), a highly oxidizing species (reduction potential of +2.8 V), capable to non-selectively
degrade most organic compounds into CO2, H2O and
inorganic compounds.4,5 From the variety of existing AOPs, particular attention has been given to photo-Fenton process and heterogeneous photocatalysis due to the possibility of use of solar radiation, reducing the energetic costs.6,7 However, the photo-Fenton process has the advantage to be a homogeneous process, avoiding an additional step of removal of catalyst, usual when dealing with heterogeneous processes. Another advantage is the fact that homogeneous processes favor the contact between the reagent species, with positive implications on process performance.
The use of different AOPs for degradation of glyphosate
has been reported, such as ozonation,8 H
2O2/UV-C, 9
heterogeneous photocatalysis,8,10,11 photo-Fenton12,13 and electrochemical methods.14 However, a study evaluating kinetic parameters and toxicity during photo-Fenton treatment has not been published.
Therefore, the aim of the present work was to evaluate at laboratory scale the influence of some parameters (use of Fe2+ and combination of Fe2+ and Fe3+ at a 1:1 molar ratio (Fe2+/Fe3+), addition of oxalate, concentration of H
2O2 and oxalate) on the kinetics of mineralization and release of phosphate ion during the degradation of commercial glyphosate induced by photo-Fenton process. It was also monitored the degradation of glyphosate on a large scale under optimal experimental conditions, using a pilot plant and solar radiation in order to assess the possible commercial use of this technology.
Experimental
Reagents
All solutions were prepared using ultrapure water. FeSO4.7H2O and Fe2(SO4)3 (Vetec) were used to prepare 0.25 mol L-1 stock solutions of Fe2+ and Fe3+, respectively. Using these stock solutions, it was prepared solutions containing different concentrations of iron (total), keeping fixed in 1:1 the molar ratio between Fe2+ and Fe3+.
H2O2 (50% m/m), H2SO4 (98% m/m) and NaOH, all from Vetec Química, were used as received. A solution of ammonium metavanadate (Vetec) was prepared at a concentration of 0.060 mol L-1 in 0.36 mol L-1 H
2SO4 and used for H2O2 determinations.
All experiments were carried out with the commercial formulation (360 g L-1 glyphosate, 169 g mol-1 C
3H8NO5P),
which was diluted to obtain a solution containing 0.59 mmolL-1 (100 mg L-1, experimental total organic carbon (TOC) of 42 mg C L-1) of glyphosate. Although the glyphosate concentration is higher than that found in aqueous environment, it was chosen to permit an adequate evaluation of the degradation kinetics and to monitor the changes in toxicity during the photo-Fenton process. The analytical standard of glyphosate for chromatographic analysis was purchased from Sigma-Aldrich.
Photodegradation procedures
Lab-scale experiments
The photodegradation experiments were performed in a lab-scale using a 400 W high pressure mercury vapor lamp as irradiation source. The spectral distribution of this lamp (in the range between 295 and 815 nm) can be viewed in a previous study published by Machado et al.15 The photocatalytic reactor consists of an annular recipient of borosilicate glass with an irradiated surface of 4.0 × 10⁻² m2 (8.6 cm external diameter, 3.6 cm internal diameter and 23 cm height) and an irradiated volume of 0.450 L. The walls of the reactor act as radiation filter allowing that only photons with wavelength above 290 nm achieve the reaction medium, making impossible the decomposition of hydrogen peroxide by direct photolysis. The lamp was positioned in the center of the reactor, described and schematically presented by Oliveira et al.16 The average irradiance in the UVA furnished by this kind of lamp was estimated as being equal to 1100 W m-2, with a photonic flux of 3.3 × 10⁻⁶ einstein s-1 between 295 and 710 nm.15,17
concentration (Fe2+/Fe3+): from 0.18 to 1.78 mmol L-1 (between 10.0 and 100.0 mgL-1); (iii) oxalate concentration: 0.225 to 2.25 mmol L-1 (37.5 to 375.0 mgL-1) and (iv) H
2O2
concentration: 5.2 to 15.5 mmol L-1 (176.8 to 527.0 mg L-1). Thus, kinetic experiments were carried out using 0.59 mmolL-1 (100 mg L-1) glyphosate, 0.27 mmol L-1 Fe2+/Fe3+, 1.13 mmol L-1 oxalate (187.6 mgL-1) and 10.3 mmol L-1 (350.2 mg L-1) H
2O2. After sampling and before analysis, a calculated volume of 2.0 mol L-1 Na
2SO3
aqueous solution was added to the samples according to the stoichiometry between H2O2 and Na2SO3, and H2O2 concentration, ensuring the removal of the remaining H2O2, stopping the Fenton reaction.
Experiments in a pilot plant: use of solar radiation
The experiments using solar radiation were carried in the winter under clear sky conditions, using a solar pilot plant. It consists of a compound parabolic collector (CPC) with an irradiated surface of 1.62 m2 (irradiated volume of 12 L) and a reservoir with maximum capacity of 120 L. A volume of 50 L of glyphosate solution (0.59 mmol L-1, 100 mg L-1) circulates under turbulent flow into the CPC absorber tubes in a closed recirculating system.18
The solar irradiance was measured using the same radiometer applied in the lab-scale experiments, placed at the same angle of inclination of the reactor, being that an average solar irradiance of 40 ± 5 W m-2 was obtained. The photoreactor hydraulic circuit consists of a continuously stirred tank and a 0.50 HP centrifugal recirculation pump. At the beginning of the experiment, with the collectors covered, the same initial conditions defined for the reagents in kinetic experiments under lab-scale were used (0.27 mmol L-1 Fe2+/Fe3+, 1.13 mmolL-1 oxalate, 10.3 mmol L-1 H
2O2 and pH 2.8 ± 0.2). The cover was then removed and the samples were collected at intervals of 100 kJm-2 of UVA dose up to 800 kJm-2 (30 min up to 240 min of irradiation). The same treatment using the Na2SO3 solution (previously described) was done to stop the Fenton reaction.
Due to differences inherent to thearchitecture of the reactors used in this study, like the average irradiance, irradiated surface area and total volume of solution, the accumulated UVA energy (QUVA,n in kJ L
–1) was calculated
for each time of sampling for each reactor to allow a good correlation between the results. Equation 1 allows to estimate the accumulated UVA energy per unit of volume, received on any surface, for a solution inside a reactor, in a time interval (∆t).19
(1)
where tn is the sampling time, Vtthe total reactor volume,
Ar the illuminated collector surface area and UVAG,n the average solar or artificial UVA radiation, measured during the period ∆tn (tn – tn-1). Considering this equation, it was possible to correlate quantitatively the results at lab- and pilot scales.
Table 1 presents the accumulated UVA energy for each reactor at different reaction times. A significant difference in the accumulated UVA energy was obtained for both reactors. An accumulated UVA energy 8 times higher than that provided by solar radiation to the pilot plant is provided by the mercury lamp to the lab-scale reactor to the same sampling time. Although different accumulated UVA energies, in the x-axis of Figures 1, 5 and 8, the sampling time was maintained to facilitate the comparison with Figures 2-4, in which the apparent rate constants were calculated as function of the reaction time.
Analysis
The mineralization of commercial glyphosate solution was followed measuring the TOC decay using a TOC analyser (Shimadzu TOC-VCPH/CPN) equipped with an ASI-V auto sampler. The TOC concentration includes the carbon content of the target compound, the intermediates generated during the experiment and excipient of the commercial product. Hydrogen peroxide was quantified spectrophotometrically using ammonium metavanadate, as described by Nogueira et al.20
The glyphosate concentration was determined by high performance liquid chromatography (HPLC), using a Shimadzu chromatograph (SCL10AVP) and an ionic exchange column (Hypersil™ SAX, 5 µm, 250 × 4.6 mm).
The separation occurred using a 6.2 mmol L-1 KH
2PO4
Table 1. Accumulated UVA energy per unit of volume (QUVA) for the
experiments carried out at lab-scale and at the solar reactor
Sample / min QUVA (kJ L
–1)
Lab-scale Solar reactor
15 9.9 −
30 19.8 2.4
45 29.7 −
60 39.6 4.8
90 59.4 7.2
120 79.2 9.6
150 − 12.0
180 − 14.4
210 − 16.8
solution (pH 2.1) containing 4% (m/m) methanol in isocratic mode at a flow rate of 2 mL min-1. The detection was performed by UV absorption at 195 nm. The injection volume was 20 mL. Under these conditions, the retention time for glyphosate was between 10.5 and 11.0 min, with a limit of quantification of 1.0 mg L-1.
The concentration of dissolved inorganic phosphate was determined using the molybdenum blue method.21
The toxicity tests were done evaluating the germination of Lactuva sativa seeds in quadruplicate.22 Before the toxicity tests, the pH was adjusted in the range between 6 and 8 after adding a Na2SO3 solution and filtration of the samples through membranes with pore diameter of 0.45
µm. The seeds used in these experiments had no chemical treatment that could interfere in the results. The assays of germination were done in Germ Box® using filter paper, sterilized previously. The influence of different parameters on the germination of lettuce seeds was evaluated using the following samples: (i) solution containing a mixture of Fe2+ and Fe3+ (0.27 and 0.135 mmolL-1 of each specie); (ii) solution of potassium oxalate (1.13 mmolL-1); (iii) solution of glyphosate commercial (0.59 mmol L-1);
(iv) sample after 60 min of photo-Fenton process;
(v) sample after 120 min of photo-Fenton process. For germination testing, 16 mL of each sample (water was used in the control experiment) were added on filter paper in each box. A total of 25 seeds was distributed into each container, capped, labeled and placed in a greenhouse germinating previously adjusted at a temperature of 22 °C. The assays were performed in the absence of light and the total incubation time was 5 days. After 5 days, the boxes were removed from the incubator to quantify the seed germination. For samples obtained after 60 and 120 min of photo-Fenton process, the radicle growth (stem) was also measured.
Results and Discussion
Lab-scale experiments
Influence of the addition of Fe2+ or simultaneous addition of
Fe2+ and Fe3+ on the efficiency of mineralization and release
of phosphate
The Fenton reactions have been employed in the degradation of different organic compounds. However its mechanism is not yet completely cleared. Results from the literature have demonstrated that Haber and Weiss reaction (equation 1) is not thermodynamically favorable since the formation of the intermediate H2O2– is not viable.23,24 So, it has been proposed that the degradation occurs by the action of hydroxyl radicals produced during the oxidation
of Fe2+ (equation 2). In the presence of irradiation, Fe2+ is recovered (equation 3):
Fe2+ + H
2O2→ Fe
3+ + H
2O2
–→ Fe(OH)2+ + HO• (2)
Fe(OH)2+ + hν→ Fe2+ + HO• (3)
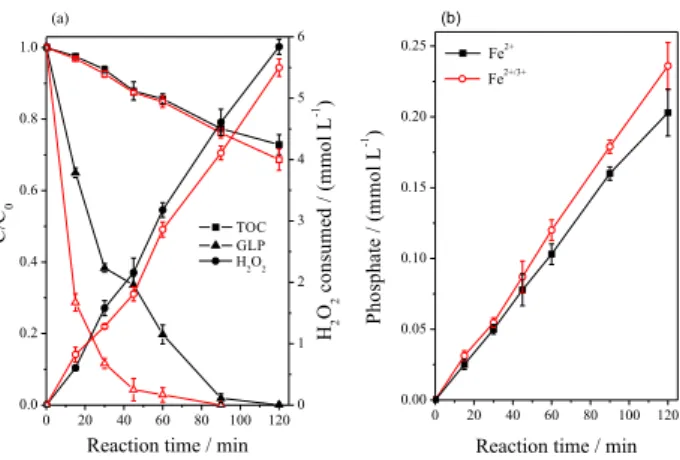
Considering that Fenton reaction can be triggered by thermal and/or photochemical pathways, it is important to evaluate the role of simultaneous addition of Fe2+ and Fe3+, compared to the action of only Fe2+, on the removal and mineralization of glyphosate, as well as in the release of phosphate ion (Figure 1). Although no significant difference was observed in the mineralization of glyphosate, a higher removal rate of glyphosate was obtained when an equimolar combination of Fe2+ and Fe3+ was used (Figure 1a), suggesting a synergic action caused by the simultaneous occurrence of the thermal and photochemical processes. The amount of phosphate released, given mainly after 60 min of reaction (Figure 1b), confirms the better results for glyphosate removal (Figure 1a) obtained in the presence of the combination of Fe2+ and Fe3+ (Figure 1b).
The kinetic study of the degradation of glyphosate (equations 4 and 5) has been done by monitoring (by HPLC) its content during the photocatalytic process. Thus,
GLP + HO•→ Oxidation products (4)
(5)
As the concentration of hydroxyl radicals must reach quickly a stationary-state regimen during the photocatalytic
Figure 1. Influence of single (solid symbols) and simultaneous (open symbols) addition of Fe2+ (solid symbols) and Fe2+/Fe3+ (open symbols) on the (a) glyphosate removal and mineralization, and hydrogen peroxide consumption; (b) release of phosphate ion during glyphosate degradation by photo-Fenton process at lab-scale. Initial conditions: [GLP] = 0.59 mmol L-1 (100 mg L-1; TOC = 42 mgC L-1); [Fe2+] or [Fe2+/Fe3+] = 0.27 mmol L-1; [H
process ([HO•] approximately constant), the rate law of the
reaction can be treated as being of pseudo-first order, in terms of consumption of GLP,25,26
k[HO•] = k
app (6)
Substituting equation 6 in equation 7, then,
(7)
and integrating,
(8)
where expresses the normalized consumption of
glyphosate.
The apparent rate constants for removal of glyphosate, kapp, estimated from the data shown in Figure 1a, curve GLP, during the first 60 min of the photo-Fenton process, are 2.60 × 10⁻² and 6.01 × 10⁻² min-1, with half-lives of 26.65 and 11.53 min, respectively for the reactions mediated by Fe2+ (correlation coefficient, r2 = 0.9696) and Fe2+/Fe3+ (r2 = 0.9676, when an equimolar combination of Fe2+ and Fe3+ was used). Regarding to mineralization (TOC reduction, Figure 1a), 28 and 32% were reached, consuming, respectively, 5.50 and 5.84 mmolL-1 H
2O2 in the presence of Fe2+ and Fe2+/Fe3+, after 120 min of reaction. For this same period, 0.203 and 0.236 mmol L-1 phosphate ions (Figure 1b) were formed using Fe2+ and Fe2+/Fe3+, respectively. The amount of phosphate ions obtained was lower than the estimated theoretical value (0.592 mmol L-1) (equation 9) for a complete mineralization of glyphosate (Figure 1a). These results suggest the presence of organic intermediates containing phosphorus in the structure (Figure 1a).
C3H8ONP + 8H2O → 3CO2 + PO43– + NO3– + 24H+ + 20e− (9)
Influence of the simultaneous addition of Fe2+ and Fe3+
on the apparent kinetic rate of mineralization (kapp) and
release of phosphate, during glyphosate degradation by photo-Fenton process at lab-scale
Considering the expressive removal of glyphosate and release of phosphate ions when the degradation promoted by photo-Fenton process is mediated by the simultaneous addition of Fe2+ and Fe3+, the next experiments were done only under this condition.
The iron concentration must be evaluated for each system since that it can interfere in the efficiency of the
photodegradation.27,28 Additionally, it is important to establish a balance with existing environmental standards for effluent disposal.
The experiments were performed evaluating the role of the Fe2+/Fe3+ concentration (0.18, 0.36, 0.71, 1.07, 1.43 and 1.78 mmol L-1), maintaining fixed the molar ratio in 1:1 during the degradation of glyphosate by photo-Fenton process at lab-scale (Figure 2). The increase in the Fe2+/Fe3+ concentration does not result in a proportional increase in the apparent mineralization rate: kapp increases linearly up to 0.71 mmolL-1 remaining constant until 1.78 mmol L-1 (Figure 2). This is probably related to the excess of Fe2+/Fe3+ in solution. An excess of Fe2+ tends to compete with the organic matter by the hydroxyl radicals (equation 10), while an excess of Fe3+ can react with hydrogen peroxide to form less reactive species (HO2•) (equations 11 and 12), compromising the degradation efficiency.
Fe2+ + HO•→ Fe3+ + −OH, k = 3.2 × 10⁸ mol-1L s-1 (10) Fe3+ + H
2O2→ FeOOH
2+ + H+, k = 3.1 × 10⁻³ mol-1 L s-1 (11)
FeOOH2+→ Fe2+ + HO
2•, k = 2.7 × 10⁻³ mol-1L s-1 (12)
Besides the above mentioned parallel reactions (equations 10 to 12), the excess of Fe2+/Fe3+ acts as a radiation filter, absorbing UV-Vis photons and committing the degradation efficiency.29,30 Although a higher apparent rate constant of mineralization was
obtained for the concentration of 0.71 mmolL-1 of
Fe2+/Fe3+, the concentration of dissolved iron is above the value established by Brazilian legislation (0.27 mmolL-1) for disposal in effluent. Thus, for an actual application, an additional step (post-treatment of the effluent) would be necessary to precipitate and separate the excess of dissolved
Figure 2. Influence of the combined addition of Fe2+ and Fe3+ on the apparent mineralization rate (kapp) estimated during glyphosate
degradation by photo-Fenton process at lab-scale. Initial conditions: [GLP] = 0.59 mmol L-1 (100 mg L-1; TOC = 42 mgC L-1); [Fe2+/Fe3+] = 0.18, 0.36, 0.71, 1.07, 1.43 and 1.78 mmol L-1; [H
iron, resulting in additional costs. Thus, the following experiments were performed with the concentration limit of 0.27 mmolL-1 in order to make the process less expensive.
Influence of oxalate concentration on the apparent mineralization rate and release of phosphate during the degradation at lab-scale
It is known that the addition of oxalate in the photo-Fenton process contributes to increase the degradation
efficiency of some compounds.13,30 The addition of
oxalate ions forms complexes that absorb up to 500 nm, promoting a better use of the solar radiation.31 Moreover, photochemical processes mediated in presence of these species result in a greater quantum efficiency of ferrous ions (ΦFe2+ = 1.24 at 300 nm) when compared to reactions mediated only by ferrous salts (ΦFe2+ = 0.14 at 313 nm).32
In this context, the influence of oxalate concentration (0.23, 0.45, 0.79, 1.13, 1.69 and 2.29 mmolL-1) was evaluated during the glyphosate degradation in the presence of 0.27 mmolL-1 of Fe2+/Fe3+. Despite the increase in the degradation efficiency of some compounds due to the addition of oxalate increase, its use implies in an additional source of organic matter. Since it is impossible to differentiate the TOC from glyphosate and oxalate, the comparison of the results of such tests was based on the amount of the released phosphate.
Considering the apparent mineralization rate, a linear correlation with positive slope is obtained in the range of oxalate concentration between 0.25 and
1.13 mmol L-1, remaining constant between 1.13 and
2.29 mmol L-1 (Figure 3a). On the other hand, the concentration of phosphate ions increased only when the
oxalate concentration was in the range between 0.79 and 1.13 mmol L-1 (Figure 3b). Thus, the concentration of 1.13 mmol L-1 was chosen to perform the next experiments. The same values of apparent mineralization rate above 1.13 mmol L-1 may be due to the consumption of hydroxyl radicals by oxalate (equations 13 and 14).33,34 These results agree with studies in the literature.34,35
C2O4– + HO•→ CO2 + CO2•– + HO–,
k = 7.7 × 10⁶ mol-1 L s-1 (13)
HC2O4– + HO•→ CO2 + CO2•– + H2O,
k = 4.7 × 10⁷ mol-1 L s-1 (14)
Influence of H2O2 concentration on the apparent
mineralization rate and release of phosphate during glyphosate degradation by photo-Fenton process at lab-scale
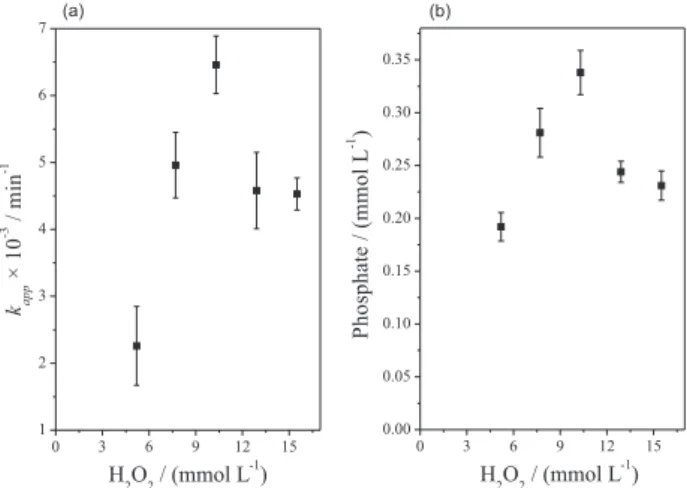
The effect of hydrogen peroxide concentration (5.20, 7.70, 10.30, 12.90 and 15.50 mmol L-1) on degradation of glyphosate by photo-Fenton process was evaluated (Figure 4). The presence of hydrogen peroxide is crucial for the Fenton reaction and consequently for the organic matter degradation. In its absence, the Fenton reaction does not occur, and under high concentrations peroxide acts as scavengers of hydroxyl radicals.27,28,36 Several studies have evaluated the concentration of hydrogen peroxide in order to obtain an optimum condition of reaction for the degradation of organic matter.36,37
The apparent mineralization rate has a direct relation with the concentration of H2O2 in the range between
5.20 and 10.30 mmol L-1 reaching a maximum value in
Figure 3. Influence of oxalate concentration on the (a) apparent mineralization rate (kapp) and (b) release of phosphate ion during
glyphosate degradation by photo-Fenton process at lab-scale. Initial conditions: [GLP] = 0.59 mmol L-1 (100 mg L-1; TOC = 42 mg L-1); [Fe2+/Fe3+] = 0.27 mmolL-1; [oxalate] = 0.23, 0.45, 0.79, 1.13, 1.69 and 2.29 mmolL-1; [H
2O2] = 10.3 mmol L-1; pH 2.8 ± 0.2.
Figure 4. Influence of hydrogen peroxide concentration on the (a) apparent mineralization rate (kapp) and (b) release of phosphate ion during
glyphosate degradation by photo-Fenton process at lab-scale. Initial conditions: [GLP] = 0.59 mmol L-1 (100 mg L-1; TOC = 42 mgC L-1); [Fe2+/Fe3+] = 0.27 mmolL-1; [Oxalate] = 1.13 mmol L-1; [H
10.30 mmol L-1 (Figure 4a). Above this concentration, kapp tends to decrease. In other words, kapp increases until an optimal concentration of H2O2 is achieved. Above this value, the apparent mineralization rate decreases probably due to H2O2 self-decomposition (equation 15), scavenging of hydroxyl radicals by the excess of H2O2 (equation 16) and annihilation of HO· (equation 17). Similar behavior was observed for the release of phosphate ions (Figure 4b). A reduction in the degradation efficiency of phenol and sulfonamides was also observed in the presence of excess of hydrogen peroxide.36,37
2 H2O2→ 2 H2O + O2 (15)
H2O2 + HO• → HO2• + H2O (16)
2 HO•→ + H
2O2 (17)
Comparison of glyphosate degradation in the presence and absence of oxalate by photo-Fenton process at lab-scale: evaluation of toxicity
Based on previously optimized conditions, experiments were carried out in the presence of oxalate ions aiming to enhance the degradation of glyphosate. The results show that the presence of oxalate promotes high levels of contaminant degradation and mineralization besides the production of phosphate ions (Figure 5).
Using oxalate, the glyphosate concentration was below the limit of quantitation (1.0 mgL-1) after 60 min of reaction, while 90 min were needed in its absence (Figure 5a). In the presence of oxalate, glyphosate was consumed at a rate 1.14 times greater than in its absence. Consequently, a higher mineralization was obtained in the presence of oxalate: 74.4 vs. 31.2% in the absence of oxalate, as well as a higher
consumption of hydrogen peroxide (Figure 5a). In a control experiment, in the presence of oxalate (11.3 mmolL-1), and containing 0.27 mmolL-1 Fe2+/Fe3+ and 10.3 mmolL-1 H2O2 at pH 2.8 ± 0.2, after 15 min of reaction, 89% of mineralization of oxalate were reached, showing that this reactant is easily degraded (data not shown).
Although it is not possible to differentiate TOC of glyphosate and oxalate, the glyphosate removal and release of phosphate confirm the synergism of oxalate addition in the photocatalytic degradation (Figure 5b). In the absence and presence of oxalate, 0.225 and 0.415 mmolL-1 of phosphate were respectively formed, with efficiency 84.4% higher in the presence of oxalate. This suggests that larger quantities of phosphorus-containing intermediates should be expected in the absence of oxalate.
A synergic effect involving oxalate addition was also observed during the degradation of the dye Orange II.34 The higher degradation efficiency in the presence of oxalate ions is related to the high molar absorptivity and photosensitivity of Fe2+/Fe3+/oxalate complexes (Figure 6), in addition to the expressive quantum yield of formation of ferrous ions mediated by ferrioxalate ions,38-42 speeding up the production of hydroxyl radicals, providing a higher degradation efficiency.33
In addition to promoting Fenton/photo-Fenton reactions, oxalate becomes an important additive since it reduces the iron complexation by the target compound, which may affect the Fenton/photo-Fenton reactions.43
In parallel, toxicity tests on lettuce seed were carried out, in which germination and growth (measurement of the size of the stem) was monitored to evaluate the reduction and/or increase of toxicity of the solutions during the photodegradation. Control experiments (reference: solution of 0.27 mmol L-1 Fe2+/Fe3+ and 1.13 mmolL-1 potassium
Figure 5. Comparison of the kinetics of (a) glyphosate removal and mineralization, and hydrogen peroxide consumption; (b) Release of phosphate ion during glyphosate degradation in the presence (open symbols) and absence (solid symbols) of oxalate by photo-Fenton at lab-scale. Initial conditions: [GLP] = 0.59 mmolL-1 (100 mg L-1; TOC = 42 mgC L-1); [Fe2+/Fe3+] = 0.27 mmol L-1; [Oxalate] = 1.13 mmol L-1; [H2O2] = 10.3 mmol L-1; pH 2.8 ± 0.2.
F i g u re 6 . UV-Vis absorption spectra of GLP, FeSO4 and Fe2(SO4)3, K2C2O4 and their mixed solutions under the conditions: [GLP] = 0.59 mmol L-1; [FeSO
oxalate) showed that lettuce seeds germinate and develop normally. In contrast, in the presence of 0.59 mmol L-1 (100 mgL-1) commercial glyphosate, no seed germination occurred, showing the high toxicity of the formulation (Figure 7). Applying the photo-Fenton process after 60 and 120 min, all seeds germinated and had a significant growing in relation to blank (Figure 7). The toxicity reduction is due the glyphosate concentration decay (GLP ≤ limit of quantification = 1.0 mg L-1) after 60 min (Figure 5a). However, a residual toxicity of 54% remained in solution, which may be due to the presence of trace levels of glyphosate, as well as, toxic by-products. Increasing the irradiation time from 60 to 120 min, the toxicity decreased from 54 to 18% probably due to higher elimination of residues of glyphosate and toxic by-products, once mineralization increased from 57 to 75% (Figure 5a).
Application of the solar pilot plant for glyphosate degradation
The use of solar radiation during the application of photo-Fenton process as an alternative treatment of wastewater containing toxic and recalcitrant compounds is a trend in the literature, once solar radiation is relatively inexhaustible, abundant, ecologically clean and contribute to reduce the energetic costs to almost zero.44
Considering that the kinetic parameters were evaluated in laboratory scale using a 400 W high pressure mercury vapor lamp as radiation source,15,17 conditions far from the reality of a large-scale processing, an experiment under optimized conditions previously determined in lab-scale was carried out in a pilot plant using sunlight as irradiation source. After an accumulated dose of UVA radiation per L of solution equal to 19.2 kJ L-1 (4 h of solar irradiation in the winter in Uberlândia, Brazil), 62% of TOC removal,
total consumption of H2O2 and release of 0.433 mmol L-1 phosphate ion were obtained (Figure 8). These results are close to the values obtained in lab-scale (Figure 5), showing that this process can be applied as an alternative to large-scale treatment of wastewater containing glyphosate, with the advantage of using sunlight, reducing the energetic costs of the process to almost zero.44,45
In general, the same efficiency was achieved with both reactors (Figures 5 and 8). However, a low UVA accumulated energy per L of solution in the solar pilot plant (19.2 kJ L-1 of UVA radiation) was needed to get the same efficiency achieved in lab-scale (79.2 kJ L-1 of UVA radiation). So, this process can be applied as an alternative to large-scale treatment of wastewater containing glyphosate.
Conclusions
The degradation of glyphosate by photo-Fenton process was favored in the presence of the combination of Fe2+ and Fe3+ in an equimolar ratio, and when oxalate was added to the medium. In addition, it was verified that the increase of the concentrations of iron, oxalate and hydrogen peroxide, increased the glyphosate removal, mineralization and release of phosphate ion up to a determined value, showing the importance of optimize the concentrations to obtain a high efficiency of degradation and to minimize the use of an excess of reagent. Under optimized conditions determined at lab-scale (0.27 mmol L-1 of Fe2+/Fe3+; 1.13 mmol L-1 oxalate; 10.3 mmolL-1 H
2O2 and pH 2.8 ± 0.2), the glyphosate concentration was below the limit of quantification, 57% TOC removal and
Figure 8. Kinetics of (a) mineralization and hydrogen peroxide consumption and (b) release of phosphate, during glyphosate degradation by photo-Fenton process using the solar pilot plant. Initial conditions: [GLP] = 0.59 mmolL-1 (100 mg L-1; TOC = 42 mg CL-1); [ F e2 +/ F e3 +] = 0 . 2 7 m m o l L- 1; [ o x a l a t e ] = 1 . 1 3 m m o l L- 1; [H2O2] = 10.3 mmol L-1; pH 2.8 ± 0.2.
0.385 mmolL-1 phosphate ion were obtained after 60 min of photo-Fenton process. For this same period, the toxicity decreased from 100 to 54% due to the reduction in the concentration of glyphosate. Increasing the irradiation time up to 120 min, 75% TOC and 0.415 mmol L-1 of phosphate removal and a decrease in toxicity from 54 to 18% were reached after a consumption of 9.0 mmol L-1 H
2O2. Under the same experimental conditions, but at large scale and using sunlight as irradiation source, similar results were obtained in relation to the lab-scale experiments, showing the viability and potentiality of this process as an alternative of treatment to this type of wastewater.
Acknowledgements
The authors thank the CNPq, FAPEMIG and CAPES for the financial support. To Mr. Paulo Souza Müller Jr for technical support. A.E.H. Machado is particularly indebted to CNPq and CAPES for his research grants. The authors also thank to Dr. Carlos Machado dos Santos for providing access to the Laboratório de Sementes (Seed Laboratory) - Universidade Federal de Uberlândia, and Mr. Adílio de Sá Junior for technical support.
References
1. Amarante Jr., O. P.; Santos, T. C. R.; Brito, N. M.; Ribeiro, M. L.; Quim. Nova2002, 25, 589.
2. http://agrofit.agricultura.gov.br/agrofit_cons/principal_agrofit_ cons, accessed in September 2012.
3. Cox, C.; J. Pest. Ref./Fall1998, 18, 10.
4. Dong, M. M.; Rosario-Ortiz, F. L.; Environ. Sci. Technol.2012, 46, 3788.
5. Wang, J. L.; Xu, L. J.; Crit. Rev. Environ. Sci. Technol.2012, 42, 251.
6. Vilar, V. J. P.; Pinho, L. X.; Pintor, A. M. A.; Boaventura, R. A. R.; Sol. Energy2011, 85, 1927.
7. Vilar, V. J. P.; Moreira, J. M. S.; Fonseca, A.; Saraiva, I.; Boaventura, R. A. R.; J. Adv. Oxid. Technol.2012, 15, 107. 8. Assalin, M. R.; De Moraes, S. G.; Queiroz, S. C. N.; Ferracini,
V. L.; Duran, N.; J. Environ. Sci. Health, Part B2010, 45, 89. 9. Manassero, A.; Passalia, C.; Negro, A. C.; Cassano, A. E.;
Zalazar, C. S.; Water Res.2010, 44, 3875.
10. Chen, S. F.; Liu, Y. Z.; Chemosphere2007, 67, 1010. 11. Muneer, M.; Boxall, C.; Int. J. Photoenergy 2008, DOI:
10.1155/2008/197346.
12. Huston, P. L.; Pignatello, J. J.; Water Res.1999, 33, 1238. 13. Chen, Y.; Wu, F.; Lin, Y.; Deng, N.; Bazhin, N.; Glebov, E.;
J. Hazard. Mater.2007, 148, 360.
14. Balci, B.; Oturan, M. A.; Oturan, N.; Sires, I.; J. Agric. Food Chem.2009, 57, 4888.
15. Machado, A. E. H.; França, M. D.; Velani, V.; Magnino, G. A.; Velani, H. M. M.; Freitas, F. S.; Muller Jr., P. S.; Sattler, C.; Schmücker, M.; Int. J. Photoenergy2008, DOI: 10.1155/2008/482373.
16. Oliveira, D. F. M.; Batista, P. S.; Muller Jr., P. S.; Velani, V.; França, M. D.; Souza, D. R.; Machado, A. E. H.; Dyes Pigm.
2012, 92, 563.
17. Machado, A. E. H.; Miranda, J. A.; Freitas, R. F.; Duarte, E. T. F. M.; Ferreira, L. F.; Albuquerque, Y. D. T.; Ruggiero, R.; Sattler, C.; Oliveira, L.; J. Photochem. Photobiol., A2003, 155, 231.
18. Duarte, E. T. F. M.; Xavier, T. P.; Souza, D. R.; Miranda, J. A.; Machado, A. E. H.; Quim. Nova2005, 28, 921.
19. Malato, S.; Blanco, J.; Vidal, A.; Richter, C.; Appl. Catal., B
2002, 37, 1.
20. Nogueira, R. F. P.; Oliveira, M. C.; Paterlini, W. C.; Talanta
2005, 66, 86.
21. Ganesh, S.; Velavendan, P.; Pandey, N. K.; Ahmed, M. K.; Mudali, U. K.; Natarajan, R.; J. Radioanal. Nucl. Chem.2012, 293, 529.
22. http://www.cetesb.sp.gov.br/solo/vegetais/34-ensaio-de-germinacao-e-alongamento-de-raizes accessed in August 2013. 23. Masarwa, M.; Cohen, H.; Meyerstein, D.; Hickman, D. L.;
Bakac, A.; Espenson, J. H.; J. Am. Chem. Soc.1988, 110, 4293.
24. Goldstein, S.; Meyerstein, D.; Czapski, G.; Free Radical Biol. Med.1993, 15, 435.
25. Souza, D. R.; Duarte, E. T. F. M.; Girardi, G. S.; Velani, V.; Machado, A. E. H.; Sattler, C.; Oliveira, L.; Miranda, J. A.; J. Photochem. Photobiol., A2006, 179, 269.
26. Khan, J. A.; He, X. X.; Khan, H. M.; Shah, N. S.; Dionysiou, D. D.; Chem. Eng. J.2013, 218, 376.
27. Trovó, A. G.; Nogueira, R. F. P.; J. Braz. Chem. Soc.2011, 22, 1033.
28. Trovó, A. G.; Silva, T. F. S.; Gomes Jr., O.; Machado, A. E. D.; Borges Neto, W.; Muller Jr., P. S; Daniel, D.; Chemosphere
2013, 90, 170.
29. Nogueira, R. F. P.; Trovó, A. G.; Modé, D. F.; Chemosphere
2002, 48,385.
30. Monteagudo, J. M.; Duran, A.; Corral, J. M.; Carnicer, A.; Frades, J. M.; Alonso, M. A.; Chem. Eng. J.2012, 181, 281. 31. Safarzadeh, A.; Bolton, J. R.; Cater, S. R.; Water Res.1997, 31,
787.
32. Faust, B. C.; Hoigné, J.; Atmos. Environ.1990, 24A, 79. 33. Balmer, M. E.; Sulzberger, B.; Environ. Sci. Technol.1999, 33,
2418.
34. Wei, G. T.; Fan, C. Y.; Zhang, L. Y.; Ye, R. C.; Wei, T. Y.; Tong, Z. F.; Catal. Commun.2012, 17, 184.
35. Dong, Y.; He, L.; Yang, M.; Dyes Pigm.2008, 77,343. 36. Jiang, C.; Pang, S.; Ouyang, F.; Ma, J.; Jiang, J.; J. Hazard.
37. Batista, A. P. S.; Nogueira, R. F. P.; J. Photochem. Photobiol., A
2012, 232, 8.
38. Malato, S.; Fernandez-Ibanez, P.; Maldonado, M. I.; Blanco, J.; Gernjak, W.; Catal. Today2009, 147, 1.
39. Kwan, C. Y.; Chu, W.; Water Res.2004, 38, 3382. 40. Kwan, C. Y.; Chu, W.; Chemosphere2007, 67, 1601. 41. Safarzadeh-Amiri, A.; Bolton, J. R.; Carter, S. R.; Sol. Energy
1996, 56, 439.
42. Safarzadeh-Amiri, A.; Bolton, J. R.; Cater, S. R.; J. Adv. Oxid. Technol.1996, 1, 18.
43. Silva, M. R. A.; Vilegas, W.; Zanonia, M. V. B.; Nogueira, R. F. P.; Water Res.2010, 44, 3745.
44. Duran, A.; Monteagudo, J. M.; Martin, I. S.; J. Environ. Manage.
2012, 98, 1.
45. Mendez-Arriaga, F.; Maldonado, M. I.; Gimenez, J.; Esplugas, S.; Malato, S.; Catal. Today2009, 144, 112.
Submitted: March 11, 2013