Comparisons between two wavelet functions in extracting coherent structures from solar wind time
series
M. J. A. Bolzan∗ and F. L. Guarnieri
Instituto de Pesquisa e Desenvolvimento, Universidade do Vale do Para´ıba (UNIVAP), S˜ao Jos´e dos Campos, Brazil Paulo Cesar Vieira
Instituto de Pesquisa e Desenvolvimento, Universidade do Vale do Para´ıba (UNIVAP), S˜ao Jos´e dos Campos, Brazil (Received on 6 March, 2008)
Nowadays, wavelet analysis of turbulent flows have become increasingly popular. However, the study of geometric characteristics from wavelet functions is still poorly explored. In this work we compare the perfor-mance of two wavelet functions in extracting the coherent structures from solar wind velocity time series. The data series are from years 1996 to 2002 (except 1998 and 1999). The wavelet algorithm decomposes the annual time-series in two components: the coherent part and non-coherent one, using the daubechies-4 and haar wavelet function. The threshold assumed is based on a percentage of maximum variance found in each dyadic scale. After the extracting procedure, we applied the power spectral density on the original time series and coherent time series to obtain spectral indices. The results from spectral indices show higher values for the coherent part obtained by daubechies-4 than those obtained by the haar wavelet function. Using the kurtosis statistical parameter, on coherent and non-coherent time series, it was possible to conjecture that the differences found between two wavelet functions may be associated with their geometric forms.
Keywords: Wavelet Analysis; Coherent Structures; Solar Variables; Turbulence
1. INTRODUCTION
The turbulence is still an open problem in Physics and it constitutes a multiscale phenomena. An approach to turbu-lence like Direct Numerical Simulation (DNS) is impracticable due the computational obstacle. So, Larg-Eddy Simulations (LES) become a good approach for computational calculations of complex turbulent flows [7]. Recently, Farge et al. [8] de-veloped the Coherent Vortex Simulation (CVS) which use the wavelet approach to deterministically simulate the time evo-lution of the coherent vortex. They used the assumption that coherent vortices are responsible for the non-Gaussianity of the Probability Density Function (PDF) of vorticity. Thus, the study of the statistical characteristics of the turbulence is an important tool to understand the physical mechanisms acting in the energy transfer between scales. In particular, the statis-tical study of Magnetohydrodynamical (MHD) turbulence is important to understand the energy transfers within the Solar-Terrestrial system. The consequences of solar disturbances on the magnetosphere-ionosphere system from Earth, have been analyzed in several studies, showing the importance of the in-termittence and Coherent Structures (CS) present in the MHD flow [2, 16, 18]. According to Hussain [13], CS are turbulent variables (velocity, temperature, density and others) that have high self-correlation or with another variables in the deter-mined time scale. Furthermore, Burlaga and Mish [4] have ar-gued that the−2 spectral index found in the solar wind velocity may arise if coherent power is present in large-amplitude, low-frequency fluctuations. These large-amplitude low-low-frequency fluctuations are related to shocks evolving in the solar wind. The structures are strongly associated with energy dissipation of the turbulent flows and also a source of instability, at least in some scales.
Due to the problem related to the presence of CS in time
∗Electronic address: [email protected]
series, several works have been developing methodologies to detect and extract the CS from time series [9, 12, 21] using the Wavelet Transform (WT). However, there is still the prob-lem related to the choice of the wavelet function to perform the CS extraction. In fact, only a few studies have focused the geometric properties of the wavelet and coherent structures [3, 19]. Thus, in the present work, a comparison between re-sults from extraction of CS performed by two wavelet func-tions from solar wind velocity time series is presented. The power spectral index and statistical analysis are used to quan-tify the possible differences. The WT was used to separate the solar wind velocity in two components: one that contains only the coherent (CS) part removed from original time se-ries, and the other component containing information about the non-coherent (NC) part.
2. DATA
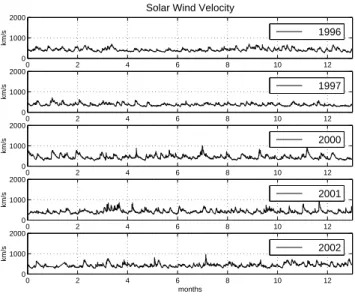
Solar wind data from SOHO satellite obtained in the public internet addressCELIAS/MTOF http://umtof.umd.edu/pmwas employed in this study. Data were obtained between years 1996 to 2002, except 1998 and 1999, with 1-hour time resolu-tion (approximately 2.78X10⁻⁴Hz). Figure 1 show the solar wind velocity plots for the five years analyzed.
ve-0 2 4 6 8 10 12 0
1000 2000
km/s
Solar Wind Velocity
1996
0 2 4 6 8 10 12
0 1000 2000
km/s
1997
0 2 4 6 8 10 12
0 1000 2000
km/s
2000
0 2 4 6 8 10 12
0 1000 2000
km/s
2001
0 2 4 6 8 10 12
0 1000 2000 km/s months 2002
FIG. 1: Solar wind velocity time series for the five years shown in legend, measured by SOHO satellite.
locity [20], temperature [1] or magnetic fields [16, 18]. Thus, we used the approach of this Kolmogorovian scenario to study this data set.
3. THEORETICAL BACKGROUNDS
3.1. Wavelet Transform
The WT is a mathematical tool able to analyze any non-stationary time-series, showing the temporal variability of the power spectral density. The ”wavelet” word indicates a set of functions with the form of small waves created by dila-tions,Ψ(t) =Ψ(2t), and translations,Ψ(t) =Ψ(t+1), applied on a simple generator function,Ψ(t), which is called mother-wavelet. Mathematically, the wavelet function, with a scalea and at positionb, is given by
Ψa,b(t) =a−1/2Ψ
t−b
a
, (1)
wherea andb are real anda>0. The wavelet transform is defined by
Wψf(a,b) =√1 2
Z
f(t)Ψa,b(t)dt, (2)
where the temporal function f(t)is any time series.
There are two types of wavelet functions: orthogonal and non-orthogonal wavelets [6]. The most used orthogonal wavelet families are: haar, meyer, and daubechies, that are used for filtering/decomposition of the time series. The most famous non-orthogonal wavelet families are: morlet and the mexican-hat. For this study, we used two orthogonal wavelet functions: daubechies-4 and haar [5, 20]. The haar func-tion is orthogonal, with dilafunc-tion being dyadics in the form a=2−jand its translations occur in discrete steps, in the form b=2−jk, where jandkare integers. This wavelet function is
given by:
Ψj,k(t) =
2j/2, 2−jk≤t<(k+1/2)
−2j/2, 2−j(k+1/2)≤t<(k+1)
0, all other values of t
The daubechies wavelet filters are the ones commonly used in image retrieval [17]. In general,dbnrepresents the family
of daubechies wavelets, andnis the order. It is important to note that the family includes haar wavelet since it represents the same wavelet asdb1. The wavelets are built based in an
small functionφ(t), given by [17]:
φ(t) =√2
∑
k
lkφ(2t−k), (3)
whereφis called scale function or scaling wavelet. The mother waveletψis obtained by:
ψ(t) =√2
∑
k
hkφ(2t−k), (4)
wherelk andhk are called coefficients of low-pass and
high-pass filters, and are related by:
hk= (−1)kl1−k. (5)
For thedb4used in this work, the coefficients for low-pass
and high-pass filter are, respectively:
n √
3+1 4√2 ,
√
3(√3+1) 4√2 ,
√
3−1 4√2,
√
3(√3−1) 4√2
o .
n
−
√
3(√3−1) 4√2 ,
√
3−1 4√2 ,
√
3(√3+1) 4√2 , −
√
3+1) 4√2
o .
We chose the db4 wavelet because this function is more
regular thandb2, where the regularity increases with the order
n. Figure 2 shows the mother and scaling wavelets ofdb4and
haar forj=0 andk=0.
0 0.2 0.4 0.6 0.8 1
−1.5 −1 −0.5 0 0.5 1 1.5
ψ0,0, haar
0 0.2 0.4 0.6 0.8 1
−1.5 −1 −0.5 0 0.5 1 1.5
ψ0,0, db4
0 0.2 0.4 0.6 0.8 1
−1.5 −1 −0.5 0 0.5 1 1.5
φ, haar
0 0.2 0.4 0.6 0.8 1
−1.5 −1 −0.5 0 0.5 1 1.5
φ, db4
3.2. Procedure for Coherent Structures Extraction
In order to study the performance of the two wavelet func-tions in extracting the CS, the time series was decomposed in all dyadic scales, i.e., if the time series isndata points long, it is possible to decompose it in jdyadic scales ofn=2j. In the following step, we performed the variance in each dyadic scale to find the scale where the variance has maximum value. After this, we used a fixed threshold of 95% maximum vari-ance found in a given scale and to separate the coherent (CS) and non-coherent (NC) wavelet coefficients. In this way, the wavelet coefficients with values higher than 95% maximum variance are considered due to CS, and wavelet coefficients be-low this threshold are considered the NC part. Finally, the CS and NC parts are then reconstructed by the WT inverse. Note that we use the same assumption used by Ruppert-Felsot et al. [21], i.e., the original time series can be represented by a few large amplitude wavelet coefficients, while the noise is con-tained by several remaining coefficients of small amplitude.
3.3. Statistical Analysis
The intermittent nature of the any physical quantity, can be investigated through the called Probability Density Func-tion (PDF) of a set of two-point difference in time-series,
δHr(t) = δH(t)− hδH(t)i/σ, of the original field,H, where σmeans the standard deviation of the differenced time-series. The parameter r represents a temporal increment. For ordi-nary HD or MHD fluids, intermittency appears in the heavy tails of the distribution functions at moderate scales implying non-Gaussian statistical behavior of the systems [10]. Frisch [10], proposed a way to quantify the degree of deviation from Gaussian distributions, i.e. the level of intermittency at differ-ent scales. We computed the kurtosis values of the two-points difference time-series defined as:
F= <δHr(t)
4> <δHr(t)2>2
(6) where, again, the parameterr represents an increment scale. The kurtosis of a normally distributed process is equal to 3 [10]. Adding intermittent fluctuations to an originally Gaus-sian signal implies the spreading of its PDF and, consequently, the increase of its kurtosis value. We will calculate the kur-tosis in 18 logarithmically spaced scales for Original, CS and NC parts obtained by haar anddb4.
4. RESULTS AND DISCUSSION
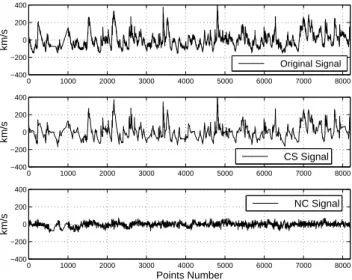
The process above mentioned was applied in five annual time series. Figure 3 shows the results of this filter process using thedb4, where the upper panel shows the original time
series, the middle panel shows the CS information, and the bottom panel contains the NC part time series. We note that the CS signal (middle panel in Fig. 3) presents the same large structures observed in the original signal. This fact is an impor-tant point fromdb4wavelet function because it is necessary to
extract the real information from original signal without intro-duce unreal information. Figure 4 shows the same time series
0 1000 2000 3000 4000 5000 6000 7000 8000
−400 −200 0 200 400
km/s
Original Signal
0 1000 2000 3000 4000 5000 6000 7000 8000
−400 −200 0 200 400
km/s
CS Signal
0 1000 2000 3000 4000 5000 6000 7000 8000
−400 −200 0 200 400
km/s
Points Number
NC Signal
FIG. 3: Daubechies-4 filter process applied to solar wind velocity data for year 2002. Top panel shows the original time series, middle panel shows 95% of CS, and bottom panel shows the NC time series.
0 1000 2000 3000 4000 5000 6000 7000 8000
−400 −200 0 200 400
km/s
Original Signal
0 1000 2000 3000 4000 5000 6000 7000 8000
−400 −200 0 200 400
km/s
CS Signal
0 1000 2000 3000 4000 5000 6000 7000 8000
−400 −200 0 200 400
km/s
Points Number
NC Signal
FIG. 4: Haar filter process applied on solar wind velocity data for year 2002. Top panel shows the original time series, middle panel shows 95% of CS, and bottom panel shows the NC time series.
but obtained by haar filtering process where, in this case, we note that the haar function creates false features such as rectan-gular forms on the CS time series shown in middle panel (Fig. 4). However, it is important point out that the NC part from both extractions shows evidence of coherent structures as well. In fact, we conjecture that this behavior may be due the non optimal choice of the threshold that do not permit to extract efficiently the all coherent structure presents in the time series. Even so, our objective here is to do a preliminary study about the two wavelet functions and to use a methodology based in statistical approach to compare these two wavelet functions.
10−7 10−6 10−5 10−4 10−3 100
101 102 103 104 105 106 107 108 109
Energy
Frequency (Hz)
Original db4 filtered haar filtered
X 1000
X 50
FIG. 5: Power spectral density (PSD) applied for the solar wind time series shown in Fig. 2. The continuous line represents the PSD for the original time series; dotted line represents the PSD for the coherent signal filtered bydb4; dashed line represents the PSD for the coherent signal filtered by haar function. The three PSD were vertically shifted for better visualization.
3.0000
2.5000
U 2.0000
)( IV
-
•••-
...i
.!W'1.5000 ••ti
;ao
-(/) 1.00000.5000
0.0000
1996 1997
oOriginal Odb4
.raar
2000 2001 2002
FIG. 6: Absolute values of spectral index for original time series and CS time series fromdb4and from haar wavelets.
Square Fitting applied on loglog plots of the PSD. Figure 5 shows an example of PSD applied on the same time series shown in Fig. 2.
The power spectral indices for all time series are shown in Fig. 6. We observe superior values of spectral indices for CS time series obtained bydb4 filtering process when compared
with those CS for the time series obtained by haar filtering process. Note that we use the fact that the statistical theory of homogeneous turbulence suggests that the noise may have some correlation, which corresponds to a scaling law steeper than for a white noise, i.e. k−5/3 in 3D. Thus, the presence of the CS on the signal promotes the elevation of the spectral indices. These preliminary results indicate that thedb4wavelet
was better in extracting the CS from original time series. The mean values of spectral indices from CS time series fromdb4
was−(2.16±0.20), in agreement with results from Ishizawa and Hattori [14], who also used the WT procedure.
In order to define the best wavelet function betweendb4
0 0.5 1 1.5 2 2.5 3
0 10 20 30 40 50 60 70 80 90
Kurtosis
Kurtosis
Log10(r)
Original db4−C db4−NC h−C h−NC
FIG. 7: Kurtosis parameter mean values for original time series (con-tinuous line), coherent structure (square symbol) and non-coherent structure (square symbol and dotted line) time series fromdb4, and coherent structure (star symbol) and non-coherent structure (star sym-bol and dotted line) time series from haar process filtering.
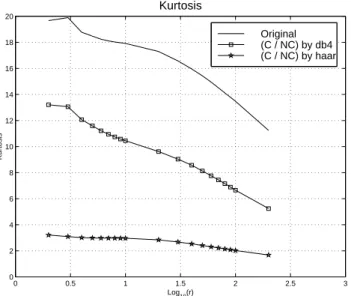
and haar, we calculated the kurtosis parameter. The kurtosis is a statistical parameter useful to detect the intermittent phe-nomena present in the time series [10] and was performed in 18 logarithmically spaced scales. Figure 7 shows the results of the kurtosis for the original time series, CS, and NC time series obtained fromdb4filtering process and also for CS and
NC time series obtained from haar. Note that the kurtosis mean values from NC time series for both wavelet functions are very close to a Gaussian distribution, i.e., kurtosis near to 3.
A rate between kurtosis mean values from CS and NC time series for both wavelet results showed above was evaluated. Figure 8 shows the mean values of this rate for kurtosis ob-tained fromdb4and haar filtering process. We observe that
the results fromdb4is closer to the results from original time
series than the results obtained with the haar wavelet. This fact shows that thedb4filtering process is the best method to
ex-tract more coherent structures from original time series when compared with haar results.
The results above mentioned are probably associated with the geometric form of each wavelet. In this sense, we observe that the db4 wavelet function have a geometric form much
closer to the geometric characteristics of the time series. This fact of the matching between wavelet functions and time se-ries explain also the difference of the spectral indices found in Fig. 6. We observed higher values of the spectral indices of CS time series fromdb4when compared with CS time
se-ries from haar, showing that thedb4wavelet function is able
to extract more physical information from original time series than haar wavelet function. The fact thatdb4wavelet function
presents better results than haar wavelet may be explained by thedb4anti-symmetric form. This idea was already pointed
de-0 0.5 1 1.5 2 2.5 3 0
2 4 6 8 10 12 14 16 18 20
Kurtosis
Kurtosis
Log10(r)
Original (C / NC) by db4 (C / NC) by haar
FIG. 8: Kurtosis values for original time series (continuous line), kur-tosis of the rate between CS and NC time series obtained for db4 (square symbol) and for haar filtering process (star symbol).
tecting zones of concentrated shear, while symmetric wavelets result in detection of zones of concentrated curvature.”
This is only a preliminary study since it is necessary to compare results obtained in different percentage values of co-herent structure extraction. Further studies may focus on the comparison of these results for different solar cycle phases (such as a minimum, during year 1996, and a maximum around year 2001), and also estimate the CS detection/extraction algo-rithm efficiency. Anyway, the results here presented can give an orientation for the choice of an appropriated wavelet to be employed in the extraction of coherent structures from turbu-lent time series measured in hydrodynamic and magnetohy-drodynamic environment.
5. CONCLUDING REMARKS
In this work, we performed a comparison from CS extrac-tion results between two wavelet funcextrac-tions:db4and haar. For
this, we used the annual time series of the solar wind veloc-ity measured by the SOHO satellite since 1996 to 2002 years (except 1998 and 1999).
Results from power spectral shown that, the coherent part obtained fromdb4wavelet function present higher values of
the spectral indices than the values obtained by haar wavelet. We applied the statistical parameter kurtosis, in CS and NC time series obtained by both wavelet functions and also for original time series. The non-coherent time series obtained by both wavelet functions showed Gaussianity characteristics (kurtosis near to 3). The results indicate that the both wavelet functions are able to extract coherent structures, however, the coherent time series showed that thedb4wavelet function was
able to extract more coherent structures than the haar wavelet. We conjecture that the good matching between the geometric form of thedb4and the characteristics from original time
se-ries, lead to the best results. However, we noted that the NC part presented some evidence of coherent structures. We think that this fact is due to a non optimal choice of the threshold in the extraction process. Thus, in future works will study the be-havior of these results as a function of changes in the threshold value.
6. ACKNOLEDGMENTS
The authors tanks to all people from CELIAS/MTOF experiment on the Solar Heliospheric Observatory (SOHO) spacecraft by a vailable data. M. J. A. Bolzan thanks to FAPESP (grant n. 2005/00511-9) and CNPq (grants n. 310431/2006-9) (Brazilian agencies) by financial support.
[1] M. J. A. Bolzan, F. M. Ramos, L. D. A. S´a, C. Rodrigues Neto, R. R. Rosa. Journal of Geophysical Research, 107(D20), doi:10.1029/2001JD000378, 2002.
[2] M. J. A. Bolzan. Brazilian Journal of Physics, 35(3A), 592-596, 2005.
[3] M. J. A. Bolzan, P. C. Vieira. Brazilian Journal of Physics, 36(4A), 1217-1222, 2006.
[4] L. F. Burlaga, W. H. Mish. Journal of Geophysical Research-Space Physics, 92(A2), 1261-1266, 1987.
[5] A. S. L. O. Campanharo, F. M. Ramos, E. E. N. Macau, R. R. Rosa, M. J. A. Bolzan, L. D. A. S´a. Philosophical Transactions of the Royal Society A-Mathematical Physical and Engineering Sciences, 366(1865), 579-589, 2008.
[6] I. DaubechiesTen lectures on wavelets, SIAM, Philadelphia, 1992, pp. 278-285.
[7] G. A. Degrazia, A. B. Nunes, P. Satyamurty, O. C. Acevedoa, H. F. C. Velho, U. Rizza, J. C. Carvalho. Atmospheric Environ-ment, 41(33), 7059-7068, 2007.
[8] M. Farge, K. Schneider, N. Kevlahan. Physics of Fluids, 11(8), 2187-2201, 1999.
[9] M. Farge, N. K.-R. Kevlahan, V. Perrier, , K. Schneider. Turbu-lence analysis, modeling and computing using wavelets, in: J. C.
van den Berg (ed.),Wavelet in Physics, Cambridge University Press, 117-190 (1999).
[10] U. Frisch, Turbulence. Cambridge: Cambridge University Press, UK, 1995.
[11] C. R. Hagelberg, N. K. K. Gamage. Boundary-Layer Meteorol-ogy, 70(3), 217-246, 1994.
[12] L. Hudgins, J. H. Kaspersen. Wavelets and detection of co-herent structures in fluid turbulence, in: J. C. van den Berg (ed.),Wavelet in Physics, Cambridge University Press, 201-225 (1999).
[13] A. K. M. F. Hussain. Physics of Fluids, 26(10), 303-356, 1983. [14] A. Ishizawa, Y. Hattori. Journal of Phys. Soc. Jpn, 67, 441, 1998. [15] A. N. Kolmogorov. Journal of Fluid Mechanics, 13(1), 82-85,
1962. (see also in Proc. R. Soc. Lond. A, 434, 9-13, 1991). [16] P. Kov´acs, V. Carbone, Z. V¨or¨os. Planetary and Space Science,
49, 1219-1231, 2001.
[17] T. Li, M. Ogihara. IEEE Transactions on Multimedia, 8(3), 564-574, 2006.
[18] A. T. Y. Lui. Journal of Atmospheric and Solar-Terrestrial Physics, 64, 125-143, 2002.
[20] F. M. Ramos, M. J. A. Bolzan, R. R. Rosa, L. D. A. S´a. Physica D - Nonlinear Phenomena, 193, 278-291, 2004.