Mafalda Dias de Medeiros Vale da Camara
Licenciatura em Ciências da Engenharia BiomédicaCoherence and Phase Locking Disruption in
Electromyograms of Patients with
Amyotrophic Lateral Sclerosis
Dissertação para obtenção do Grau de Mestre em Engenharia Biomédica
Orientador :
Hugo Gamboa, Professor Auxiliar, Faculdade de
Ciências e Tecnologia da Universidade Nova de
Lisboa
Co-orientadora :
Carla Quintão, Professora Auxiliar, Faculdade de
Ciências e Tecnologia da Universidade Nova de
Lisboa
Júri:
Presidente: Doutor Mário Forjaz Secca Arguente: Doutor Benjamim Ohana
Coherence and Phase Locking Disruption in Electromyograms of Patients with Amyotrophic Lateral Sclerosis
Copyright cMafalda Dias de Medeiros Vale da Camara, Faculdade de Ciências e Tec-nologia, Universidade Nova de Lisboa
Acknowledgements
First, I thank my supervisor, Professor Hugo Gamboa, who has challenged me through-out my thesis. I offer my sincerest gratitude to my co-supervisor, Professor Carla Quin-tão, who always presented me different paths and solutions when problems emerged, and encouraged me to think further; this work would have never been written without her support, motivation, knowledge, or patience. To Doctor Professor Mamede Carvalho and Doctor Susana Pinto, many thanks for allowing me the room and patients in Hospital Sta Maria, to perform acquisitions, and their availability and comfortable spirit. This the-sis could not have been performed without their support, faith and trust in me. To both, I thank for the environment and knowledge that the Hospital offered me. To PLUX-Wireless Biosignals, S.A., professional workers for welcoming me every day and making me feel a part of the group.
To my colleges Marília and Inês, a big thank you to both for all the funny moments, adventures and help. A special thank you to Marília who stood by me every day with her available support, motivation and cheerfulness. Her daily presence made me win the day and without it, my work would have never been the same.
Abstract
In motor neuron disease, the aim of therapy is to prevent or slow neuronal degeneration and early diagnosis is thus essential. Hypothesising that beta-band (15−30 Hz) is a mea-sure of pathways integrity as shown in literature, coherence and PLF could be used as an electrophysiological indicator of upper and lower neuron integrity in patients with ALS. Before further analysis, synthetic EMG signals were computed to verify the used algo-rithm. Coherence and PLF analyses were performed for instants of steady contraction from contra and ipsilateral acquisitions. Ipsilateral acquisitions were performed for one member of each group and results present significant differences between both groups. Contrarily, contralateral acquisitions were performed on 6 members of each group and results present no significant differences. PLF analysis was computed for ipsilateral ac-quisitions and, similarly to coherence, results show significant differences between both groups. PLF was also analysed for contralateral acquisitions, and results show no signif-icant differences within groups, as expected since no coherence was found for the same acquisitions. So, while control subjects present no neuronal or muscular problems and therefore higher synchrony and coherence for beta-band frequencies, patients with ALS do not present synchronism or coherence in any frequency, specially for beta-band. All results allowed to conclude that contralateral coherence is not a good measure of cor-ticospinal pathways integrity. However, ipsilateral acquisitions show promising results and it is possible to affirm that ipsilateral measurements may reflect neuronal degenera-tion. For future work is suggested a deeper analysis of PLF, that appear to have potential as a quantitative test of upper and lower neuron integrity related to ALS.
Resumo
Em doenças neuromotoras, o objectivo da terapia é prevenir ou retardar a degenera-ção neuronal, sendo o diagnóstico precose essencial. Assumindo, como observado na literatura, que a banda beta (15−30 Hz) é uma medida de integridade dos percursos neuronais, a coerência e o PLF podem ser usados como um indicador electrofisiológico da integridade superior e inferior neuronal em pacientes com ELA. Para verificar o al-goritmo utilizado foram criados sinais sintéticos de EMG. Análises de coerência e PLF foram realizadas para instantes de contracção estática em aquisições contra e ipsilate-rais. Aquisições ipsilaterais foram realizadas num membro de cada grupo de sujeitos e os resultados apresentam diferenças significativas entre ambos os grupos. Pelo contrário, aquisições contralaterais foram realizadas em 6 membros de cada grupo e os resultados não apresentam diferenças significativas. Análises de PLF foram realizadas em aquisi-ções ipsilaterais e, tal como na coerência, os resultados apresentam diferenças significati-vas entre ambos os grupos, enquanto que em aquisições contralaterais, os resultados não demonstram diferenças entre os grupos, uma vez que a coerência não foi significativa para estas mesmas aquisições. Enquanto sujeitos de controlo não apresentam qualquer problema neuronal ou muscular e portanto apresentam maior sincronia e coerência para a banda beta, pacientes com ELA não apresentam sincronismo nem coerência para ne-nhuma frequência, especialmente para a banda beta. Todos os resultados permitem con-cluir que coerência contralateral não é um bom indicador da integridade de percursos corticoespinhais. No entanto, aquisições ipsilaterias demonstram resultados promissores e é possível afirmar que podem reflectir degeneração neuronal. Futuramente sugere-se uma análise mais aprofundada do PLF, que aparenta ter potencial quantitativo no estado de integridade neuronal superior e inferior, relacionada com a ELA.
Contents
1 Introduction 1
1.1 Motivation . . . 1
1.2 Objectives . . . 2
1.3 State - of - the - art. . . 2
1.4 Thesis Overview . . . 5
2 Theoretical background 7 2.1 Scientific support . . . 7
2.1.1 ASL – Amyotrophic Lateral Sclerosis. . . 7
2.1.2 Propagation of nervous impulses . . . 8
2.1.3 Motor units and action potentials. . . 10
2.1.4 Electromyography (EMG) . . . 11
2.1.5 Patterns in EMG analysis . . . 13
2.2 Technical base . . . 14
2.2.1 Signal Acquisition . . . 14
2.2.2 Recording device . . . 14
2.2.3 Sampling frequency . . . 14
2.2.4 Electrodes . . . 15
2.2.5 Low-level processing . . . 16
2.2.6 High-level processing . . . 17
3.2 Acquisition Protocol . . . 22
3.3 Recording . . . 23
4 Signals Processing 25 4.1 Low-level Processing . . . 25
4.2 Hight-level Processing . . . 27
4.2.1 Coherence Processing . . . 27
4.2.2 PLF Processing . . . 28
5 Results and Discussion 31 5.1 Synthetic EMG Signals . . . 31
5.2 Coherence Tests . . . 35
5.3 Coherence Analysis . . . 36
5.3.1 Ipsilateral . . . 36
5.3.2 Contralateral . . . 37
5.4 PLF Analysis . . . 44
5.4.1 Ipsilateral . . . 44
5.4.2 Contralateral . . . 45
5.5 One Long Contraction . . . 46
6 Conclusions 49
List of Figures
1.1 Thesis Overview Diagram. . . 5
2.1 Dying – forward” postulates that ALS is a disorder of corticomotoneurons,
which connect monosynaptically with the anterior horn cells, mediating
anterograde degeneration of anterior horn cells (via glutamate
excitotox-icty). The “dying – back” theory postulates that ALS begins within
mus-cle cells or neuromuscular junctions; there is a deficiency of a motor
neu-rotrophic hormone, which is normally released by postsynaptic cells and
retrogradely transported up the presynaptic axon to the cell body. . . 9
2.2 Upper motor neurons driving impulses through descending pathways into
spinal cord – anterior horn cell - nerve root, which via synapses (glutamate
neurotransmissor), transmit information to lower motor neurons, which
via synapses (acetylcholine), transmit it to muscle fibres. . . 10
2.3 Schematic representation of a motor unit, composed by a motoneuron from
the spinal cord, innervating muscle fibres through neuromuscular junction
[1].. . . 11
2.4 Schematic representation of twitch contraction as a response to a single
stimulus after a latent period. . . 12
2.5 BioPLUXresearch system. . . 15
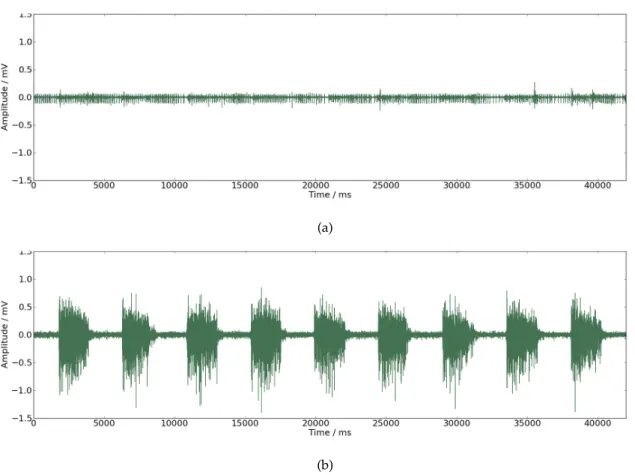
3.1 (a) EMG signal from a patient with incapacity to control his own
move-ments. (b) EMG signal from a patient with capacity to control his own
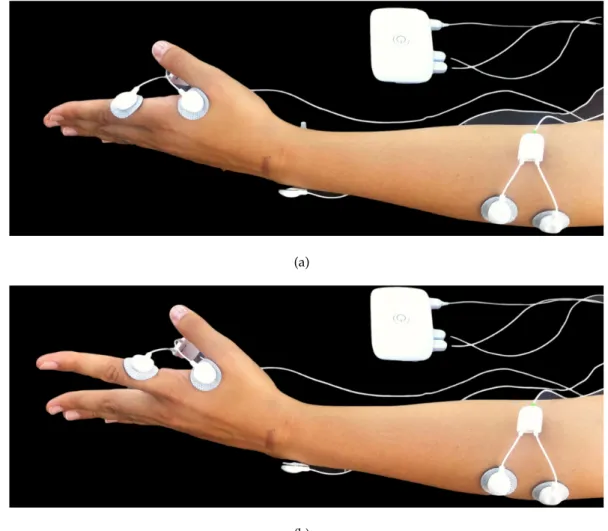
3.2 Ipsilateral acquisitions experimental setup: Bioplux research device,
place-ment of two EMG sensors and ground. (a) Instant of relaxation. (b) Instant
of contraction. . . 23
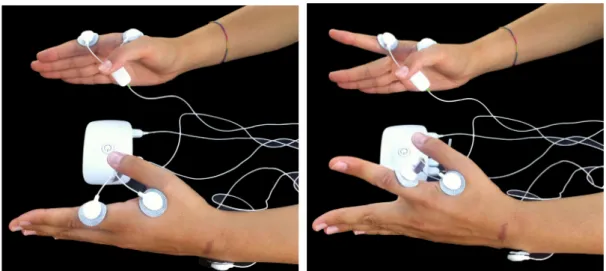
3.3 Contralateral acquisitions experimental setup: Bioplux research device,
placement of two EMG sensors and ground. (a) Instant of relaxation. (b)
Instant of contraction.. . . 24
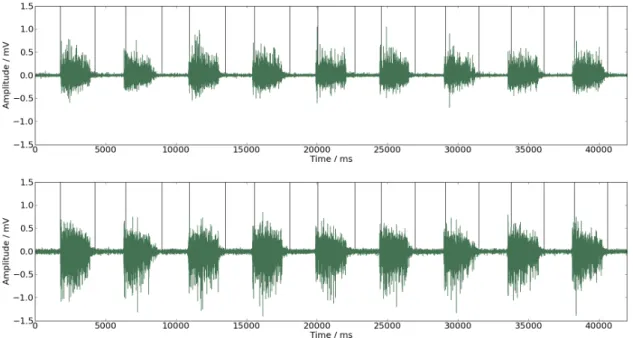
4.1 EMG signal with estimated common intervals of contraction. Black
verti-cal lines represent on and offsets instants. . . 27
4.2 (a) Band pass filter[15,2000]Hz applied to all studied signals before pro-cessing. (b) Example of a band pass filter [f −2, f + 2] withf as 20 Hz, applied on a set of signals to calculate PLF for the given frequency of 20 Hz;
delimited by the grey box, are represented the frequencies corresponding
to beta-band. . . 29
5.1 Schematic representation of the signal defined by equation 5.1 in (a), and
the signal defined by equation 5.2 in (b). . . 32
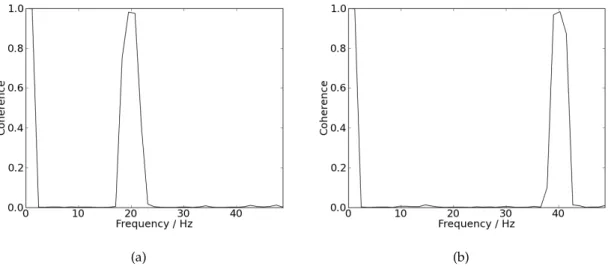
5.2 (a) Coherence values for signals defined by equation 5.2 with f as 20Hz. (b) Coherence values for signals defined by equation 5.2 withf as 40Hz. . 33
5.3 Signals defined by equation 5.2 with f placed as 40 Hz. (a) Signal with
391s. (b) Signal with8s. . . 33
5.4 (a) Coherence values between two signals like those represented in figure
5.4(a). (b) Coherence values between two signals like those represented in
figure 5.4(b). . . 34
5.5 Coherence values between two signals defined by equation 5.1 with f
placed as 40 Hz. (a) Coherence for signals with 391s. (b) Coherence for signals with8s. . . 35
5.6 (a) Coherence between one chosen signal and itself. (b) Coherence between
two random signals. Both are calculated with NFFT as 4096. . . 36
5.7 (a) Ipsilateral coherence results acquired from the member of the group of
patients. (b) Ipsilateral coherence results acquired from the member of the
group of control. Delimited by the grey box are represented the frequencies
5.8 Schematic representation of frequency intensity dependency; delimited by
the grey box are represented the frequencies corresponding to beta-band.
(a) Results for the group of patients collected from the left hand. (b) Results
for the group of patients collected from the right hand. . . 37
5.9 Schematic representation of frequency intensity dependency; delimited by
the grey box, are represented the frequencies corresponding to beta-band.
(a) Results for the control group collected from the left hand. (b) Results
for the control group collected from the right hand. . . 38
5.10 Schematic representation of frequency intensity dependency assuming NFFT
as 1024; delimited by the grey box are represented the frequencies
corre-sponding to beta-band. (a) Results for the group of patients collected from
the left hand. (b) Results for the group of patients collected from the right
hand. . . 38
5.11 Schematic representation of frequency intensity dependency assuming NFFT
as 1024; delimited by the grey box are represented the frequencies
corre-sponding to beta-band. (a) Results for the control group collected from the
left hand. (b) Results for the control group collected from the right hand. . 39
5.12 Schematic representation of frequency intensity dependency assuming NFFT
as 2048; delimited by the grey box are represented the frequencies
corre-sponding to beta-band. (a) Results for the group of patients collected from
the left hand. (b) Results for the group of patients collected from the right
hand. . . 39
5.13 Schematic representation of frequency intensity dependency assuming NFFT
as 2048; delimited by the grey box are represented the frequencies
corre-sponding to beta-band. (a) Results for the control group collected from the
left hand. (b) Results for the control group collected from the right hand. . 40
5.14 Schematic representation of mean coherence dependency on frequency by
the straight line and standard deviation by the dotted line, with NFFT
placed at 1024; delimited by the grey box are represented the frequencies
corresponding to beta-band. (a) Results from the group of patients. (b)
5.15 Schematic representation of mean coherence dependency on frequency by
the straight line and standard deviation by the dotted line, with NFFT
placed at 2048; delimited by the grey box, are represented the
frequen-cies corresponding to beta-band. (a) Results from the group of patients.
(b) Results from the group of subjects. . . 42
5.16 Schematic representation of mean coherence dependency on frequency by
the straight line and standard deviation by the dotted line, with NFFT
placed at 4096 for the group of subjects; delimited by the grey box, is
rep-resented the frequencies corresponding to beta-band. . . 43
5.17 Schematic representation of mean PLF values dependency on frequency
by the straight line and standard deviation by the dotted line, for
ipsilat-eral acquisitions; delimited by the grey box are represented the frequencies
corresponding to beta-band. (a) Results from the group of patients. (b)
Re-sults from the control group.. . . 44
5.18 Schematic representation of mean PLF values dependency on frequency by
the straight line and standard deviation by the dotted line, for
contralat-eral acquisitions; delimited by the grey box are represented the frequencies
corresponding to beta-band. (a) Results from the group of patients. (b)
Re-sults from the control group.. . . 45
5.19 Signal acquired from a member of the control group, consisting in one long
muscle contraction. . . 46
5.20 Schematic representation of mean coherence values dependency on
fre-quency by the straight line and standard deviation by the dotted line;
de-limited by the grey box are represented the frequencies corresponding to
beta-band. (a) Results from ipsilateral acquisitions. (b) Results from
con-tralateral acquisitions. . . 47
5.21 Schematic representation of PLF mean values dependency on frequency
by the straight line and standard deviation by the dotted line; delimited by
the grey box are represented the frequencies corresponding to beta-band.
(a) Results from ipsilateral acquisitions. (b) Results from contralateral
Acronyms
ALS Amyotrophic lateral sclerosis
CNS Central nervous system
EEG Electroencephalography
EMG Electromyography
LMN Lower motor neuron
MEG Magnetoencephalography
MRI Magnetic resonance imaging
RMS Root mean square
sEMG Surface EMG
UMN Upper motor neuron
DC Direct current
NFFT Nonequispaced fast Fourier transform
FFT fast Fourier transform
PSD Power spectral density
CSD Cross power spectral density
1
Introduction
1.1
Motivation
Amyotrophic lateral sclerosis (ALS), one of the major neurodegenerative diseases, is a
progressive incurable motor neuron disorder fatal in all cases. Studies of European
citi-zens established that the incidence ofALSis at 2 – 16 per 100 000 person-years. Despite
being a global disease, incident data is still unknown. Associated therapy involves
slow-ing down or even preventslow-ing neuronal degeneration, focussslow-ing on strategies for early
diagnosis and/or treatment [2].
Significant efforts have been made to diagnose and cure this disease but research is
focused on extending longevity, improving patients live quality and therapies,
undertak-ing clinical trials, collectundertak-ing population data in order to take measures to avoid onset and
discovering triggers [2].
As a general rule, patients with ALSare diagnosed when there is already extensive
motor neuron degeneration present, since the diagnosis is hampered by our impossibility
to access the corticospinal tract. Since no definitive diagnostic test or biomarker exists for
ALSbut only clinical criteria, this project intends to measure coherence and Phase locking
factor (PLF) between a number of specific muscles, establishing oscillation frequencies
1. INTRODUCTION 1.2. Objectives
1.2
Objectives
The aim of this thesis is to observe differences in frequency and time domains, between
both control and patients withALSgroup where upper motor neuron degeneration,
as-sociated with the difficulties in assessing corticospinal tract, is difficult to diagnose.
Based on Electromyography (EMG) signal patterns and behaviour, using coherence
andPLFmethods, the aim is to evaluate these patterns and determine whether an
indi-vidual is affected by degenerative diseases. An acquisition protocol, signal recordings
and processing are necessary in order to obtain information about physiological patterns
enabling the comparison of differentEMGsignals in a given patient and later in a
popu-lation withALS.
1.3
State - of - the - art
As defined by El Escorial [3,4], diagnosingALSin patients requires electrophysiological
tests (and the exclusion of other pathologies) to detect lower and upper motoneurons
degeneration, being the last one the hardest to observe [5]. Much research has been
con-ducted in order to provide faster and more accurate diagnosis for this disease. After El
Escorial review, motor neuron disorders, where lower motor neuron abnormality is a
primary feature, became a trustworthy diagnose [6].
To detect, evaluate and quantify upper or lower motor degeneration, some methods
have been used, that may also be used as possible progression markers for clinical trials,
such as nasal pressure, maximum voluntary isometric contraction, neurophysiological
index, motor unit estimation, transcranial magnetic stimulation, magnetic stimulation,
triple stimulation technique, needle EMG signal analysis, tractography and diffusion
tensor-weighted Magnetic resonance imaging (MRI) [7,5,8]. These methods either detect
upper (less often) or lower motor neuron degeneration and usually with undetermined
sensitivity, extremely high costs and pain to the patient. Concerning therapy, Riluzole (a
drug), has been used in early trials with promising results [6].
Diagnosing motor neuron disease has been chiefly hampered by the incapacity to
ob-serve corticospinal tract integrity [6]. In order to evaluate corticospinal damage,
Babin-skisign and hyperreflexia may be useful as markers but they were proven not to be
1. INTRODUCTION 1.3. State - of - the - art
integrity, propagation of oscillatory activity may be studied.Farmer et al.[9] showed that
during movement development, both in frequency and time domains, synergetic action
of separated muscles becomes more closely connected by an increase in shared synaptic
drive. As shown in [9],EMG–EMGcoherence analysis reflects oscillatory
synchroniza-tion between common inputs to spinal motoneurons in specific frequency values and
originates from synchronous oscillations within networks of corticospinal neurons that
are then transmitted to spinal motoneurones via fast-conducting corticospinal pathways.
InFarmer et al. [9] has also been demonstrated that in the beta frequency (one type of
motor cortical oscillation) coherence and motor unit synchrony are present, pointing to
a significant common drive that leads to coactivation of muscles closely related and
hy-pothesized that it is associated with more efficient motor unit recruitment and increased
speed and accuracy when performing a motor task. Equally,Baker et al. [10] postulated
that these beta frequency oscillations provide a more efficient motor unit recruitment
than that provided by non-oscillatory drive. As defended inFisher et al.[6] in normal
sub-jects, beta-band oscillations can be observed in intermuscular coherence between
differ-ent muscles, proving a common cortical drive, and dependdiffer-ent on supraspinal structures.
Motor cortical oscillations are coherent with those in contralateral electromyograms as
observed inBaker et al.[11]. Also inBaker et al.[11] it was proven that coherence between
EMGand afferent discharges exists at higher frequencies, during a step-hold isometric
task.
Different frequencies seem to be related to the timing of different neuronal assemblies
(activated parts of network) which are associated with different types of sensory and
cognitive processes [12].
Some motor cortex cells are capable of synchronizing their discharge with local
os-cillations in a 20 – 30 Hz range of frequency. This synchronism happens during rest or
steady contraction but is not common during movement. Despite all the research on this
subject, there is no agreement on which function might induce such periodic activity [11].
Recent studies showed that corticomuscular coherence may be induced by ascendant
and descendent pathways, suggesting synchronous oscillations in sensorimotor
process-ing instead of playprocess-ing a purely motor role [6]. Some oscillatory cortical activity involves
pyramidal neurones and is reflected in the descending drive to the muscles, being
1. INTRODUCTION 1.3. State - of - the - art
muscle pairs through coherence in beta-band [13]. InCordivari et al. [13] the authors
con-clude thatEMG-EMGcoherence may be observed and modulated by peripheral nerve
stimulation. Motor unit recruitment and firing rate are essential to perform voluntary
movement and for motor control [8]. Mamede de Carvalho et al. [8] analysed firing rates
of motor units during slight voluntary activation in patients with ALS and compared
them with normal subjects in order to establish firing unit patterns and concluded that in
ALSpatients firing rate within lower motor neurons decreased comparatively to normal
subjects, thus diagnosis lower motor neuron degeneration.
Short duration synchronization has been established between pairs of motor-unit
spikes during the performance of a task in intrinsic hand muscles by observing a
cen-tral peak in cross-correlation histogram. In Conway et al. [14] the authors suggest that
this synchronization between motor units originates in rhythmic activity in central
mo-tor pathways that provide common inputs to motoneuronal pairs. Also inConway et al.
[14], using Magnetoencephalography (MEG), it’s exposed the relation between localized
rhythmic cortical activity and motor-unit activity. In several studies, as suggest inMima et al. [15], it is now accepted that synchronization between two separate neural systems
reflects the functional coupling between them.
Coherence and cross-correlation analyses have been applied to human walking
activ-ity and it was demonstrated that motor units from synergetic muscles receive a common
synaptic drive that is adjustable during task cycle and depends on an intact supraspinal
drive to the spinal cord [16]. Corticomuscular coherence measures contributions from
both ascending and descending pathways, which was proved by phase analysis, suggest
that muscles led the cortical recordings [17]. The timing of synchronism is dependent on
the intrinsic properties of the inhibitory interneurons and their conduction delay [18]. In Riddle et al. [19] it was found that corticomuscular coherence does not behave uniformly
between subjects and a plausible explanation may be the differences of multiple
interact-ing oscillatory processes, each of them with underlyinteract-ing phase relationships. Moreover,
evidence was obtained showing that coherence is a complex composite of multiple
inter-acting processes probably with a contribution from both afferent and efferent systems.
In order to diagnose disorders such as ALS, it is necessary to observe upper and
lower motor neuron function. Many techniques, as shown above, can be used to study
1. INTRODUCTION 1.4. Thesis Overview
either upper or lower degeneration (not both). This thesis intends to present a new
non-invasively form of studying upper and lower motor neuron degeneration, in the context
ofFisher et al. [6] publication, based on coherence andPLFintermuscular analysis and
providing a new effectively early diagnose ofALS.
1.4
Thesis Overview
This work structure can be divided in different steps represented in figure1.1. The first
two chapters are based on literature review related to signals analysis andALS
charac-teristics. Throughout this stage, state-of-the-art and theoretical background aboutEMG
signal, ALS, neuronal behaviour and time and frequency domain analysis, is reported
and documented. In response to the absence of a precise and quantitative method of
diagnosingALS, coherence andPLFanalyses were performed. Chapter 3 discusses the
acquisition protocol, groups of subjects and recording. Chapter 4 refers to signals
pro-cessing, namely to low and high level, including coherence andPLFalgorithm analysis.
Chapter 5 discusses all obtained results in this work, through algorithm validation tests,
coherence andPLFresults from ipsi and contralateral acquisitions. Chapter 6 presents all
conclusions from the entire work. Appendix contains two published papers within the
context of this research work. The language used to write this thesis was LATEX and the
software used to analyse all acquisitions was Python.
• 1. Introduction • 2. Theoretical Background
Thesis Topics Review
• 3. Acquisition • 4. Signals Processing
Data acquisitions
and analysis • 5. Results and Discussion
• 6. Conclusion
Results
• Publications Appendix
2
Theoretical background
This chapter, through different stages, contextualizes all aboard subjects in this work.
2.1
Scientific support
2.1.1 ASL – Amyotrophic Lateral Sclerosis
ALSis one of the major neurodegenerative diseases, a progressive disorder that involves
widespread degeneration of the motor system neurons from the destruction of layer V
pyramidal neurons from the motor cortex to the anterior horn of the spinal cord. It is a
devastating pathology with rapid and aggressive progression, with uncertain
pathogen-esis and fatal in outcome, with 50% of patients dying within 3 years of onset [6,7]. To
diagnose such disease it is necessary to find upper and lower motor neuron degeneration
in multiple regions: bulbar, cervical, thoracic and lumbar. Some features can be useful
as prognosis indicators, such as increased age of onset, low forced vital capacity, bulbar
onset and short time duration between the first symptoms and its presentation [7].
This disorder is characterized depending on the neurological regions affected, but
there are common features observed in all patients such as a rapidly progressive
weak-ness, muscle atrophy, muscle cramps, fasciculations, muscle spasticity, difficulties in
2. THEORETICAL BACKGROUND 2.1. Scientific support
dysarthria. Patients tend to lose their abilities to control voluntary movements and
symp-toms tend to greatly reduce their quality of life [2].
Many causal and pathogenetic hypotheses have been studied and proposed but the
disease remains poorly understood in terms of unifying causal hypothesis. Some factors
may alter the risk of developing ALSsuch as environmental factors, toxic risks factors,
family history, smoking, life-style, neurotoxins, consanguinity and genetic mutations
with the copper/zinc superoxide dismutase (SOD1) being the major one [7, 2]. Recent
studies focused on glutamate-induced excitotoxicity, dysregulation of intracell calcium,
autophagy, structural abnormalities of mitochondria, dysfunction of the
sodium/potas-sium ion pump, axonal transport defects and protein aggregation as other additional
pathologenic hypotheses [7, 2]. The mechanisms that mediate motor neuron
degener-ation by glutamate-induced excitotoxicity are supported by “dying - forward”, “dying
– back” hypothesis, or even that lower and upper degeneration occurs independently.
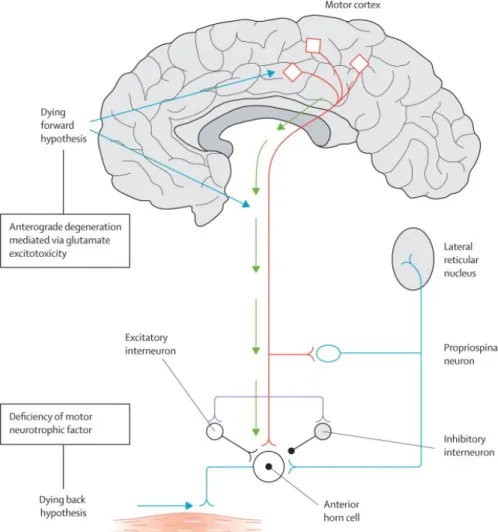
Evidence and explanations for all theories can be found in [2] and are showed in figure
2.1.
So far, only riluzole – an inhibitor of glutamate neurotransmitter - has been licensed
as a disease-modifying strategy for ALS, which is used to extend the lifespan of these
pa-tients by 3 months, but some others have been investigated: nerve growth factor,
recom-binant insulin-like nerve growth factor 1, ciliary neurotrophic factor and brain-derived
neurotrophic factor [7]. Since this disorder is incurable so far, patients are administered
with drugs that can relieve some symptoms and help cope with pain, particularly
mus-culoskeletal pain.
2.1.2 Propagation of nervous impulses
Central nervous system (CNS) influences muscle activity through two sets of neurons:
Upper motor neuron (UMN) and Lower motor neuron (LMN). A schematic
representa-tion is shown in figure2.2.
Upper motor neurons are derived from the motor cortex or the brainstem and carry
information through descending pathways until a specific nerve root from the spinal
cord, and are responsible for driving impulses for voluntary motor activity. The lower
motor neuron brings information fromUMNto muscle fibres. They can be classified
ac-cording to the muscle fibre type they innervate: alpha motor neurons which innervate
2. THEORETICAL BACKGROUND 2.1. Scientific support
Figure 2.1: Dying – forward” postulates that ALS is a disorder of corticomotoneurons, which connect monosynaptically with the anterior horn cells, mediating anterograde degeneration of anterior horn cells (via glutamate excitotoxicty). The “dying – back” theory postulates that ALS begins within muscle cells or neuromuscular junctions; there
2. THEORETICAL BACKGROUND 2.1. Scientific support
Figure 2.2: Upper motor neurons driving impulses through descending pathways into spinal cord – anterior horn cell - nerve root, which via synapses (glutamate neurotransmissor), transmit information to lower motor neurons, which via synapses
(acetylcholine), transmit it to muscle fibres.
neurons which innervate intrafusal muscle fibres and are responsible for proprioception.
All voluntary movements and motor control depends on motor unit recruitment and
firing rate, and hence the arousal ofLMNbyUMN, by means of synapses. As
demon-strated in the first study of motor unit activation performed with normal subjects (Adrain
and Bron, adapted from [20]): force exerted by a muscle during a voluntary contraction
was the result of the concurrent recruitment of motor units and modulation of the rate at
which they discharged action potentials.
2.1.3 Motor units and action potentials
Motor units are the basic component of muscular strength and contraction. Motor units
are composed by a motor neuron with a variable number of branches – depending on
muscle specificity - ending in different muscular fibres of the same type, innervated by
the motoneuron [1]; Schematic representation is shown in figure2.3.
To initiate the generation of muscle contraction, theCNSsends an electrical signal to
a motoneuron, which spreads along muscle fibres, initiating a cascade of
electrophysio-logical and electrochemical processes, giving rise to de-polarization and re-polarization
events known as action potential or nervous impulse that can be electrically measurable.
2. THEORETICAL BACKGROUND 2.1. Scientific support
Figure 2.3: Schematic representation of a motor unit, composed by a motoneuron from the spinal cord, innervating muscle fibres through neuromuscular junction [1].
potentials along a nervous fibre, by means of diffusion and the intensity of muscle
con-traction is controlled by the regularity of action potentials, i.e., how often it arrives and
innervates muscle fibres [1]. When a motoneuron receives an excitable signal, an
ac-tion potential reaches muscles fibres innervated by it through one terminal branch of the
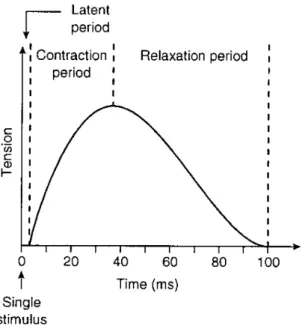
axon– ‘one-to-one’ relationship [1]. In response to a single stimulus, one single action
potential provokes a twitch contraction during 25 to 75 ms, as shown in figure2.4.
When multiples stimulus are delivered to muscle fibres before their relaxation, the
evoked force can be greater than a single impulse due to a mechanical summation
(lead-ing to a sustained contraction also known as tetanus), mean(lead-ing that the response of
mus-cle fibre is independent of the stimulus amplitude but proportionally dependent on the
frequency of multiple stimulus, i.e., increasing frequency stimulus increases the muscle
force produced. TheCNScontrolling the number of recruited motor units or their firing
rate, between 8Hz to 35Hz, determines the force of muscle contraction [1].
2.1.4 Electromyography (EMG)
EMGis a technique that monitors electric activity of excitable cell membranes, based on
the linear propagation of action potentials along muscle fibres. Electromyogram signal is
the algebraic sum of all the detected signals within a certain area – representing voltage
as a function of time - and may be affected by muscular, physiological, anatomic
2. THEORETICAL BACKGROUND 2.1. Scientific support
Figure 2.4: Schematic representation of twitch contraction as a response to a single stimulus after a latent period.
EMGis an important method to analyse muscular functioning, expressing in real time,
muscular activation during movement, its activation intensity, duration and variability
[21]. EMG signals can be acquired by surface electrodes attached to the skin over the
target muscle – interferential process – or by needle electrodes inserted invasively into
the muscles tissues – intramuscular process. Surface EMG (sEMG) measures action
po-tentials along the entire recorded area underneath the electrodes, while needle electrodes
measure action potentials from a small number of fibres and may not be representative of
the entire muscle mass involved [1,22].sEMGappears to be more practical but it is easily
contaminated by volume conduction between muscles. Intramuscular needle recording
is more useful when using multi-motor units rather than single unit, since it provides
more specific information - better signal-to-noise-ratio.
In this work,sEMGis used in order to estimate the number of activated motor units
and their discharge rate on superficial muscles [22].sEMGis more frequently used since
it is a non-invasive procedure, painless and risk-free for the patient whose signal is being
required, does not require specialized medical doctors and is more directly correlated
with the mechanical outcome [22]. Two electrodes are placed on the skin over the
mus-cle region to be analysed and the difference of potential between them is acquired and
amplified [1].
2. THEORETICAL BACKGROUND 2.1. Scientific support
quality is higher when the ratio is greater and also from a common mode rejection
ra-tio, that eliminates through differentiation common interferences (from electric networks,
distance from muscles or heart beating) that are considered as noise duringEMG
record-ings.
2.1.5 Patterns in EMG analysis
Voluntary movement is associated with the presence of rhythmic activity in motor
cor-tex. Beta-band, comprising a range of frequencies from 15 to 30 Hz, appears to vary its
magnitude prior and during voluntary movements and is associated with the attempt to
perform certain tasks [23]. In this same frequency band, cortical activity and motor unit
firing are correlated during sustained voluntary contractions. Intermuscular correlation
(EMG - EMG) between different muscle groups appears to detect characteristics of the
same rhythmic processes suggesting a common drive from corticospinal pathways. The
precise function and genesis of these same cortical oscillations still remains elusive [24].
Firing rates of motor units are modulated by an 8 -12 Hz rhythm. Motor units from
muscle pairs can be modulated by a descending 15 -30 Hz drive, demonstrating that this
drive is mediated via corticospinal pathways (corticospinal cell activity encodes motor
cortical oscillations), that oscillations within this band occur in the sensorimotor cortex
which are coherent with contralateral muscles [24, 25]. These oscillations may arise in
motor systems in order to promote synchronous neuronal firing between neurons
popu-lations that are spatially distributed but functionally related, providing means of linking
different neuronal populations [24]. Coherent activity may represent a common element
in coding activity in simultaneous active motor centres.
Cortical areas involved in the same motor task may be coherent with each other.
Ac-tive muscles show coherence around beta-band, reflecting the activity of neuronal
struc-tures involved in driving the spinal motoneurons [25]. Coherence has demonstrated that
some of these oscillations are probably transmitted via the pyramidal tract to activate
2. THEORETICAL BACKGROUND 2.2. Technical base
2.2
Technical base
2.2.1 Signal Acquisition
The signal acquisition process initiates with the placement of pairs of electrodes at
vary-ing distances along the muscles to compute coherence andPLF analysis between pairs
of muscles, while subjects perform a specific task [16]. For the same performed task,
data is collected by ipsilateral (electrodes situated on the same side of the body) and
con-tralateral (electrodes situated on opposite sides of the body) acquisitions. In ipsilateral
acquisitions, data is collected from the first dorsal interosseus and extensor digitorum
communis muscles. In contralateral acquisitions data is collected from first dorsal
in-terosseus muscles from each side of the body.
2.2.2 Recording device
EMG signal is recorded using bioPLUXresearch unit, shown in figure 2.5. This device
collects real time biosignals and transmits them via bluetooth to a computer or
smart-phone, where they can be saved and visualized. BioPLUXresearch has eight analog
sam-ple channels with 12-bit of resolution, a sampling frequency of 5 KHZ andEMGsensors
with second order band pass filter with cutoff frequencies of 25 and 450 Hz. The unit has
also an external channel to be used as reference ground electrode for electrophysiology
measures and a digital port for applications that require external synchronism.
2.2.3 Sampling frequency
Sampling frequency is of utmost importance to correctly acquireEMGdigital signal and
therefore, according to Nyqüist Theorem, at least the double of the highest frequency in
EMGsignal should be used as the sampling frequency. sEMGmay have frequencies of
up to 500 Hz – these values are affected by motor unit and contraction, electrodes sizes
and distance between them – and the minimum sampling rate value should be 1 KHz
2. THEORETICAL BACKGROUND 2.2. Technical base
Figure 2.5: BioPLUXresearch system.
2.2.4 Electrodes
Electrodes are sensors of input and output of electric current that must be placed, in
sEMG, near the muscle associated with a conducting gel that promotes a stable
transmis-sion as a function of time with low noise, in an electrode-tissue interface named
superfi-cial detection, so as to capture its ionic current that behaves as a low-pass filter [26,21].
EMG signals are recorded with a bipolar configuration that consists of a combination
of signals derived from two electrodes. The main advantage of such a configuration is
that benefits from a high rate of common rejection and being the detection differential,
potentially masked with high noise from power lines and the resulting signal, can be
subtracted from both signals recorded in two different sites that is subsequently
ampli-fied – which means that any noise or artefact common to both signals is eliminated and
the uncommon parts become amplified [21]. The placement of electrodes is crucial since
muscles are composed by different types of muscle fibres – slow and fast twitching fibres
– and therefore the amplitude ofEMGand power spectral density are greatly variable. It
is advised to place the electrodes in the proper location onto the muscle to avoid
contami-nation by a neighbouring muscle’s electrical activity, a phenomenon known as cross-talk
2. THEORETICAL BACKGROUND 2.2. Technical base
placed too close to each other, no difference of potential is detected, but greater distance
causes more filtering [1].
2.2.5 Low-level processing
TheEMGsignal acquired is an analogue signal – continuous in time – that must be
con-verted into a digital signal – discrete, defined by established intervals – so that can be
digitalized to the computer [21]. Some parameters have to be analysed in frequency and
time domains (as shown in subsections2.2.5.1 and2.2.5.2), that may be useful to better
understand signal content for the aim of this project.
2.2.5.1 Time domain
Such analysis is based on the information of the amplitude of anEMGsignal as a function
of time, where amplitude represents the magnitude of muscular activity determined by
motor units activity and their firing rates [21].
• Rectification
Rectification consists on the transformation ofEMGsignals into their absolute
val-ues and it can remove its negative phases (full wave) or remove its negative valval-ues
from theEMGraw signal. Rectification is applied in all signals prior to coherence
analysis, since it exposes the contribution of low frequencies produced by action
potentials.
• Filters
Filters are used to attenuate a specific range of frequencies that are undesired and
allow the passage of unaltered frequencies. Filters can be classified according to
the specific range of frequencies that are attenuated and to choose the appropriate,
one must priorly know which frequencies wants to work with. On this present
work, for all signals are applied a band pass filter defined by cutoff frequencies Fc1
and Fc2, where all frequencies above Fc1 and bellow Fc2 are attenuated to zero. To
describe filters behaviour, transition band is characterized by its order.
2.2.5.2 Frequency domain
Frequency is analysed since it is variable and dependent on firing rates from motor units,
2. THEORETICAL BACKGROUND 2.2. Technical base
latter having the greatest impact [21]. All real continuous signals can be represented by
a combination of multiple sinus and cosinus, making use of fast Fourier transform (FFT)
and construct a Power spectral density (PSD) which represents the signal strength as a
function of frequency.
• Frequency Spectra
Frequencies spectra allow to, through FFT analysis, observe frequency intensity.
The spectrum of a signal is a positive real function of a frequency variable
asso-ciated with a stationary stochastic process, with dimensions of power or energy
per hertz (Hz). The spectrum decomposes the content of a stochastic process into
different frequencies present in that signal, and helps identifying periodicities.
2.2.6 High-level processing
In adults, analysis ofEMGrectified signals and motor unit firing between different
co-contracting muscles show coherence at frequencies in a range of 1 - 45 Hz, with a higher
frequency range in 16 – 32 Hz and a maximum in a lower frequency range in 1 -12 Hz
[9]. Since it is known that cortical signal recorded in primary motor cortex interacts
with muscle signal in specific frequencies,EMG-EMGcoherence analysis detects
oscil-latory drive from corticospinal pathways andEMGis coherent with sensorimotor cortex
Electroencephalography (EEG) andMEG, it is of interest to detect differences in EMG
coherence in patients presentingALS[9].
This evaluation is based on changes in occurrence and strength ofEMG-EMG
pair-ing as function of frequency and time – coherence andPLFestimates.PLFand coherence
analysis of motor unit firing behaviour can provide information about the organization
of networks responsible for driving spinal motoneurons during task performance and
assess common presynaptic inputs that synchronize motor units populations [16]. In the
human body, different activities may be characterized by functional activities in distinct
circuits, due to muscles discharges at a certain frequency byCNS. Some of these
oscil-lating frequencies led to spinal motoneurones and its results and origins can be found in
2. THEORETICAL BACKGROUND 2.2. Technical base
2.2.6.1 Coherence
Rectification ofsEMGis known to maximize the information regarding timing motor unit
potentials. Rectifiedy andx are assumed to be realizations of stationary mean time
se-ries. Using discrete Fourier transforms, in frequency domain auto spectrafx,x(λ),fy,y(λ)
and cross spectrumfx,y(λ)are calculated to assess measures of correlation [9,28]. As a
function of frequency, coherence|Rx,y(λ)|2 is assessed by the squared magnitude of the
normalized cross spectrum, divided by the product of the two auto spectra as show in
equation2.1.
|Rx,y(λ)|2 =
|fx,y(λ)|2
fx,x(λ)fy,y(λ)
(2.1)
Coherence function provides an output assuming values from 0 to 1, assuming value
0 if they are not linearly dependent on each other at any frequency and 1 when signals
present a perfect linear relation between them. Thus, coherence provides a measurable
quantity of the fraction of the activity in one sEMG signal that can be foreseen by the
activity of the other sEMGsignal [28,9]. Hence, coherence quantifies the intensity and
range of frequencies where rhythmic synaptic inputs are common across the
motoneu-ron pool [16]. It should be pointed out that coherence does not provide the direction of
interaction between both signals, only direct coherence, which won’t be calculated since
it has no relevance in this work.
2.2.6.2 PLF - Phase Locking Factor
During oscillatory activity, neurons fire synchronously. Therefore, common target cells
will receive neural activity synchronously and so, oscillations play an important role for
the timing of neural activity [12]. Synchrony plays an important role when performing a
motor task, involving oscillating processes. On the assumption that coherence exists for
the beta-band between two signals, for these frequencies both signals must be
synchro-nized within each other. Many methods allow the observation of synchrony behaviour
butPLFis the one used on this work. To obtain meaningful phase values, it is necessary
the presence of oscillations in time series signals. Therefore, a transformation is needed
to project the time series onto a circumference and extract the angle of rotation over time.
Presence of oscillatory activity may be observed prior to phase analysis by performing
2. THEORETICAL BACKGROUND 2.2. Technical base
they are isolated by applying to the signal a band-pass filter at a narrow band centred at
each frequency of interest. From the obtained oscillatory signal, the angle of rotation, or
phase, can be defined in the complex unit circle for each data point. The method used
is based on the Hilbert transforms of the data. The only essential requirement for this
method is that the signals contain a clear oscillatory component. An essential parameter
in this analysis is the number of oscillation cycles considered. Longer observation times
return more reliable estimates and too short observation periods may conceal important
interactions, when they are weak or hidden by noise [29]. For signalsjandk,φj(t)and
φk(t) represent signals phase dependency on time, respectively, for t = 1, ..., T. PLF
between both signals is defined by [30]:
ρjk ≡ |
1 T
T
X
t=1
ei[φj(t)−φk(t)]|=|hei[φj(t)−φk(t)]i| (2.2)
PLF assumes values from 0 to 1. 0 stands for signals entirely asynchronous, with
phases randomly distributed, forT sufficiently long; 1 stands for signals perfectly
chronized and their phase lag constant. Values between 0 and 1 represent partial
syn-chrony. PLFon this work is only calculated between two signals, specifically for all
in-stants of steady contraction, where oscillations are expected. As assumed in literature,
[29], lost of timing information caused by filtering is acceptable. Cutoff frequencies for
the band-pass filter are chosen under the assumption that a particular frequency band
shows the relevant information. Since beta-band is being analysed and comprehends
a sufficient large interval, for each contractionPLF is performed as many times as the
number of frequency values from the band.
To compare results between different subjects, estimates of pooled coherence andPLF
are calculated to provide a single measure that summarizes all data across several
sub-jects. Pooled estimates have the same type of outputs than coherence andPLFbut refer
to an entire population. This analysis of coherence andPLFprovides mean values for a
given muscle pair in single subjects, allowing the estimation of the probability
3
Acquisition
In this chapter, different sections explain all collected data from the groups of subjects,
recording system, experimental setup and the acquisition protocol.
3.1
Subjects
Focussing on previously published results, ipsilateral measurements were performed on
1 member from the group of patients and 1 member from the group of control.
Contralat-eral measurements required the existence of two different groups of subjects: group of
6 patients presentingALS and a control group of 6 subjects. All participants from the
control group do not present any known neuronal or muscular disease, whereas patients
withALShave been diagnosed within less than 1 year. Acquisitions were performed in
more patients but were not taken into account since these patients withALS were in a
more advanced stage of the disease, presenting motor difficulties that limited there own
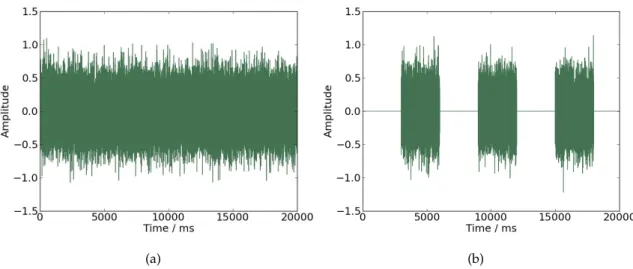
movement control, making impossible to collect an analysableEMGsignal. In figure3.1
is represented the ability (3.1(b)) and inability (3.1(a)) of self controlled movements in
3. ACQUISITION 3.2. Acquisition Protocol
(a)
(b)
Figure 3.1: (a) EMG signal from a patient with incapacity to control his own movements. (b) EMG signal from a patient with capacity to control his own movements.
3.2
Acquisition Protocol
The performed task was the same used for ipsi and contralateral acquisitions. Subjects
were asked to seat and place both hands on a desk, 10 cm away from each other in a
parallel position and with hand palms facing each other, in 90 degrees of flexion with the
elbow. Subjects had to elevate both index fingers vertically with a maximum articular
amplitude in a direction opposite to the other fingers position, hold that position for 3
seconds while maintaining a certain force/pressure and then return to the initial position,
where it remains for 3 seconds while relaxing as much as possible. This movement was
repeated for 5 minutes or less according to maximum time tolerated by the patients. The
coordinated movement was guided by a programmed sound and both fingers had to be
3. ACQUISITION 3.3. Recording
3.3
Recording
For each ipsilateral acquisition, 4 signals were simultaneously acquired from each subject
usingEMGsensors attached to a bioPlux device. As observed in figure3.2, besides the
contralateral acquisition (as shown in figure3.3), ipsilateral was simultaneously acquired.
For both right and left hand, signals were collected using two sensors attached to first
dorsal interosseus muscle; for both right and left forearm, signals were collected using
two sensors attached to extensor digitorum communis muscle. Ground was placed in
ulna bone inferior extremity, where no muscle activity is present.
(a)
(b)
Figure 3.2: Ipsilateral acquisitions experimental setup: Bioplux research device, placement of two EMG sensors and ground. (a) Instant of relaxation. (b) Instant of
contraction.
For each contralateral measurement, two signals were simultaneously acquired from
3. ACQUISITION 3.3. Recording
for each hand) has two connected electrodes placed in first dorsal interosseus muscle.
Ground was placed as in ipsilateral recordings. Surface electrodes placements are shown
in figure3.3. The device used and its specifications are explained in chapter2.2.2.
Figure 3.3: Contralateral acquisitions experimental setup: Bioplux research device, placement of two EMG sensors and ground. (a) Instant of relaxation. (b) Instant of
4
Signals Processing
This chapter discusses the algorithm and processing applied to all of the acquired data.
Low level processing gathers instants of contraction so that high level processing
calcu-lates coherence andPLFmean values averaged for all subjects. This procedure allows to
study ipsi and contralateral coherence andPLFfor the beta-band frequency.
4.1
Low-level Processing
Both acquired signals were processed using Python language. Signals amplitude was
changed from ‘bins’ into ‘mV’. Signals were then filtered by a third order butter band
pass filter of 30 – 2000 Hz (filter is shown in figure 4.2(a)); from these filtered signals,
its envelope was calculated and its Direct current (DC) component removed. In order
to extract information about coherence, intervals of contraction common to both signals
had to be isolated from intervals of relaxation, since coherence is better estimated during
periods of steady contraction [6]. Signals presenting higher amount of noise will
con-ceal real information, inhibiting to distinguished contractions from relaxation intervals
so predictably. This and the differences among individuals signals, does not allow to
pre-define an onset value common to all signals. So, instead of using a method based on the
EMGsignal envelope, a method based on statistical model was used. To determine the
4. SIGNALSPROCESSING 4.1. Low-level Processing
that divides data in two different Gaussian distributions, one corresponding to the noise
component of the original signal and the other to signal’s relevant information. The
on-set value is defined by the covariance value derived from the noise Gaussian distribution,
and multiplying it by a constant - previously achieved by experimental verification and
dependent on each analysed data.
The signals acquired from patients and posteriorly ignored (referred in chapter3.1)
correspond to patients presenting difficulties in moving both fingers co-ordinately and
maintaining a certain force value during contraction. Therefore, for these patients
dis-tinction between moments of muscular activation and the rest of the signal was not
analysable.
For both signals, a vector was created with value 1 assigned to instants where the
onset was exceeded and value 0 for the reminder. Applying the first order difference,
the outcome 1 corresponded to instants of onset (increasing) values and -1 to instants of
offset (decreasing). Initially, more than one value was assigned to both on and offset for
each contraction becauseEMGsignals oscillate. To obtain the unique and correct on and
offset for each contraction, the algorithm had to remove all of the previously obtained by
ensuring two things:
1. contraction minimally long - if between one onset and the correspondent offset,
were present less than 1.6 seconds and the interval was to small to be considered a
contraction, therefore these thresholds are ignored. The posterior onset and
previ-ous offset are kept.
2. relaxation minimally long - if between one offset and the posterior onset, was present
less than 1 second, the interval of relaxation between these two assumed
contrac-tions was too short. Therefore, these are ignored and the contraction onset and the
posterior offset are kept.
This procedure is performed for each signal. The resulting on and offset for each
con-traction are different among the signal collected from the right and from the left hand.
To guarantee that these signals have commons intervals of contractions, it is chosen, for
each contraction, the highest value from both onsets and the lowest from both offsets.
4. SIGNALSPROCESSING 4.2. Hight-level Processing
Figure 4.1: EMG signal with estimated common intervals of contraction. Black vertical lines represent on and offsets instants.
4.2
Hight-level Processing
4.2.1 Coherence Processing
As already mentioned in chapter1.3, coherence between theseEMGsignals is better
per-formed in periods of steady contraction. So, after low-level processing, using two long
common sections of data from an interval of one contraction, coherence is calculated
using equation 2.1. PSD for each section and Cross power spectral density (CSD)
be-tween both signals sections are estimated using Welch’s average periodogram method
from matplotlib.pyplot library. AllEMGsignals, with the purpose of coherence calculus,
were full-wave rectified before anyFFT was calculated. Sampling frequency is placed
as 5 KHz, the Nonequispaced fast Fourier transform (NFFT) 1024, 2048 or 4096, and the
value that dictates the dependency between FFTwindows is half of NFFTvalue. The
higher theNFFTchosen, the more precise will be the frequency resolution; makingNFFT
as 1024 yields a resolution of 4.88 Hz, as 2048 a resolution of 2.44 Hz and 4096 a
resolu-tion of 1.22 Hz. Preciser frequency resoluresolu-tion is preferable but having a lower precision
allows to observe general trends.
Coherence is reported in two different ways. First, to provide a visual schematic
4. SIGNALSPROCESSING 4.2. Hight-level Processing
of contraction for a given muscle pair was performed across all patients within a group
of subjects; this allows to precise coherence for each patient acquisition based on
averag-ing multiple independent instants of data. Second, to provide an estimation of coherence
dependency on frequency across the population of each group, mean coherence was
cal-culated for the same values of frequency for a given muscle pair among all subjects within
the same group. Alternatively, coherence was also calculated between both entire data
in order to compare the influence of relaxation intervals. To assure that the wanted band
of frequency was present in both signals of each patient, frequency spectra were
com-puted, in two different ways. First, using numpy.fft library, discrete Fourier Transform
was computed by Cooley-Tukey algorithm, to the entire collected data for each signal.
Second, using matplotlib.pyplot library, PSD was computed with the same parameters
used to perform coherence. Frequency spectra were calculated for all instants of
contrac-tion and then averaged to present an individual spectra for each patient. To refer that,
even if the beta-band frequency is present does not mean that data is coherent within that
same band, it means only that those frequencies exist in each signal.
4.2.2 PLF Processing
Since the beta-band frequencies are been studied,PLFwas calculated for specific values
of frequency f within this same band[15,30]Hz with a resolution of 1 Hz. An example
of filter used in this analysis is shown in figure 4.2(b). This procedure was performed
among both control and patients group. Each signal was band pass filtered[f−2, f+ 2],
f being the analysed frequency, to eliminate from the signal all of the other undesirable
frequencies. Instants of contraction where again isolated and for each, PLF calculated
between each pair of ipsi and contralateral measurements.
Since is among instants of steady contraction that coherence is better estimated,PLF
analysis was also performed for these same instants. Phase information is extracted from
theEMGsignals through the concept of analytical signals, which is performed by
apply-ing the Hilbert transform to the signal, for each pair of contractions. Hilbert transform
was applied with resourcing to Fourier analysis using scipy.signal tools. Since the result
of this transform is to convert each sample of acquisition into its corresponding
imagi-nary numbers, phase between two contralateral signals can be calculated by finding each
4. SIGNALSPROCESSING 4.2. Hight-level Processing
(a) (b)
Figure 4.2: (a) Band pass filter[15,2000]Hz applied to all studied signals before processing. (b) Example of a band pass filter[f−2, f+ 2]withf as 20 Hz, applied on a
set of signals to calculate PLF for the given frequency of 20 Hz; delimited by the grey box, are represented the frequencies corresponding to beta-band.
difference of phase lag between them for each sample within all instant length.
There-fore the portion[φj(t)−φk(t)]from equation2.2is calculated and to present aρjk value
for each contraction, Euler formula is applied to each phase difference and averaged for
all instants within the same contraction. This implies that, for each window of the pair
signals, there is onePLFvalue. To present a final value for each member of each group,
PLFwas averaged between all contractions within the same acquisition. This procedure,
as referred above, is performed as many times as the number of frequencies that are to be
studied. PLFwas averaged among all members within the same group to present aPLF
5
Results and Discussion
In this chapter are represented some validation tests using coherence analysis on basic
signals and syntheticEMGsignals. Coherence andPLFmean values results are presented
for the algorithm used on acquired data from control and patients groups, for both ipsi
and contralateral acquisitions. The aim is to verify whether significant changes occur
between both groups of subjects.
5.1
Synthetic EMG Signals
For validation of the algorithms, syntheticEMGsignals were used to compute coherence.
To prove that coherence exists between two signals linearly dependent on each other for
particular values of frequency, two different sets of signals were constructed and defined
by equations5.1and5.2:
signal= (sin(t×2πf) +k)×n(t) (5.1)
signal= (sin(t×2πf) +k)×n(t)×mod(t) (5.2)
where,tis a sequence of integer numbers, incremented by one unit, with a desirable
5. RESULTS ANDDISCUSSION 5.1. Synthetic EMG Signals
account the sampling frequency;n(t)is a Gaussian noise (µ= 0andσ= 1),kthe signal’s
envelope, f the signal’s frequency and the portionmod(t)present only in equation 5.2
(that determines the difference between both equations) represents the rest of the division
oftby 6 bigger then 3 - guaranteeing instants of contraction and relaxation of 3000 ms.
An example witht = 20sandk = 3 is shown in figure5.1. In5.1(a)is shown the
signal created by equation5.1and in5.1(b)is shown the signal created by equation5.2.
(a) (b)
Figure 5.1: Schematic representation of the signal defined by equation5.1in (a), and the signal defined by equation5.2in (b).
Multiples signals were created, choosing t: 8, 80 or 391s andf : 10, 20 or 40 Hz.
Number of samples were chosen to provide signals with 1, 13 and 65 contractions to
de-cide the time sampling for acquisitions; frequency values were chosen taken into account
that beta-band is being studied. For all signals created, coherence was calculated between
two of the same type signals (simulating both right and left hands). Using signals defined
by equation5.2, coherence is performed for instants of contraction and then averaged for
the entire measurement, unlike signals defined by equation5.1, where coherence is
calcu-lated for the entire acquisition. The choice ofNFFTwon’t be studied in this section since
it only varies frequency resolution and on this particular signals its difference is not
sig-nificant. Coherence results do not present any dependency on the choice offvalue, since
it assumes 1 for that frequency and near to 0 for the remaining. The results of frequency
5. RESULTS ANDDISCUSSION 5.1. Synthetic EMG Signals
(a) (b)
Figure 5.2: (a) Coherence values for signals defined by equation5.2withf as 20Hz. (b) Coherence values for signals defined by equation5.2withf as 40Hz.
(a)
(b)
Figure 5.3: Signals defined by equation5.2withf placed as 40 Hz. (a) Signal with391s. (b) Signal with8s.
On the contrary, coherence results seem to depend on the choice of signals length.
5. RESULTS ANDDISCUSSION 5.1. Synthetic EMG Signals
common value of 40 Hz forf but with different value oft. Figure5.3(a)corresponds to a
signal with 65 instants of contraction, while figure5.3(b)represents a signal with 1 instant
of contraction. For each type of signal referred in figure5.3, two signals, with different
portions ofn(t), were created to test coherence between them.
Results of mean coherence for these pair of signals can be observed in figure5.4and it
is possible to affirm that the higher the signals length, the more accurate are the coherence
results. It is possible to observe that in figure 5.4(b) coherence is different than 0; but
the same phenomenon does not happen in figure 5.4(a). So, averaging coherence for
greater amount of instants of contraction appears to reduce the coherence derived from
the presence of noise (figure5.4(b)), that only tends to disappear when not found among
other contractions.
(a) (b)
Figure 5.4: (a) Coherence values between two signals like those represented in figure
5.4(a). (b) Coherence values between two signals like those represented in figure5.4(b).
These analyses were repeated for signals defined by equation5.1. Varying frequency
does not influences coherence general trends and results are similar with those presented
in figure5.2. But, as seen in5.3, varying length alters coherence general trends.
For signals defined by equation 5.1, performed coherence for the entire signal is
5. RESULTS ANDDISCUSSION 5.2. Coherence Tests
(a) (b)
Figure 5.5: Coherence values between two signals defined by equation5.1withf placed as 40 Hz. (a) Coherence for signals with391s. (b) Coherence for signals with8s.
Again, coherence comes more precise and accurate for signals with higher length.
Dif-ferences between a signal defined by equation5.2- consistent of instants of contraction
and relaxation - and a signal defined by equation5.1 consistent of only a contraction
-arise for varying signals length, as shown in figures5.4(a)and5.5(a), respectively.
Differ-ences in coherence results between signals defined by equation5.2and5.1arise specially
for long lengths, where coherence results are more accurate when averaged. It is possible
to conclude, that is preferable to acquire data from higher sampling times and among
reasonable number of contraction instants.
5.2
Coherence Tests
Some basic tests were performed to analyse the implemented code. Two random signals
were used to test coherence between them and observe if resulted near 0 for all
frequen-cies, once random signals do not present frequency synchronism between each other.
Coherence was also tested between one signal and itself to observe if resulted exactly 1.
These results are represented in figure5.6. The choice ofNFFTand the use of entire
sig-nalvs. instants of contractions, was not relevant because quantifying coherence was not
![Figure 2.3: Schematic representation of a motor unit, composed by a motoneuron from the spinal cord, innervating muscle fibres through neuromuscular junction [1].](https://thumb-eu.123doks.com/thumbv2/123dok_br/16538003.736611/31.892.296.626.128.454/figure-schematic-representation-composed-motoneuron-innervating-neuromuscular-junction.webp)
![Figure 4.2: (a) Band pass filter [15, 2000] Hz applied to all studied signals before processing](https://thumb-eu.123doks.com/thumbv2/123dok_br/16538003.736611/49.892.158.785.141.401/figure-band-pass-filter-applied-studied-signals-processing.webp)