CPD
8, 695–713, 2012Changes in the strength and width of the Hadley circulation
since 1871
J. Liu et al.
Title Page
Abstract Introduction
Conclusions References
Tables Figures
◭ ◮
◭ ◮
Back Close
Full Screen / Esc
Printer-friendly Version
Interactive Discussion
Discussion
P
a
per
|
Dis
cussion
P
a
per
|
Discussion
P
a
per
|
Discussio
n
P
a
per
Clim. Past Discuss., 8, 695–713, 2012 www.clim-past-discuss.net/8/695/2012/ doi:10.5194/cpd-8-695-2012
© Author(s) 2012. CC Attribution 3.0 License.
Climate of the Past Discussions
This discussion paper is/has been under review for the journal Climate of the Past (CP). Please refer to the corresponding final paper in CP if available.
Changes in the strength and width of the
Hadley circulation since 1871
J. Liu1, M. Song1, Y. Hu2, and X. Ren3
1
State Key Laboratory of Numerical Modeling for Atmospheric Sciences and Geophysical Fluid Dynamics, Institute of Atmospheric Physics, Chinese Academy of Sciences, Beijing, China
2
Department of Atmospheric and Oceanic Sciences, School of Physics, Peking University, Beijing, China
3
Institute of Atmospheric Physics, Chinese Academy of Sciences, Beijing, China Received: 29 December 2011 – Accepted: 1 March 2012 – Published: 9 March 2012 Correspondence to: J. Liu ([email protected])
CPD
8, 695–713, 2012Changes in the strength and width of the Hadley circulation
since 1871
J. Liu et al.
Title Page
Abstract Introduction
Conclusions References
Tables Figures
◭ ◮
◭ ◮
Back Close
Full Screen / Esc
Printer-friendly Version
Interactive Discussion
Discussion
P
a
per
|
Dis
cussion
P
a
per
|
Discussion
P
a
per
|
Discussio
n
P
a
per
|
Abstract
Recent studies demonstrate that the Hadley Circulation has intensified and expanded for the past three decades, which has important implications for subtropical societies and may lead to profound changes in global climate. However, the robustness of this intensification and expansion that should be considered when interpreting long-term
5
changes of the Hadley Circulation is still matters of debate. It also remains largely un-known how the Hadley Circulation has evolved over longer periods. Here we present long-term variability of the Hadley Circulation using the 20th Century Reanalysis. It shows a slight strengthening and widening of the Hadley Circulation since the late 1970s, which is not inconsistent with recent assessments. However, over centennial
10
timescales (1871–2008), the Hadley Circulation shows a tendency towards more in-tense and narrower state. More importantly, the width of the Hadley Circulation has not yet completed a life-cycle since 1871. The strength and width of the Hadley Circulation during the late 19th and early 20th century show strong natural variability, exceeding variability that coincides with global warming in recent decades. These findings raise
15
the question that the recent change of the Hadley Circulation is primarily attributed to greenhouse warming or a long-period oscillation of the Hadley Circulation substantially longer than that observed in previous studies.
1 Introduction
The Hadley Circulation (ascent near the equator and subsidence in the subtropics) is a
20
fundamental regulator of the Earth’s energy budget, e.g. redistribution of energy from tropics to higher latitudes. The Hadley Circulation determines the precipitation pattern in the tropics and subtropics, e.g. the prevalence of rain in the moist inner tropical regions and the dry conditions in the subtropical regions (e.g. Diaz and Bradley, 2004). In recent years, there has been a substantial interest in the decadal change of
25
CPD
8, 695–713, 2012Changes in the strength and width of the Hadley circulation
since 1871
J. Liu et al.
Title Page
Abstract Introduction
Conclusions References
Tables Figures
◭ ◮
◭ ◮
Back Close
Full Screen / Esc
Printer-friendly Version
Interactive Discussion
Discussion
P
a
per
|
Dis
cussion
P
a
per
|
Discussion
P
a
per
|
Discussio
n
P
a
per
observations provided evidence of an increase of thermal radiation emitted by Earth and a decrease of reflected solar radiation in the tropics from the mid-1980s to the 1990s (Chen et al., 2002; Wielicki et al., 2002). Further analysis suggested such change might be attributed to a decadal strengthening of the Hadley Circulation (Chen et al., 2002). Various widely used reanalyses showed that the winter northern Hadley
5
Circulation has strengthened for the past few decades (Diaz and Bradley, 2004; Mitas and Clement, 2005; Song and Zhang, 2007), although no discernible trend is found in the global radiosonde observations for 1959–1989 (Mitas and Clement, 2004). By contrast, the majority of coupled and atmospheric-only model simulations showed a decrease or no increase of the winter Hadley Circulation during the late 20th century
10
(Mitas and Clement, 2006). The ensemble mean of the IPCC AR4 climate model sim-ulations (SRES A1B emission scenario) further suggested that the Hadley Circulation would weaken by 9 % by the late 21st century (Tanaka et al., 2005). Because the signal is not consistent across the reanalyses, radiosonde observations, and model simulations, there are still questions about the robustness of the strengthening in
re-15
cent decades that should be considered when interpreting long-term changes in the strength of the Hadley Circulation.
Satellite-borne Microwave Sounding Unit data showed an enhanced mid-latitude tro-pospheric warming for 1979–2005, which indicated a poleward shift of subtropical jet streams (Fu et al., 2006). Because the subtropical jet streams mark poleward
bound-20
ary of the Hadley Circulation, such change suggests a widening of the Hadley Cir-culation in recent decades. Various commonly used reanalyses and outgoing long-wave radiation (OLR) data showed a total Hadley Circulation widening of∼2–4.5◦ in
latitude since 1979 (Hu and Fu, 2007). The total column ozone measured by the To-tal Ozone Mapping Spectrometer revealed that the relative area of the tropical ozone
25
regime extended poleward in the Northern Hemisphere by∼2.7◦ in latitude for
CPD
8, 695–713, 2012Changes in the strength and width of the Hadley circulation
since 1871
J. Liu et al.
Title Page
Abstract Introduction
Conclusions References
Tables Figures
◭ ◮
◭ ◮
Back Close
Full Screen / Esc
Printer-friendly Version
Interactive Discussion
Discussion
P
a
per
|
Dis
cussion
P
a
per
|
Discussion
P
a
per
|
Discussio
n
P
a
per
|
Randel, 2007). The IPCC AR4 climate model simulations also showed Hadley Circu-lation widening in response to increased greenhouse gases (Lu et al., 2007; Johanson and Fu, 2009). However, the widening appears to be nearly an order of magnitude smaller in the IPCC AR4 simulations than those in the observations (Johanson and Fu, 2009). This suggests that further studies are necessary to confirm long-term changes
5
in the meridional extent of the Hadley Circulation.
To date, it is unclear what observational and model biases cause the above discrep-ancies of the strength and width of the Hadley circulation in response to climate change, e.g. reanalyses and models show fundamentally different thermodynamic structures in the tropical troposphere (Mitas and Clement, 2006), and radiosonde observations and
10
its assimilation in reanalyses might be one of the problems (Santer et al., 2005; She-wood, 2007). The modern reanalyses now available extend from no earlier than 1948 to the present (e.g. the National Center for Environmental Prediction/National Center for Atmospheric Research reanalysis, NCEP/NCAR, starts from 1948; Kistler et al., 2001), leaving many important climate events uncovered. It remains largely unknown
15
how the strength and width of the Hadley Circulation have evolved over longer periods, and how future climate change may affect the Hadley Circulation. Here we analyze long-term variation of the Hadley Circulation using the Twentieth Century Reanalysis version 2 (20CR2), which provides the first estimates of global tropospheric variabil-ity from 1871 to 2008 (Compo et al., 2011). Preliminary validations suggest that the
20
20CR2 depicts more realistic vertical structures of temperature trends in the tropics and subtropics, and probably suffers less from spurious trends than any previous re-analyses (see more detailed discussion of the key differences between the 20CR2 and previous reanalyses, and the evaluations of the 20CR2 in Sect. 2).
2 Data and method 25
CPD
8, 695–713, 2012Changes in the strength and width of the Hadley circulation
since 1871
J. Liu et al.
Title Page
Abstract Introduction
Conclusions References
Tables Figures
◭ ◮
◭ ◮
Back Close
Full Screen / Esc
Printer-friendly Version
Interactive Discussion
Discussion
P
a
per
|
Dis
cussion
P
a
per
|
Discussion
P
a
per
|
Discussio
n
P
a
per
data assimilation technique with the same weight to the first guess throughout the re-analysis period. However, significant variations of data density (and accuracy) for the past half century have resulted in significant inhomogeneities from the suboptimal as-similation of observations from very different observational networks, causing problems including incorrect tropical variability, understated storm track variability, and spurious
5
long-term trends. Sparse observations during the early 20th century, and especially the 19th century further compromise the ability of 3D-Var systems to produce reliable reanalysis for these earlier periods (Bengtsson et al., 2004; Whitaker et al., 2004). Recent studies have demonstrated the feasibility of generating reliable reanalysis for these earlier periods using only surface observations (e.g. surface pressure has been
10
made consistently since the late 1800s, and standard corrections are known for earlier observations. Surface pressure, through geostrophy, provides a reasonable approxi-mation to the barotropic part of the flow, which accounts for a substantial part of the total flow. The surface pressure tendency, which is related to the vertically integrated mass flux divergence, provides further information about the tropospheric circulation
15
that can be captured by a data assimilation system.), and more advanced data as-similation methods (e.g. the Ensemble Kalman Filter or 4D-Var). Motivated by these considerations, the 20CR2 utilizes an Ensemble Filter data assimilation system, a new version of the NCEP atmospheric-land model, newly compiled surface pressure obser-vations, and radiative effects of historical time-varying CO2 concentrations, volcanic
20
aerosol and solar variations to generate a reanalysis spanning 1871 to 2008 (Compo et al., 2011).
The 20CR2 only became available to the scientific community in 2010. Conse-quently, the evaluation of the 20CR2 is in its early stages, which imposes some uncertainty in our results. However, some evaluations have demonstrated that the
25
CPD
8, 695–713, 2012Changes in the strength and width of the Hadley circulation
since 1871
J. Liu et al.
Title Page
Abstract Introduction
Conclusions References
Tables Figures
◭ ◮
◭ ◮
Back Close
Full Screen / Esc
Printer-friendly Version
Interactive Discussion
Discussion
P
a
per
|
Dis
cussion
P
a
per
|
Discussion
P
a
per
|
Discussio
n
P
a
per
|
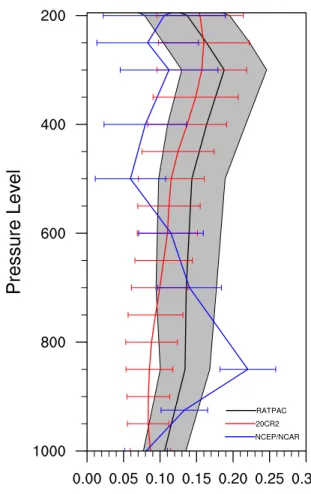
the tropics and subtropics, and to reduce the uncertainties in our conclusions, we have compared the 20CR2 and NCEP/NCAR with observations for 1958–2010. We have used the annual-mean temperature anomalies in the tropics and subtropics (30◦S–
30◦N) from the radiosonde atmospheric temperature products for assessing climate
(RATPAC, Free et al., 2005), which is less influenced by the temporal inhomogeneities
5
due to historical changes in instruments and measurement practices. Linear trends and their uncertainties were calculated as a function of height. The same procedure is applied to the 20CR2 and NCEP/NCAR temperature anomaly fields. As shown in Fig. 1, the observations display a warming trend extending from surface to the up-per troposphere, and the upup-per troposphere is warming faster than the surface. At all
10
levels, temperature trends in the 20CR2 are considerably closer to the observations than that of the NCEP/NCAR. The improved accuracy in the 20CR2 compared to the NCEP/NCAR is most pronounced in the lower and upper troposphere. There are quan-titative differences between the trends in the 20CR2 and observations. However, the magnitudes of the trends in the 20CR2 and in the observations are not significantly
15
different when their uncertainties are taken into account as compared to those of the NCEP/NCAR.
A conventional way to depict the Hadley Circulation is to calculate the mass stream
function (MSF, Oort and Yienger, 1996), which is defined byΨ =2πacosg ϕ p
R
0
¯
vdp, where
Ψis MSF, ¯v is the zonally-averaged north/south (meridional) velocity, a is the earth’s
20
radius,gis gravity, ϕis latitude, andpis pressure level. The MSF at a given latitude and pressure level is equal to the rate at which mass is being transported meridionally between that pressure level and the top of the atmosphere. Note that the Hadley Circulation is a zonal-mean quantity, although there is considerable zonal asymmetry of the Hadley Circulation.
CPD
8, 695–713, 2012Changes in the strength and width of the Hadley circulation
since 1871
J. Liu et al.
Title Page
Abstract Introduction
Conclusions References
Tables Figures
◭ ◮
◭ ◮
Back Close
Full Screen / Esc
Printer-friendly Version
Interactive Discussion
Discussion
P
a
per
|
Dis
cussion
P
a
per
|
Discussion
P
a
per
|
Discussio
n
P
a
per
3 Results
To describe temporal variation of the strength of the northern (southern) Hadley Circu-lation, we use the maximum (minimum) value of the zonal-mean mass stream function (as described in the methods summary) occurring within the latitudinal zone of 0–30◦N
(0–30◦S). As shown in Fig. 2a, a substantial multi-decadal variability is evident in the 5
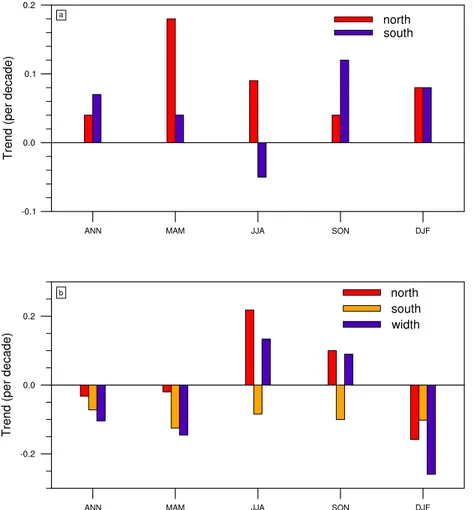
strength of the northern Hadley Circulation, e.g. a pronounced strengthening from the 1870s to the mid-1920s, followed by a weakening to the late 1960s, and then no dis-cernible trend (or a slight strengthening) to the present. Overlaid on such multi-decadal variability, there is an upward trend (0.61×10¹⁰kg s−1,>99 % significance), indicating
a strengthening of the northern Hadley Circulation since 1871. The strengthening of the
10
northern Hadley Circulation is persistent for all the seasons, with the most pronounced trend in spring (Fig. 3a). The strength of the southern Hadley Circulation also shows an increasing trend (0.91×10¹⁰kg s−1,>99 % significance) since 1871 (Fig. 2b), although
an anomalous decrease is found during the 1910s and 1920s. The strengthening of the southern Hadley Circulation occurs in all the seasons except summer (Fig. 3b).
15
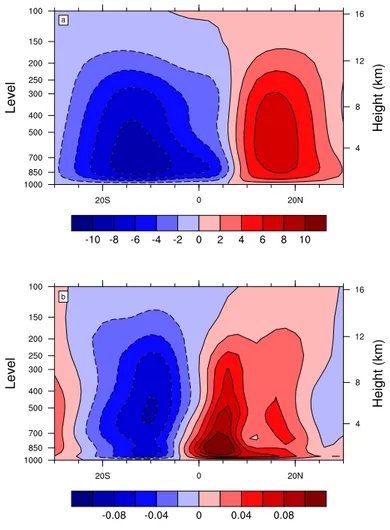
The vertical and latitudinal structure of the trend of the strength of the Hadley Cir-culation shows that the intensification of the northern and southern Hadley CirCir-culation extends from surface to the upper troposphere (Fig. 4b). The maximum intensification of the northern Hadley Circulation is more toward lower level (∼850-hPa) and equator
(∼4◦N) as compared to that of the southern counterpart (∼500-hPa and 10◦S). Com-20
pared with the climatological maximum values of the northern and southern Hadley Circulation (Fig. 4a), the strength of the northern and southern Hadley Circulation has increased by∼26.9 % and 12 %, respectively, since 1871.
As shown in Fig. 2c, the northern edge of the northern Hadley Circulation exhibits a remarkable equatorward shift from the 1870s to the early 1920s, followed by a gradually
25
poleward shift to the present. Overall, the northern edge of the northern Hadley Circu-lation shows a slightly equatorward-moving tendency since 1871 (0.44◦in latitude, not
CPD
8, 695–713, 2012Changes in the strength and width of the Hadley circulation
since 1871
J. Liu et al.
Title Page
Abstract Introduction
Conclusions References
Tables Figures
◭ ◮
◭ ◮
Back Close
Full Screen / Esc
Printer-friendly Version
Interactive Discussion
Discussion
P
a
per
|
Dis
cussion
P
a
per
|
Discussion
P
a
per
|
Discussio
n
P
a
per
|
winter and spring, and poleward in summer and autumn (Fig. 3b). The southern edge of the southern Hadley Circulation shows a significant equtorward-moving tendency since 1871 (1◦in latitude,>99 % significance), although a poleward shift is found
start-ing from the late 1970s (Fig. 2c). The equtorward shift of the southern edge of the southern Hadley Circulation occurs in all the seasons (Fig. 3b). We note that the
north-5
ern and southern edges of the Hadley Circulation tend to diverge starting from the late 1970s, which is consistent with the identified expansion of the Hadley Circulation in the aforementioned studies.
Figure 2d shows the width of the Hadley Circulation, which is defined as the distance between the northern and southern edges of the Hadley Circulation. It appears that the
10
width of the Hadley Circulation has not yet completed a cycle since 1871. Specifically, the Hadley Circulation shrunk by∼4–5◦in latitude from the 1870s to the mid-1920s,
fol-lowed by two major expansion periods (from the mid-1920s to the mid-1940s and from the late 1970s to the present), which are in accordance with two major warming periods (1925–1944 and 1978–present) found in the observations (Jones et al., 1999; Hansen
15
et al., 2010). Overall, the Hadley Circulation shows a tendency toward a narrower state during 1871–2008 (−1.44◦in latitude,>99 % significance).
Despite a large number of observational and modeling studies, it remains unclear how the strength and width of the Hadley Circulation are related (Schneider et al., 2010). As shown in Table 1, significant out-of-phase relationships are found between
20
the strength, and the width and northern edge of the Hadley Circulation, even with the trends removed. By contrast, no strength-width relationship exists for the south-ern counterpart, although significant correlation is found between the strength and the southern edge of the southern Hadley Circulation. This indicates that the northern Hadley Circulation might dominate the southern counterpart in modulating the
merid-25
ional extent of the Hadley Circulation.
CPD
8, 695–713, 2012Changes in the strength and width of the Hadley circulation
since 1871
J. Liu et al.
Title Page
Abstract Introduction
Conclusions References
Tables Figures
◭ ◮
◭ ◮
Back Close
Full Screen / Esc
Printer-friendly Version
Interactive Discussion
Discussion
P
a
per
|
Dis
cussion
P
a
per
|
Discussion
P
a
per
|
Discussio
n
P
a
per
ghcnm/ghcnm-v3.pdf) shows that the global-mean surface temperature has warmed by 0.06◦C for 1880–2008 (Fig. 2e). Compared to the observations, the global-mean
near surface air temperature of the 20CR2 shows comparable warming trend (0.06◦C
for 1880–2008), and coherent variation (the correlation between the 20CR2 and GHCN is 0.94,>99 % significance).
5
It has been suggested that the Hadley Circulation would weaken associated with global warming (Diaz and Bradley, 2004; Lu et al., 2007; Vecchi and Soden, 2007), which is based on the relationship between the meridional surface temperature gra-dient and the strength of the Hadley Circulation (Diaz and Bradley, 2004), and the IPCC AR4 model projected decrease of convective overturning in the tropics as
cli-10
mate warms (Vecchi and Soden, 2007), but some studies demonstrate that the Hadley Circulation has strengthened in recent decades, particularly in winter. Here our analy-sis shows the Hadley Circulation has strengthened in accordance with the increase of the global-mean surface temperature since 1871, but the northern Hadley Circulation shows substantial multi-decadal fluctuations.
15
It has also been suggested that the meridional extent of the Hadley Circulation would expand associated with greenhouse warming. This is based on the postulation that the extent of the Hadley Circulation is determined by the latitude of baroclinic instability. Under global warming conditions, the subtropical static stability increases due to an established consequence of moist thermodynamics, which pushes the baroclinic
insta-20
bility zone poleward, and consequently, the outer boundary of the Hadley Cell extends poleward (Lu et al., 2007). Here our analysis shows that the Hadley Circulation has shrunk by 1.44◦in latitude in accordance with surface warming during 1871–2008.
The sustained increase in the width of the Hadley Circulation for the past few decades that have occurred simultaneously with a significant positive trend in the
25
CPD
8, 695–713, 2012Changes in the strength and width of the Hadley circulation
since 1871
J. Liu et al.
Title Page
Abstract Introduction
Conclusions References
Tables Figures
◭ ◮
◭ ◮
Back Close
Full Screen / Esc
Printer-friendly Version
Interactive Discussion
Discussion
P
a
per
|
Dis
cussion
P
a
per
|
Discussion
P
a
per
|
Discussio
n
P
a
per
|
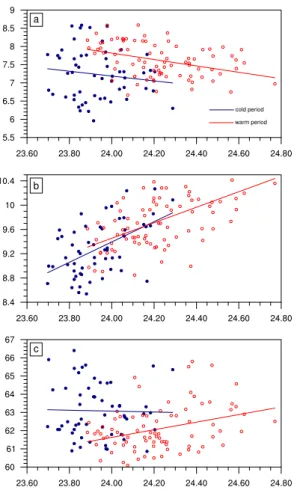
We further divide the entire period (1871–2008) into (1) cold period (1871–1925), which features a slight decrease or no increase in the global-mean surface air temperature, and (2) warm period (1926–2008), which is characterized by a quite persistent rise in the global-mean surface air temperature (Fig. 2e). As shown in Fig. 5, the strength of the northern Hadley Circulation decreases with the increasing surface air
tempera-5
ture, although such dependence during the cold period is not statistically significant (Table 1). The opposite is the case for the strength of the southern counterpart, which increases with the increasing surface air temperature. This suggests that the northern and southern components of the Hadley Circulation have opposite strength-temperature relationship. The width of the Hadley Circulation does show an expansion
10
with the increasing surface air temperature during the warm period, but no dependence on surface temperature is found during the cold period. The width of the Hadley Circula-tion changes non-monotonically with surface temperature, showing different sensitivity to cold and warm conditions.
4 Conclusions 15
We conclude that the 20CR2 does indicate a slight strengthening and widening of the Hadley Circulation for the past three decades, corroborated by the results of recent analyses. However, over longer periods (1871–2008), the Hadley Circulation has be-come stronger and narrower. Moreover, the width of the Hadley Circulation has not finished a full life-cycle since the 1870s, which indicates the observed expansion in
20
recent decades might be a reflection of a long-period oscillation. To further confirm the identified secular variability, we perform a spectral analysis on the time series of the width of the Hadley Circulation. The spectral analysis indicates that the width of the Hadley Circulation exhibits a clear secular peak indicative of centennial-scale vari-ability that is distinct from the null hypothesis of a red-noise stochastic process,
sta-25
CPD
8, 695–713, 2012Changes in the strength and width of the Hadley circulation
since 1871
J. Liu et al.
Title Page
Abstract Introduction
Conclusions References
Tables Figures
◭ ◮
◭ ◮
Back Close
Full Screen / Esc
Printer-friendly Version
Interactive Discussion
Discussion
P
a
per
|
Dis
cussion
P
a
per
|
Discussion
P
a
per
|
Discussio
n
P
a
per
Convergence Zone (ITCZ, a tracer of the horizontal scale of the Hadley cell, Hu et al., 2007) for the past several millennia, i.e. the planktic foraminifer Globigerinoides sac-culifer in Gulf of Mexico sediments shows distinct century-scale cyclicity of ITCZ (Poore et al., 2004). The strength and width of the Hadley Circulation during the late 19th and early 20th century experience substantial changes that exceed changes associated
5
with global warming in recent decades. A simple relationship between the strength and width of the Hadley Circulation, and surface temperature is not supported. These findings are intriguing and raise the question that the recent changes of the Hadley Circulation is primarily due to greenhouse warming or long-term change of the Hadley Circulation (e.g. variability of the Hadley Circulation at centennial timescales).
Attribu-10
tions of those changes require a deeper understanding of how the strength and width of the Hadley Circulation is controlled under various dynamical regimes, even in the present climate state.
Acknowledgements. This research is supported by 973 program (2011CB309704 and 2010CB428606) and NSFC (41176169 and 41025018).
15
References
Bengtsson, L., Hodges, K., and Hagemann, S.: Sensitivity of the ERA-40 reanalysis to the observing system: Determination of the global atmospheric circulation from reduced obser-vations, Tellus A, 56, 456–471, 2004.
Br ¨onnimann, S., Compo, G. P., Spadin, R., Allan, R., and Adam, W.: Early ship-based
upper-20
air data and comparison with the Twentieth Century Reanalysis, Clim. Past, 7, 265–276, doi:10.5194/cp-7-265-2011, 2011.
Chen, J., Carlson, B., and Del Genio, A.: Evidence for strengthening of the tropical general circulation in the 1990s, Science, 295, 838–841, 2002.
Compo, G., Whitaker, J., Sardeshmukh, P., Matsui, N., Allan, R., Yin, X., Gleason, B., Vose,
25
CPD
8, 695–713, 2012Changes in the strength and width of the Hadley circulation
since 1871
J. Liu et al.
Title Page
Abstract Introduction
Conclusions References
Tables Figures
◭ ◮
◭ ◮
Back Close
Full Screen / Esc
Printer-friendly Version
Interactive Discussion
Discussion
P
a
per
|
Dis
cussion
P
a
per
|
Discussion
P
a
per
|
Discussio
n
P
a
per
|
Ø., Ross, T., Trigo, R., Wang, X., Woodruff, S., and Worley, S.: The Twentieth Century Reanalysis Project, Q. J. Roy. Meteorol. Soc., 137, 1–28, 2011.
Diaz, H. and Bradley, R.: The Hadley Circulation, Present, Past and Future, Kluwer Academic, Dordrecht, 511 pp., 2004.
Free, M., Seidel, D., Angell, J., Lanzante, J., Durre, I., and Peterson T.: Radiosonde
Atmo-5
spheric Temperature Products for Assessing Climate (RATPAC): A new dataset of large-area anomaly time series, J. Geophys. Res., 110, D22101, doi:10.1029/2005JD006169, 2005. Fu, Q., Johanson, C., Wallace, J., and Reichler, T.: Enhanced mid-latitude tropospheric
warm-ing in satellite measurements, Science, 312, 1179, doi:10.1126/science.1125566, 2006. Hansen, J., Ruedy, R., Sato, M., and Lo, K.: Global surface temperature change, Rev.
Geo-10
phys., 48, RG4004, doi:10.1029/2010RG000345, 2010.
Hu, Y. and Fu, Q.: Observed poleward expansion of the Hadley circulation since 1979, Atmos. Chem. Phys., 7, 5229–5236, doi:10.5194/acp-7-5229-2007, 2007.
Hu, Y., Li, D., and Liu, J.: Abrupt seasonal variation of the ITCZ and the Hadley circulation, Geophys. Res. Lett., 34, L18814, doi:10.1029/2007GL030950, 2007.
15
Hudson, R., Frolov, A., Andrade, M., and Follette, M.: The total ozone field separated into meteorological regimes, Part I: Defining the regimes, J. Atmos. Sci., 60, 1669–1677, 2003. Johanson, C. and Fu, Q.: Hadley cell widening: Model simulations versus observations, J.
Climate, 22, 2713–2725, 2009.
Jones, P., New, M., Parker, D., Martin, S., and Rigor, I.: Surface air temperature and its
varia-20
tions over the last 150 years, Rev. Geophys., 37, 173–199, 1999.
Kistler, R., Kalnay, E., Collins, W., Saha, S., White, G., Woollen, J., Chelliah, M., Ebisuzaki, W., Kanamitsu, M., Kousky, V., van den Dool, H., Jenne, R., and Fiorino, M.: The NCEP-NCAR 50-Year Reanalysis: Monthly Means CD-ROM and Documentation, B. Am. Meteorol. Soc., 82, 247–268, 2001.
25
Lu, J., Vecchi, G., and Reichler, T.: Expansion of the Hadley cell under global warming, Geo-phys. Res. Lett., 34, L06805, doi:10.1029/2006GL028443, 2007.
Mitas, C. and Clement, A.: Has the Hadley cell been strengthening in recent decades?, Geo-phys. Res. Lett., 32, L03809, doi:10.1029/2004GL021765, 2005.
Mitas, C. and Clement, A.: Recent behavior of the Hadley cell and tropical
ther-30
CPD
8, 695–713, 2012Changes in the strength and width of the Hadley circulation
since 1871
J. Liu et al.
Title Page
Abstract Introduction
Conclusions References
Tables Figures
◭ ◮
◭ ◮
Back Close
Full Screen / Esc
Printer-friendly Version
Interactive Discussion
Discussion
P
a
per
|
Dis
cussion
P
a
per
|
Discussion
P
a
per
|
Discussio
n
P
a
per
Oort, A. and Yienger, J.: Observed interannual variability in the Hadley circulation and its con-nection to ENSO, J. Climate, 9, 2751–2767, 1996.
Poore, R., Quinn, T., and Verardo, S.: Century-scale movement of the Atlantic Intertrop-ical Convergence Zone linked to solar variability, Geophys. Res. Lett., 31, L12214, doi:10.1029/2004GL019940, 2004.
5
Santer, B., Wigley, T., Mears, C., Wentz, F., Klein, S., Seidel, D., Taylor, K., Thorne, P., Wehner, M., Gleckler, P., Boyle, J., Collins, W., Dixon, W., Doutriaux, C., Free, M., Fu, Q., Hansen, J., Jones, G., Ruedy, R., Karl, T., Lanzante, J., Meehl, G., Ramaswamy, V., Russell, G., and Schmidt, G.: Amplification of surface temperature trends and variability in the tropical atmosphere, Science, 309, 1551–1556, 2005.
10
Schneider, T., O’Gorman, P., and Levine, X.: Water vapor and the dynamics of climate changes, Rev. Geophys., 48, RG3001, doi:10.1029/2009RG000302, 2010.
Seidel, D. and Randel, W.: Recent widening of the tropical belt: Evidence from tropopause observations, J. Geophys. Res., 112, D20113, doi:10.1029/2007JD008861, 2007.
Sherwood, S.: Simultaneous detection of climate change and observing biases in a network
15
with incomplete sampling, J. Climate, 20, 4047–4062, 2007.
Song, H. and Zhang, M.: Changes of the boreal winter hadley circulation in the NCEP-NCAR and ECMWF reanalyses: a comparative study, J. Climate, 20, 5191–5200, 2007.
Tanaka, H., Ishizaki, N., and Nohara, D.: Intercomparison of the intensities and trends of Hadley, Walker and monsoon circulations in the global warming projections, SOLA – Sci.
20
Online Lett. Atmos., 1, 77–80, 2005.
Vecchi, G. and Soden, B.: Global Warming and the Weakening of the Tropical Circulation, J. Climate, 20, 4316–4340, 2007.
Whitaker, J., Compo, G., Wei, X., and Hamill, T.: Reanalysis without radiosondes using ensem-ble data assimilation, Mon. Weather Rev., 132, 1190–1200, 2004.
25
CPD
8, 695–713, 2012Changes in the strength and width of the Hadley circulation
since 1871
J. Liu et al.
Title Page
Abstract Introduction
Conclusions References
Tables Figures
◭ ◮
◭ ◮
Back Close
Full Screen / Esc
Printer-friendly Version
Interactive Discussion
Discussion
P
a
per
|
Dis
cussion
P
a
per
|
Discussion
P
a
per
|
Discussio
n
P
a
per
|
Table 1. Correlations between the strength, width and edge of the Hadley Circulation, and regressions of the strength and width of the Hadley Circulation on the averaged 20CR2 surface air temperature in the tropics and subtropics (TSSAT).
Correlation Regression Width Edge (N) Edge (S) (1010kg s−1◦C−1
) TSSAT Strength (N) −0.59 −0.59 −0.17 −0.66 (−0.88)
Strength (S) −0.06 0.19 −0.46 1.67(1.28)
CPD
8, 695–713, 2012Changes in the strength and width of the Hadley circulation
since 1871
J. Liu et al.
Title Page
Abstract Introduction
Conclusions References
Tables Figures
◭ ◮
◭ ◮
Back Close
Full Screen / Esc
Printer-friendly Version
Interactive Discussion
Discussion
P
a
per
|
Dis
cussion
P
a
per
|
Discussion
P
a
per
|
Discussio
n
P
a
per
Fig. 1. Comparison of the vertical structures of the annual-mean temperature trends (◦C per
CPD
8, 695–713, 2012Changes in the strength and width of the Hadley circulation
since 1871
J. Liu et al.
Title Page
Abstract Introduction
Conclusions References
Tables Figures
◭ ◮
◭ ◮
Back Close
Full Screen / Esc
Printer-friendly Version
Interactive Discussion
Discussion
P
a
per
|
Dis
cussion
P
a
per
|
Discussion
P
a
per
|
Discussio
n
P
a
per
|
CPD
8, 695–713, 2012Changes in the strength and width of the Hadley circulation
since 1871
J. Liu et al.
Title Page
Abstract Introduction
Conclusions References
Tables Figures
◭ ◮
◭ ◮
Back Close
Full Screen / Esc
Printer-friendly Version
Interactive Discussion
Discussion
P
a
per
|
Dis
cussion
P
a
per
|
Discussion
P
a
per
|
Discussio
n
P
a
per
Fig. 3. Annul and seasonal trends of (a) the strength of the northern and southern Hadley Circulation (×1010kg s−1 per decade), and (b) the poleward-edge and width of the Hadley
CPD
8, 695–713, 2012Changes in the strength and width of the Hadley circulation
since 1871
J. Liu et al.
Title Page
Abstract Introduction
Conclusions References
Tables Figures
◭ ◮
◭ ◮
Back Close
Full Screen / Esc
Printer-friendly Version
Interactive Discussion
Discussion
P
a
per
|
Dis
cussion
P
a
per
|
Discussion
P
a
per
|
Discussio
n
P
a
per
|
Fig. 4. (a)Climatology (×1010kg s−1) and (b) trend (×1010kg s−1 per decade) of the mass
CPD
8, 695–713, 2012Changes in the strength and width of the Hadley circulation
since 1871
J. Liu et al.
Title Page
Abstract Introduction
Conclusions References
Tables Figures
◭ ◮
◭ ◮
Back Close
Full Screen / Esc
Printer-friendly Version
Interactive Discussion
Discussion
P
a
per
|
Dis
cussion
P
a
per
|
Discussion
P
a
per
|
Discussio
n
P
a
per
Fig. 5. Scatter plots of the strength and width of the Hadley Circulation versus the aver-aged 20CR2 surface air temperature in the tropics and subtropics (30◦S–30◦N) during the