Performance evaluation of the Sysmex
®
XE-2100D automated hematology analyzer
Avaliação do desempenho analítico do analisador hematológico Sysmex
®XE-2100D
Tavany Elisa Santos Maciel1; Samuel Ricardo Comar2; Miriam Perlingeiro Beltrame3
First submission on 08/06/13; last submission on 20/06/13; accepted for publication on 12/09/13; published on 20/02/14
1. Biomedicine graduate of Faculdades Pequeno Príncipe; master’s student of the Post-Graduation Program in Biomedical Engineering at Universidade Tecnológica Federal do Paraná (UTFPR); biomedical scientist at Hospital Municipal de Araucária-PR.
2. Biochemistry/Pharmacy graduate of Universidade Federal do Paraná (UFPR); doctoral student of the Post-Graduate Program in Internal Medicine and Healthcare Sciences from UFPR; master’s degree in Phamaceutical Sciences – area of Medical Laboratory Science from UFPR; specialist in Laboratory Hematology from Sociedade Brasileira de Análises Clínicas (SBAC); biochemist/pharmacist at the hematology sector of Laboratório Municipal de Análises Clínicas Dr. Gerson Bruschini Ribeiro, Araucária-PR; biochemist/pharmacist at the hematology laboratory of Hospital de Clínicas da UFPR (HC-UFPR).
3. Biochemistry/Pharmacy graduate of Universidade Federal de Santa Maria (UFSM); master’s degree and doctorate in Internal Medicine and Healthcare Sciences from UFPR; specialist in Immunology from UFPR; professor of hematology at the Biomedical Science and Pharmacy courses of Faculdades Pequeno Príncipe; biochemist/pharmacist at the immunophenotyping laboratory of HC-UFPR.
ABSTRACT
Introduction: The Sysmex® XE-2100D is a multiparameter hematology analyzer designed for hematology testing in samples with
ethylenediamine tetraacetic acid (EDTA). Objectives: Considering the importance of this hematology analyzer for clinical and laboratory practice, the objective of this study was to evaluate its analytical performance, comparing the obtained results with quality speciications described in literature. Material and method: In the evaluation of analytical performance, according to recommendations of the document H26-A2 of the Clinical and Laboratory Standards Institute (CLSI), intra-run imprecision, inter-run imprecision, linearity, carryover, autosampler evaluation, clinical sensitivity of the atypical lymphocytes lag (n = 400 samples) were included, as well as the comparison between automated and manual leukocyte differential count (n = 400 samples), based on an adaptation of the document H20-A2 of CLSI. Results: Repeatability, reproducibility, linearity and carryover were satisfactory according to the manufacturer’s speciications. The clinical sensitivity of the atypical lymphocytes lag showed eficiency, sensitivity and speciicity of 92.5%, 65.2% and 94.1% respectively. The correlation coeficients between the automated and manual differential counts of neutrophils, lymphocytes, monocytes, eosinophils and basophils were 0.991, 0.99, 0.872, 0.974 and 0.557, respectively. Conclusions: The results were in accordance with quality speciications described in literature, indicating reliability in Sysmex® XE-2100D. This fact ensures certainty to both laboratory professionals and medical staff. We conclude that the Sysmex® XE-2100D showed excellent analytical performance, and is useful to provide reliable hematology data.
Key words: automation; hematology analyzer; Sysmex® XE-2100d; analytical performance; quality control.
INTRODUCTION
One of the most important discoveries in the development of hematology analyzers was the formulation of the principle of electrical impedance, patented by the American engineer Wallace Henry Coulter on October 20, 1953. Originally created to count the number of particles in dairies, the impedance method was soon adapted to count blood cells, especially due to the increased
a new hematology analyzer, called Microcell Counter, model CC-1001. In order to avoid the use of the impedance principle, patented by Coulter, Sysmex then developed the capacitance method, that would be replaced by impedance as soon as Coulter’s patent expired in 1976(10, 12, 23, 28).
More than 40 years went by since hematology parameters began being measured by automated methods. During those years analyzers continually evolved due to companies’ efforts and abilities to meet the market needs, and to scientiic processes related to the peripheral technologies necessary to make such development possible. Sysmex XE-2100D is a fully automated hematology analyzer that determines eight validated parameters for the red blood cells, 13 for the white blood cells and two for platelets that may also be used for body luid cell counts. It is classiied as a high-volume hematology analyzer, designed for hospitals with intense work routines and for reference laboratories that perform thousands of tests per day. It has a nominal capacity of approximately 150 tests per hour, besides being able to warn users as to the presence of qualitative and quantitative abnormalities in blood cell populations. It uses luorescence low cytometry with light scattering as a principle for differential and total leukocyte count. For erythrocyte and platelet count, it uses the principle of impedance with hydrodynamic focusing, and for hemoglobin measurement, a method with sodium lauryl sulfate (6, 16, 19).
The analytical performance of hematology analyzers is traditionally assessed by tests for precision, accuracy, linearity, carryover, comparability, reproducibility and clinical sensitivity of analyzer-generated lags. When one interprets the results from patients’ samples, it is important to understand the possible occurrence of random errors or analytical imprecision of the results, irrespective of the likely inluence of analytical variability and patients’ health condition on results. Performance evaluation of the automated hematology analyzers must be carried out in all laboratories, mainly in those with a large number of samples with very high or very low cell counts and that serve populations with potential to present relevant blood alterations(5, 7, 8, 15, 26).
Considering that the complete blood count is one of the most frequently ordered exams in medical appointments and a fundamental exam to detect any pathology that is relected in the blood stream, the validation of results from a hematology analyzer becomes an item of special importance, especially for relecting the quality of laboratory work and directly inluencing patients clinical conduct. Aimed at increasing quality of the complete blood count results provided by laboratories, is it necessary to assess the analytical performance of hematology analyzers, so as to ensure that the obtained results are the most reliable possible.
The objective of this study was to evaluate the analytical performance of hematology analyzer Sysmex® XE-2100D, given its relevance in laboratory and clinical practices. It is important to highlight that this study, besides being a basis upon which other hematology laboratories understand the usefulness of validating a hematology analyzer, will provide data for the validation of hematology analyzers in laboratory routines.
MATERIALS AND METHODS
Study site, samples and patients
This study was conducted in the Hematology sector of Laboratório Municipal de Análises Clínicas Dr. Gerson Bruschini Ribeiro, in the town of Araucária, Paraná. All used samples came from residue material of the laboratory routine, randomly selected and belonging to patients whose complete blood count was ordered. Samples were collected in tubes containing ethylenediamine tetraacetic acid dipotassium salt (EDTAK2) as anticoagulant. All samples were analyzed at the hematology equipment Sysmex® XE-2100D within three hours after collection.
Linearity
This test allowed establishing the linear correlation between theoretical values and those observed in practice by means of the analysis of several dilutions of a certain sample. Linearity for leukocytes and platelets was assessed by the conduction of seven dilutions: 1\2; 1\4; 1\8; 1\16; 1\32; 1\64; 1\128 of two samples selected from laboratory routine. One sample obtained the leukocyte values of > 65 × 10³/µl, and another sample obtained the platelet value of > 730 × 10³/µl. Dilutions were performed with the equipment solvent (Cellpack, Sysmex). Prior to dilution analysis, Sysmex® XE-2100D was washed with 5% sodium hypochlorite and distilled water. Dilutions were homogenized and inverted 20 times; afterwards, they were analyzed in duplicate. The linear equation and the correlation coeficient between theoretical and practical values were calculated for leukocytes and platelets(29).
Carryover
for each parameter was calculated with the following formula: carryover (%) = |L1 - L3|/(H3-L3) × 100(3). Where L1 and L3 were the results of the irst and third measurement of samples with low concentration, and H3 was the third measurement of the sample with high concentration. For leukocytes, the low and the high sample contained values of 0.34 × 10³/µl and 100 × 10³/ µl, respectively. For erythrocytes, 1.5 × 10⁶/µl and 6 × 10⁶/µl, respectively. For hemoglobin, 4 g/dl and 18g/dl, respectively. For globular volume, 14% and 55%, respectively; for platelets, 20 × 10³/µl and 1,020 × 10³/µl respectively.
Autosampler evaluation
A rack with 10 random samples was analyzed, previously homogenized during ive minutes. Next, samples were allowed to stand in vertical position during four hours. Afterwards, they were analyzed directly and with no prior homogenization. Sample homogenization was done exclusively by the autosampler, which does it by inverting tubes 10 times. Erythrocyte, leukocyte and platelet counts were compared. The maximum allowed variations between these both procedures were: erythrocytes (± 1.5%), leukocytes (± 3%), and platelets (± 5%)(21, 27).
Intra-run imprecision or repeatability
The objective of this test was to determine the analyzer capacity to reproduce the results for a certain parameter in a given sample. Analyses were carried out in normal conditions, by the same operator, in the same period of the day and with the same reagent lots. In order to adequate samples to the analytical ranges to be assessed, their dilutions were performed. A sample with normal values, one with increased leukocyte values (> 50 × 10³/ µl) and a sample with increased platelet values (> 1,000 × 10³/ µl) were used. The prepared samples were analyzed 10 consecutive times in the closed mode of Sysmex® XE-2100D. The mean, the standard deviation (SD) and the coeficient of variation (CV) were calculated for each parameter. It is worth highlighting that before samples were analyzed, the analyzer was washed with 5% sodium hypochlorite and distilled water. Prior to the analysis, samples were homogenized and inverted 20 times.
Inter-run imprecision or reproducibility
It was aimed at determining the capacity of the analyzer to reproduce results of hematological parameters, when samples were analyzed several times during the same day or in the course of several days. Reproducibility was carried out by analyzing sample results of internal quality control through three concentrations
levels (low, normal and high). Such samples were analyzed during 57 consecutive days, before the beginning of the routine. At the lot expiration date, data were sent to Sysmex external proiciency testing, called Insight Program. For each hematologic parameter, the mean, SD and CV were calculated.
Comparison between the manual and automated
differential count of leukocytes
During a period of ive consecutive days, 400 samples were collected from routine with their printed results of Sysmex XE-2100D, along with blood smears, so as to allow comparison between the manual and automated differential count of leukocytes. Blood smears were manually created and stained by May-Grünwald and Giemsa method. Manual differential count was performed in 400 cells per slide at an optical microscope. This count was based on an adaptation of the document CLSI H20-A2(7). According to this document, comparisons between manual and automated differential leukocyte counts must be performed by counting two blood smears of each sample, in which 200 cells are counted in each slide by two different observers. In case an accentuated difference is observed, a third slide must be created and analyzed by a third observer. Just then average percentages are calculated for each cell type. In this work 400 cells per slide were counted, in a total of 400 blood smears, by a single observer only. In an attempt to minimize errors inherent in the technique, 400 cells per slide were counted, as it was not possible to create more than one blood smear per sample. For each slide read, the percentage of neutrophils, lymphocytes, monocytes, eosinophils and basophils was calculated. The obtained results were compared with other studies and with the manufacturer’s speciications.
Clinical sensitivity for atypical lymphocytes lag
2% of atypical lymphocytes, the sample was classiied as true positive (TP). If a sample was positive for the atypical lymphocytes lag and no atypical lymphocytes ≥ 2% were found at microscopy, the sample was classiied as false positive(FP). If a sample was negative for the atypical lymphocytes lag and had ≥ 2% of atypical lymphocytes in the microscopic analysis, the sample was classiied as false negative (FN). Finally, if a sample was negative for the atypical lymphocytes lag and did not present any relevant inding on the slide, the sample was classiied as true negative (TN)(1, 9, 24).
Statistical analysis
The obtained results were statistically analyzed by using the program Excel (Microsoft Corporation, USA). The correlation between the manual and automated differential count of leukocytes was made by regression analysis, determining the correlation coeficient (r) and comparing it with current speciications in literature. Sensitivity, speciicity, positive predictive value, negative predictive value and eficiency related to the clinical sensitivity for atypical lymphocytes lag were calculated as follows: sensitivity (%) = (VP/VP + FN) × 100; speciicity (%) = (VN/VN + FP) × 100; negative predictive value (%) = (VN/VN + FN) × 100; positive predictive value (%) = (VP/VP + FP) × 100; and eficiency (%) = (VP + VN/VP + FP + FN + VN) × 100(14).
RESULTS
Linearity
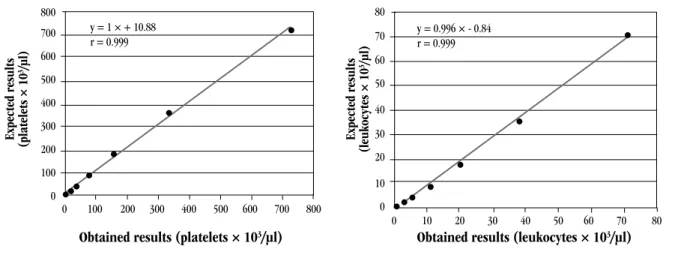
Linearity was veriied for leukocytes and platelets, and for both it presented an excellent correlation coeficient (0.999) between theoretical and observed values (Figure 1).
Carryover
For all the assessed parameters the carryover was ≤ 1%, according to the manufacturer’s speciications(27). Results are shown in Table 1.
FIGURE 1 – Linearity for platelets and leukocytes (Sysmex® XE-2100D)
Expected result
s
(platelet
s × 10
3/μl)
Expected result
s
(leukocytes × 10
3/μl)
Obtained results (platelets × 103/μl) Obtained results (leukocytes × 103/μl) y = 1 × + 10.88
r = 0.999 800
700
600
500
400
300
200
100
0
80
70
60
50
40
30
20
10
0 0 100 200 300 400 500 600 700 800
0 10 20 30 40 50 60 70 80 y = 0.996 × - 0.84
r = 0.999
TABLE 1 – Carryover (%), Sysmex® XE-2100D
Parameters %
Leukocytes 0.08
Erythrocytes 0.36
Hemoglobin 0.46
Globular volume 0.4
Platelets 0.04
Autosampler evaluation
The average variation between the analyzed samples with or without previous homogenization for erythrocytes, leukocytes and platelets was 0.51%, 1.34% and 5.38%, respectively. Erythrocytes and leukocytes were below the allowed limits of 1.5% and 3%, respectively. The variation for platelets was above the allowed limit of 5%.
Intra-run imprecision or repeatability
Inter-run imprecision or reproducibility
Results are shown in Table 3. There are quality speciications that suggest that the maximum intra-analyzer imprecision for
hematological parameters must be lower than half of the intra-individual biological variability (CV(analytical) or imprecision < 0.5 × CV(intra)). All the CVs observed in this trial, except relative and absolute monocyte count in the three used levels were lower than the cited speciication(4). Erythrocytes, hemoglobin, globular volume and the corpuscular constants showed exceptional precision, with CV < 1.5% for the three levels. Neutrophil and lymphocyte differential counts were also excellent, with CVs < 5%.
Comparison between the manual and automated
differential count of leukocytes
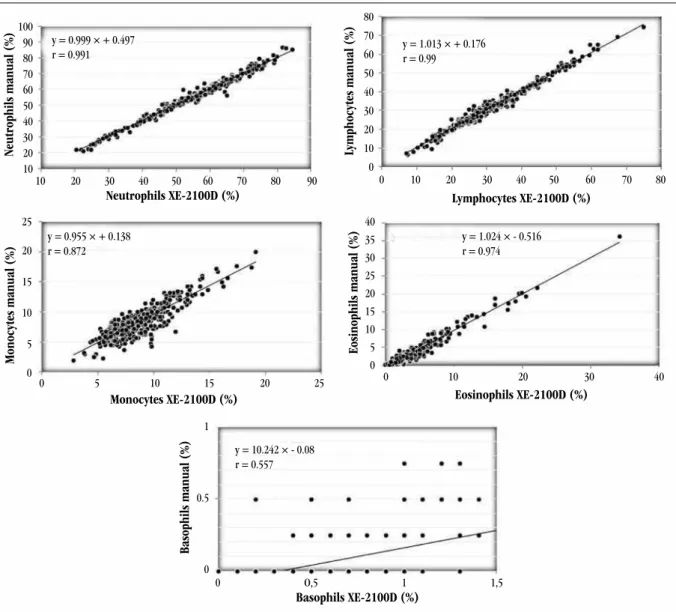
Results were excellent, as can be seen in Figure 2. All correlation coeficients were above the limits speciied by the manufacturer(27).
TABLE 2 – Intra-run imprecision for leukocytes, platelets and globular volume Leukocytes
(× 10³/µl) CV (%)
Platelets (× 10³/µl)
CV (%)
Globular volume (%)
CV (%)
< 1 8.6 10-20 6,5
1-4 3 20-50 5 < 20 0.3
4-10 2 150-400 1 38-45 0.4
10-20 2.4 400-1,000 2 > 50 0.92
> 50 1 > 1,000 1
CV: coefficient of variation.
Neutrophils manual (%)
Monocytes manual (%)
Basophils manual (%)
Eosinophils manual (%)
Lymphocytes manual (%)
Neutrophils XE-2100D (%)
Monocytes XE-2100D (%) Eosinophils XE-2100D (%)
Basophils XE-2100D (%)
Lymphocytes XE-2100D (%)
100 90 80 70 60 50 40 30 20 10
1
0.5
0
80 70 60
50 40
30
20
10
0
40
35 30
25 20
15 10
5 0 25
20
15
10
5
0
10 20 30 40 50 60 70 80 90
0 5 10 15 20 25 0 10 20 30 40
0 O,5 1 1,5
0 10 20 30 40 50 60 70 80 y = 0.999 × + 0.497
r = 0.991
y = 0.955 × + 0.138 r = 0.872
y = 10.242 × - 0.08 r = 0.557
y = 1.024 × - 0.516 r = 0.974 y = 1.013 × + 0.176 r = 0.99
TABLE 3 – Reproducibility results, Sysmex® XE-2100D
Parameters Low control Normal control High control
SD Mean CV SD Mean CV SD Mean CV
Erythrocytes 0.021 2.31 0.9 0.030 4.36 0.7 0.036 5.27 0.7
Hemoglobin 0.07 5.7 1.2 0.09 11.9 0.8 0.11 15.7 0.7
Globular volume 0.17 17.2 1.0 0.34 35.1 1 0.38 45.3 0.8
MCV 0.52 74.4 0.7 0.45 80.5 0.6 0.42 86 0.5
MCH 0.25 24.5 1.0 0.2 27.4 0.7 0.19 29.8 0.6
MCHC 0.42 32.9 1.3 0.36 34 1.1 0.27 34.7 0.8
RDW 0.13 16.1 0.8 0.08 14.6 0.5 0.07 14.6 0.5
Leukocytes 0.086 2.95 2.9 0.101 6.7 1.5 0.257 16.69 1.5
Neutrophils% 1.25 46.5 2.7 1.04 50.2 2.1 1.08 54.2 2
Lymphocytes% 1.27 34.3 3.7 1.05 29.9 3.5 0.96 26.4 3.6
Monocytes% 0.89 9.8 9.1 1.07 9.4 11.4 1.11 8.1 13.7
Eosinophils% 0.77 9.4 8.2 0.63 10.5 6 0.87 11.3 7.7
Basophils% 1.31 65.6 2.0 1.02 69.9 1.5 0.49 75.8 0.6
Neutrophils# 0.056 1.37 4.1 0.078 3.37 2.3 0.231 9.05 2.6
Lymphocytes# 0.051 1.01 5.0 0.071 2 3.5 0.182 4.41 4.1
Monocytes# 0.028 0.29 9.7 0.075 0.63 11.9 0.182 1.35 13.5
Eosinophils# 0.022 0.28 7.9 0.044 0.7 6.3 0.148 1.88 7.9
Basophils# 0.072 1.94 3.7 0.089 4.68 1.9 0.206 12.65 1.6
Platelets 2.6 55 4.7 4.6 205 2.2 8.5 469 1.8
MPV 0.29 9.1 3.2 0.11 9.3 1.2 0.09 9.4 1
MCV: mean corpuscular volume; MCH: mean corpuscular hemoglobin; MCHC: mean corpuscular hemoglobin concentration; RDW: red cell distribution width; %: relative value; #: absolute value; MPV: mean platelet value; SD: standard deviation; CV: coefficient of variation.
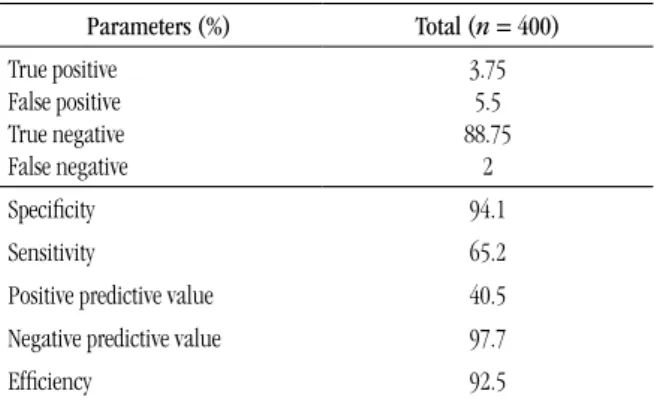
TABLE 4 – Clinical sensitivity for the atypical lymphocytes lag of the hematology analyzer Sysmex XE®-2100D Parameters (%) Total (n = 400) True positive
False positive True negative False negative
3.75 5.5 88.75
2
Speciicity 94.1
Sensitivity 65.2
Positive predictive value 40.5
Negative predictive value 97.7
Eficiency 92.5
Clinical sensitivity for atypical lymphocytes lag
The values found for eficacy, sensitivity, speciicity, positive predicted value and negative predictive value are shown in Table 4. Eficiency in the classiication of samples with or without atypical lymphocytes ≥ 2% was 92.5%, that is, of the 400 analyzed samples, 370 were correctly classiied. Speciicity of 94.1% indicated that 355 samples in 377 that did not present atypical lymphocytes ≥ 2% at microscopy (TN + FP) were correctly classiied. The negative predictive value observed indicated that in 97.7% of the times that the analyzer did not generate the atypical lymphocytes lag, the microscopic counterpart was not observed either (atypical lymphocytes ≥ 2%).
DISCUSSION
The linearity study was satisfactory in comparison with other studies. Regression lines went through the origin and the r values were close to 1, evidencing linearity at very low and very high concentrations. Nakul-Aquaronne et al.(22) obtained an r value of 0.99 for platelets and 1 for leukocytes in the linearity study at
The carryover values in this study (Table 2) were satisfactory when compared with those recommended by the equipment manufacturer(27): the carryover for leukocytes, erythrocytes, hemoglobin, globular volume and platelets must be ≤ 1%. Nakul-Aquaronne et al.(22) observed a carryover of 0.05% for leukocytes and 0.04% for platelets at XE-2100. Another study with XE-2100 found values for leukocytes of 0.04%, erythrocytes of 0.14% and platelets of 0.04%, while for globular volume and hemoglobin there was no carryover(14). It is worth highlighting that before the analysis, washes with hypochlorite and water were made at Sysmex XE-2100D so as to avoid a background count. The results of this assessment conirmed the eficiency of the wash made between a sample analysis and another.
There is a time interval between collection and the conduction of the exam, when the tube stands still and erythrocyte sedimentation occurs. In order to adequately count the sample, it must be homogenized before the exam, in hematologic homogenizers for ive minutes, especially if the hematologic analyzer does not have a sample loader system in racks. In case it does, an evaluation of the counter sampler must be done to verify the possibility of forgoing previous homogenization, what helps decrease sample processing time. The results obtained in this study demonstrate that Sysmex XE-2100D sampler was able to adequately homogenize samples for erythrocyte and leukocyte count. For platelets, the 5.38% result was above the recommended limit of 5%. Therefore, a previous sample homogenization is recommended before they are analyzed at Sysmex XE-2100D. A suggestion to decrease variation would be homogenizing samples in the rack, manually, for 10 times, before placing it in the hematologic analyzer autosampler.
Intra-run imprecision results were excellent when compared with the speciications of the equipment manual(27), which indicates that the CV for leukocytes ≥ 4 × 10³/µl must be ≤ 3%. In this study the found value was 2% (Table 2), what conirms that Sysmex XE-2100D has operated beyond the speciications deined by the manufacturer. For platelets with counts ≥ 100 × 10³/µl the precision limit must be ≤ 4% and in this study it was ≤ 4% (Table 2).The globular volume also presented satisfactory results, since the CV must be ≤ 1.5% and the values found in this study ranged from 0.34% to 0.36% (Table 2). As expected, for low platelet and leukocyte values, CV was higher. Similar results were found in the study conducted by Nakul-Aquaronne et al.(22), in which precision for low platelet and leukocyte values resulted in high CV in analyzers Abbott Cell-Dyn 4000, Sysmex SE-9500 and XE-2100. A bigger variation in low counts may happen because the low leukocyte and platelet concentrations are on the extreme of linearity in this hematologic analyzer, which may be not able
to perform counts with high precision due to the lower number of counted cells, taking into account that the dilution performed by the analyzer is always in the same proportion for any sample.
There are quality speciications that recommend intra-analyzer imprecision may range from 25% to 50% in relation to biological variation for a certain parameter; however, when one intends to compare results between two different analyzers, the acceptable limit of variation must be higher, principally because they are independent analytical systems and there is the need to consider the existence of small differences in the target values of commercial controls for each equipment, when they come from different manufacturers or belong to different models, what implies small differences in accuracy(9). The determination of intra-run imprecision was important to show the analyzer quality in test conduction and to conirm the fact that when the sample is analyzed more than once, differences will be minimum.
Imprecision, as well as the other tests of analytical performance, must be obtained in the environment where the hematologic analyzer will work and by the technical staff that will operate it. The scope of the evaluations depends, above all, on the hematological parameter ranges reported by the laboratory. Hospital laboratories must evaluate imprecision in the lower extremes of hematological parameters. Platelet count of 10-20 × 103/µl showed intra-run imprecision of 6.48%, which was better than the previously documented imprecision for the platelet count by impedance at Sysmex XE-2100, which was 13.6% in counts within these ranges(11). Nowadays there are analyzers, like the recently launched modular system Sysmex XN, with imprecision of just 4% in the platelet count by optical luorescence method in these same intervals(2).
Reproducibility was assessed to document calibration stability over time for all the parameters reported in the complete blood count. Reproducibility must always be veriied in samples with several levels of concentration, so as to comprise the analytical intervals that occur in the laboratory. As expected, at low levels CVs were higher for erythrocytes, leukocytes and platelets due to their low concentrations in the blood. The differential count of monocytes presented high CVs in the three assessed levels (Table 3). Goosens et al.(13) documented the precision problem of monocyte count in hematology analyzers, as well as this study; however the clinical signiicance of this imprecision is low.
The comparative study between the XE-2100D manual and automated differential count of leukocytes showed excellent comparability, even in leukopenic samples. The ive-part differential count of the XE-2100D is precise, accurate and reliable. The correlation coeficient of basophils was 0.557, probably because there is a low basophil count in normal people’s blood, what increases imprecision in the differential count of this speciic parameter. In spite of this, the correlation of basophil count was acceptable, for the manufacturer recommends the correlation coeficient to be ≥ 0.5. Studies of leukocyte differential count with XE-2100D were not found in literature, but studies performed with XE-2100, which uses similar detection principles, showed identical results to those of this study(29). The coeficients found in this study for neutrophils, lymphocytes, monocytes and eosinophils were 0.991, 0.99, 0.872 and 0.974, respectively (Figure 2). The manufacturer recommends they are higher than 0.9, 0.9, 0.75 and 0.8, respectively. Therefore, the performance of Sysmex XE-2100D as regards comparability far outweighs the speciications recommended by the manufacturer. Just in few cases with low absolute and relative counts imprecision increased. Herklotz and Huber(17) made a comparison between the manual and automated differential count of XE-2100D by the analysis of 500 cells in normal and pathological samples, and the correlation was also high for neutrophils and lymphocytes (r > 0.98) and eosinophils (r = 0.95).
Assessing the eficiency of morphologic lags is of utmost importance for laboratories, because it helps professionals that analyze blood smears microscopically. Sensitivity for a lag refers to the capacity to detect truly positive samples, speciicity is the capacity to detect truly negative samples, positive predictive value is the probability that a positive result is truly positive, and negative predictive value is the probability that a negative result is truly negative. In order to be useful, a morphologic lag must present low rate of false positives and false negatives, so as to result in high eficiency to identify samples showing relevant morphological abnormalities. However, it is known that there are situations when the occurrence of false positive and false negative rates is unavoidable. One must maximize efforts to keep false negative rates within safe and acceptable limits.
In the present study sensitivity was not very high (65.2%), but speciicity was very good (94.1%). Ruzicka et al.(24) found sensitivity of 36% for atypical lymphocytes lag and suggested that the broad morphologic deinition of atypical lymphocytes may have been responsible for the low sensitivity. Nakul-Aquaronne et al.(22) found sensitivity and speciicity > 90% and a negative predictive value of 98% for atypical lymphocytes lag in the XE-2100. The value of false negatives for atypical lymphocytes in this study was 2%, what demonstrates high quality equipment screening. False positive rates were 5.5%, indicating that 22 slides in 400 were unnecessarily read.
The type of sample selected for such analysis is an important source of variation because they inluence the sensitivity and speciicity of the analyzer being evaluated. The use of outpatients’ samples, as in this study, normally has fewer false positive and false negative results than that of inpatients’ samples. Laboratory staff is recommended to be well-acquainted with the strong and weak points of their speciic hematology analyzer(18).
In hematology analyzers, the cutoff values to determine sensitivity and speciicity of lags are adjusted to offer more false positive results, because the consequences of errors due to excessive analysis of blood smears are less dramatic than omissions of information relevant to patients’ diagnosis and follow-up(1). Thus, some works proposed a way to maximize lags eficiency, through the development of a probability rate that helps in the deinition of cutoff values set in analyzers, which would minimize the occurrence of false negative and false positive values(20, 25).
CONCLUSION
The equipment Sysmex XE-2100D proved to be a hematology analyzer of high analytical performance, being suitable for medium and large laboratories. The results obtained in this study indicate the reliability of parameters offered by this analyzer, besides certainty in the analysis of blood smears.
RESUMO
Introdução: O Sysmex® XE-2100D é um analisador hematológico multiparamétrico destinado à realização de testes
REFERENCES
1. BARNES, P. W. et al. The international consensus group for hematology review: suggested criteria for action following automated CBC and WBC differential analysis. Lab Hematol, v. 11, n. 2, p. 83-90, 2005.
2. BRIGGS, C. et al. Performance evaluation of the Sysmex haematology XN modular system. J Clin Pathol, v. 65, n. 11, p. 1024-30, 2012. 3. BRIGGS, C. Evaluation of hematology analyzers. In: KOTTKE-MARCHANT, K; DAVIS, B. H. Laboratory hematology practice. Singapore: Wiley-Blackwell, p. 96-102, 2012.
4. BUTTARELLO, M. Quality speciication in haematology: the automated blood cell count. Clin Chim Acta, v. 346, n. 1, p. 45-54, 2004.
5. BUTTARELLO, M.; PLEBANI, M. Automated blood cell counts: state of the art. Am J Clin Pathol, v. 130, n. 1, p. 104-16, 2008.
6. CHAPMAN, M. Hematology analyzers offer new technology and user-friendliness. Lab Med, v. 31, n. 3, p. 146-50, 2000.
7. CLINICAL and Laboratory Standards Institute (CLSI). Reference leukocyte (WBC) differential count (proportional) and evaluation
of instrument methods: Approved standard. 2nd ed. Wayne, PA: CLSI
Document H20-A2, 2007.
8. CLINICAL and Laboratory Standards Institute (CLSI). Validation, verification, and quality assurance of automated hematology
analyzers. Approved standard. 2nd ed. Wayne, PA: CLSI Document
H26-A2, 2010.
9. COMAR, S. R. Quando se trabalha com mais de um equipamento é importante que as calibrações estejam semelhantes? Como se realiza esta veriicação? In: MARTINHO, M. S. C. Hematologia em laboratório
clínico. (Coleção 156 perguntas e respostas). Org. OPLUSTIL, C. P. São
Paulo: Sarvier; p. 190-2, 2012.
10. COULTER, W. H. Means for counting particles suspended in a fluid. USP 2656508, 1958.
11. DE LA SALLE, B. J. et al. The accuracy of platelet counting in thrombocytopenic blood samples distributed by the UK National External Quality Assessment Scheme for general haematology. Am J Clin Pathol, v. 137, n. 1, p. 65-74, 2012.
12. FUJIMOTO, K. Principles of measurement in hematology analyzers manufactured by Sysmex Corporation. Sysmex J Int, v. 9, n. 1, p. 31-44, 1999.
13. GOOSENS, W.; VAN HOVE, L.; VERWILGHEN, R. L. Monocyte counting: discrepancies in results obtained with different automated instruments. J
Clin Pathol, v. 44, n. 3, p. 224-7, 1991.
14. GOULD, N. et al. Performance evaluation of the Sysmex XE-2100™ automated hematology analyzer. Sysmex J Int, v. 9, n. 2, p. 120-8, 1999. 15. GUIDELINES for the evaluation of blood cell analyzers including those used for differential leukocyte and reticulocyte counting and cell marker applications. International Council for Standardization in Haematology: Expert Panel in Cytometry. Clin Lab Haematol, vol. 16, n. 2, p. 157-74, 1994.
16. HAWKER, C.D. Laboratory automation: total and subtotal. Clin Lab Med, v. 27, n. 4, p. 749-70, 2007.
17. HERKLOTZ, R.; HUBER, A. R. Precision and accuracy of the leukocyte differential on the Sysmex XE-2100. Sysmex J Int, v. 11, n. 1, p. 8-21, 2001. 18. KOEPKE, J. A. Instrumental lagging and blood ilm review. In: ROWAN, R. M.; VAN ASSENDELFT, O. W.; PRESTON, F. E. Advanced
laboratory methods in haematology. New York: Arnold; p. 64-77, 2002.
19. KUNISHI, H. On our experience of using HS transportation system XE-AlphaTM. Sysmex J Int, v. 9, n. 2, p. 139-43, 1999.
20. LACOMBE, F. et al. Evaluation of the differential flags on a hematology analyzer (Cobas Argos 5 Diff). Am J Clin Pathol, v. 104, n. 5, p. 495-502, 1995.
21. LANGFORD, K. et al. Performance evaluation of the Sysmex XT-2000i automated hematology analyzer. Lab Hematol, v. 9, p. 29-37, 2003. 22. NAKUL-AQUARONNE, D. et al. Evaluation of the Sysmex® XE-2100 hematology analyzer in hospital use. J Clin Lab Anal, v. 17, n. 4, p. 113-23, 2003.
23. OKADA, T. Development and problem of automated hematology analyzer. Sysmex J Int, v. 9, n. 1, p. 52-7, 1999.
24. RUZICKA, K. et al. The new hematology analyzer Sysmex XE-2100: Performance evaluation of a novel white blood cell differential technology. Arch Pathol Lab Med, v. 125, n. 3, p. 391-6, 2001.
incluídos ensaios de verificação da imprecisão intraensaio ou repetitividade, imprecisão entre ensaios ou reprodutibilidade, linearidade, carryover (arraste), avaliação do mecanismo homogeneizador de amostras, sensibilidade clínica do alerta morfológico (flag) de linfócitos atípicos (n = 400 amostras) e a comparação entre a contagem diferencial de leucócitos automatizada e a manual (n = 400 amostras), baseada em uma adaptação do documento H20-A2 do CLSI. Resultados: Os ensaios de verificação da repetitividade, reprodutibilidade, linearidade, carryover (arraste) foram satisfatórios conforme especificações do fabricante. O ensaio de sensibilidade clínica do alerta morfológico (flag) de linfócitos atípicos mostrou eficiência, sensibilidade e especificidade de 92,5%; 65,2% e 94,1% respectivamente. Os coeficientes de correlação entre as contagens diferenciais automatizadas e manuais de neutrófilos, linfócitos, monócitos, eosinófilos e basófilos foram de 0,991; 0,99; 0,872; 0,974 e 0,557 respectivamente. Conclusões: Os resultados obtidos mostraram-se de acordo com as especificações da qualidade analítica descritas na literatura, indicando confiabilidade no Sysmex® XE-2100D. Esse fato confere segurança
tanto aos profissionais do laboratório quanto à equipe médica. Conclui-se que o Sysmex® XE-2100D apresentou excelente
desempenho analítico, sendo de grande utilidade para fornecer resultados hematológicos confiáveis.
MAILING ADDRESS
Samuel Ricardo Comar
Laboratório Municipal de Análises Clínicas Dr. Gerson Bruschini Ribeiro; Rua Guilherme da Mota, 55 – Centro; CEP: 83702-210, Araucária- PR, Brazil; Tel.: +55(41) 3614-1623; e-mail: [email protected].
25. SIRECI, A.; SCHLABERG, R.; KRATZ, A. A method for optimizing and validating institution-speciic lagging criteria for automated cell counters. Arch Pathol Lab Med, v. 134, n. 10, p. 1528-33, 2010. 26. STAMMINGER, G. et al. Performance of the XE-2100 leukocyte differential. Clin Lab Haematol, v. 24, n. 5, p. 271-80, 2002.
27. SYSMEX CORPORATION. Operator’s Manual. Automated Hematology
Analyzer XE-2100L/XE-2100D. Main Unit. Kobe, Japão: North American Edition, 2011.