Performance of the Pediatric Index of Mortality 2
in a pediatric intensive care unit
INTRODUCTION
Ever since their appearance in Sweden in 1955,(1) pediatric intensive care units (PICUs) have provided a relevant contribution to the care of severely ill children based on the best use of human resources and high-cost equipment as well as continuous monitoring of patients, thus allowing for early intervention and better therapeutic outcomes, including recovery and prevention or reduction of permanent disabling injuries. However, this modality of care is associated with high inancial costs. In the United States, the expenses associated with intensive care represented approximately 1% of the gross domestic product in 1994, i.e., USD 67 billion.(2)
Antônio Lima Netto1, Virginia Maria Muniz1,
Eliana Zandonade2, Ethel Leonor Noia Maciel3,
Rodrigo Nichio Bortolozzo1, Nélio Ferreira Costa1,
Rosane da Silva de Araujo Limongi1
1. Pediatric Intensive Care Unit and Neonatology Task Group, Hospital Infantil Nossa Senhora da Glória, Secretaria Estadual de Saúde do Espírito Santo - Vitória (ES), Brazil.
2. Department of Statistics, Center of Exact Sciences, Universidade Federal do Espírito Santo - Vitória (ES), Brazil. 3. Department of Nursing, Center of Health Sciences, Universidade Federal do Espírito Santo - Vitória (ES), Brazil.
Objective: To assess the discrimination and calibration of the Pediatric Index of Mortality 2 in patients admitted to a pediatric intensive care unit.
Methods: he study was conducted
with a contemporary cohort from November 2005 to November 2006. Patients aged 29 days to 18 years were included in the study. Patients who died within 12 hours of admission and cases of readmission were excluded from the study. he performance of the Pediatric Index of Mortality 2 was assessed by means of the Hosmer-Lemeshow goodness-of-it test, the standardized mortality ratio and the area under receiver operating characteristic (ROC) curve with 95% conidence interval. he signiicance level was established as 5%.
Results: A total of 276 admissions to the pediatric intensive care unit were included in the analysis. he mortality rate was 14.13%, and the eiciency
Conflicts of interest: None.
Submitted on October 2, 2013 Accepted on December 29, 2013
Corresponding author: Antônio Lima Netto
Alameda Mary Ubirajara, 205 - Santa Lucia Zip code: 29027-090 - Vitória (ES), Brazil E-mail: [email protected]
Desempenho do Pediatric Index of Mortality 2 em unidade de
cuidados intensivos pediátrica
ABSTRACT
Keywords: Intensive care units,
pediatric; Outcomes assessment (Health care); Mortality; Quality indicators, health care; Risk assessment; Child
of admission 0.88%. he median age of the sample was 42.22 months, and most participants were male (60.1%). Most admissions were referrals from the emergency department. he mean duration of stay in pediatric intensive care unit was 6.43±5.23 days. Approximately 72.46% of admissions were for clinical reasons and exhibited an association with the outcome death (odds ratio: 2.9; 95%CI: 1.09-7.74; p=0.017). Calibration of the Pediatric Index of Mortality 2 with the chi-square statistic was 12.2686 (p=0.1396) in the Hosmer-Lemeshow goodness-of-it test, and the standardized mortality ratio was 1.0. he area under the ROC curve assessing model discrimination was 0.778.
Conclusion: Pediatric Index of Mortality 2 exhibited satisfactory performance.
he results of studies that investigated the demographic proile, mortality, morbidity and average stay in PICUs vary as a function of characteristics particular to various countries and even among diferent health services in the same country. hese divergences not with standing, there is a consensus about the need for studies to improve the understanding of pediatric intensive care outcomes to allow for more adequate allocation of human, technological and inancial resources.
For the reasons outlined above, studies have been performed to assess various methods to predict the severity and mortality risk of children, including the Pediatric Risk of Mortality (PRISM),(3) PRISM III,(4) Pediatric Index of Mortality (PIM),(5) PIM2(6) and PIM3.(7) he aim of the present study was to investigate the performance of PIM2 at the PICU of the Hospital Infantil Nossa Senhora da Glória
(HINSG) by analyzing its calibration and discrimination.
METHODS
HINSG is ailiated with the public hospital network established by the State Department of Health of Espírito
Santo, Brazil and is a state and regional reference hospital
for specialized high-complexity pediatric care. he six-bed PICU of HINSG is a teaching and care-providing center that admits patients up to age 18 years, with 340 admissions per year on average.
Prospective data collection was performed from November 2005 to November 2006 in a contemporary cohort comprising all patients aged 29 days to 18 years. Patients who died within 12 hours of admission were excluded from the study, as well as cases of readmission and infants aged zero to 28 days. he study was approved by the Research Ethics Committee of HINSG, no. 43/2005, with a waiver of informed consent.
Eiciency of admission was deined as the percentage of patients that exhibited PIM2 >1% at admission. PIM2(6) includes clinical and laboratory data that are irmly established as part of the intensive care routine within the irst hour of admission (blood pressure, use of mechanical ventilation, pupillary light relex, arterial blood gases, recovery from surgical procedures, high- or low-risk diagnosis and elective admission or not). hus, no intervention was performed exclusively for research purposes or involved risk for the patients. he PIM2 scoring system is in the public domain, and its authors authorized its use in the present study.
he performance of the PIM2 was assessed through analysis of its calibration and discrimination. Calibration evaluates how well the model classifies patients into low-,
medium- and high-risk categories. For that purpose, the Hosmer-Lemeshow goodness-of-it test was used, which is based on individual PIM2 values, and displays the observed-expected mortality ratios in deciles or in standard risk categories (<1%, 1-4%, 5-15%, 1629%, ≥30%). For this test, p-values >0.05 denote a good it. he expected total mortality is the sum of the probabilities of death in each category. he standardized mortality ratio (SMR) represents the ratio of observed to expected mortality rates; values <1 imply good performance.(8)
Model discrimination was inferred from the area under the receiver operating characteristic (ROC) curve plotted using PIM2 values. he ROC curve represents the relationship between the sensitivity and speciicity of a given test(9) and in the present case expresses how well the model distinguishes between patients who lived and those who died. Although for some authors an area under the ROC curve of 0.75 or more is considered clinically useful,(8) for others, 0.70 is adequate.(10)
Analysis was performed using Statistical Package for the Social Sciences (SPSS) software version 11.0, EpiInfoTM version 3.3.2 and MedCalc version 9.2.1.0. Descriptive statistics were performed (frequency tables, calculation of means and standard deviation), as well as exploratory hypothesis testing and application of the chi-square test of association. he signiicance level was established as 5%.
To analyze the performance of the PIM2, the Hosmer-Lemeshow goodness-of-it test was used,(11) and the SMR and area under the ROC curve were calculated(12) together with the corresponding 95% conidence intervals (95%CI).
RESULTS
A total of 333 patients were admitted to the HINSG-PICU during the study period, and 57 were excluded (30 were newborn infants, 18 were readmissions, six died within 12 hours of admission, two were transferred to other hospitals and one was older than 18 years).
Table 2 describes the interquartile distribution of the studied sample according to age (in months), duration of stay in the PICU (in days) and PIM2 scores. Admissions for clinical reasons corresponded to 72.4% of the total number and exhibited association with an outcome of death (odds ratio- OR: 2.9; 95%CI: 1.09-7.74; p=0.01) (Table 3).
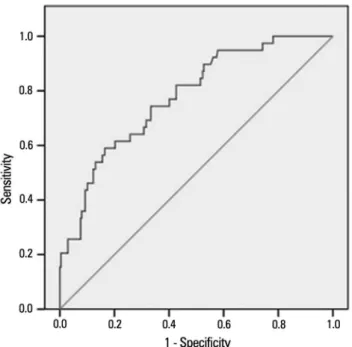
Tables 4 and 5 describe the results of the Hosmer-Lemeshow goodness-of-it test and the SMR values expressed in deciles according to the ive standard mortality risk categories described in the literature. he chi-square statistic was 12.26 (p=0.13) across deciles and 1.34 (p=0.71) across the ive risk categories. In both cases, the overall SMR was 1.0, although the variation corresponding to the highest and lowest risk scores was overestimated. Figure 1 depicts the comparison between the expected and observed mortality rates per risk category. he area under the ROC curve was 0.77 (95%CI: 0.720.82), as shown in igure 2.
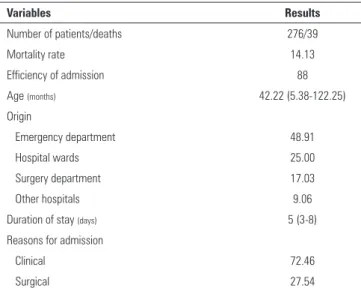
Table 1 - Overall characteristics of the sample
Variables Results
Number of patients/deaths 276/39
Mortality rate 14.13
Efficiency of admission 88
Age (months) 42.22 (5.38-122.25)
Origin
Emergency department 48.91
Hospital wards 25.00
Surgery department 17.03
Other hospitals 9.06
Duration of stay (days) 5 (3-8)
Reasons for admission
Clinical 72.46
Surgical 27.54
Efficiency of admission: number of patients with Pediatric Index of Mortality 2 >1% at admission. Results expressed as number (%), mean±standard deviation, or median (25%-75%).
Table 2 - Interquartile distribution of the variables of age, duration of stay and Pediatric Index of Mortality 2 score (N=276)
Age in months Duration of stay in days PIM2
Percentiles
25 5.38 3.00 1.6892
50 42.22 5.00 4.8373
75 122.25 8.00 10.1550
PIM 2 - Pediatric Index of Mortality 2.
Table 4 - Hosmer-Lemeshow goodness-of-fit test across Pediatric Index of Mortality 2 deciles and standardized mortality ratio according to the observed and expected mortality rates
Outcomes
Survival Death
PIM2 Observed Expected Observed Expected SMR
1 28 26.112 0 1.888 0
2 27 26.028 1 1.972 0.51
3 27 25.950 1 2.05 0.49
4 26 25.781 2 2.219 0.90
5 25 25.602 3 2.398 1.25
6 25 25.399 3 2.601 1.15
7 23 25.137 5 2.863 1.75
8 25 24.390 3 3.61 0.83
9 17 21.934 11 6.066 1.81
10 14 10.668 10 13.332 0.75
Total 237 237.001 39 38.999 1.00
PIM 2 - Pediatric Index of Mortality 2; SMR - standardized mortality ratio. χ2=12.26; p=0.13.
Table 5 - Hosmer-Lemeshow goodness-of-fit test across Pediatric Index of Mortality 2 risk categories and standardized mortality ratio according to the observed and expected mortality rates
Outcomes
Survival Death
PIM2 Observed Expected Observed Expected SMR
0 I---1 33 32.22 0 0.78 0
1 I---5 102 102.54 7 6.46 1.08
5 I---15 72 72.11 12 11.89 1.01
15 I---30 19 20.26 10 8.74 1.14
>30 11 9.87 10 11.14 0.90
Total 237 237.00 39 39.01 1.00
PIM 2 - Pediatric Index of Mortality 2; SMR - standardized mortality ratio. χ2=1.34; p=0.71.
Table 3 - The variables origin and reason for admission according to outcomes
Variables Outcomes p value
Discharge Death
Origin
Emergency department 117 (49.37) 18 (46.15) 0.03
Hospital wards 57 (24.05) 12 (30.77)
Surgery department 45 (18.99) 2 (5.13)
Other hospitals 18 (7.59) 7 (17.95)
Admission
Clinical 166 (70.04) 34 (87.18) 0.01
Surgical 71 (29.96) 5 (12.82)
Total 237 (100) 39 (100)
Brazilian Health Surveillance Agency (Agência Nacional de
Vigilância Sanitária - ANVISA) for the care of severely
ill children. he investigated PICU does not perform therapeutic interventions, such as the use of extracorporeal membrane oxygenation (ECMO), inhaled nitric oxide, high frequency oscillatory ventilation, transplantations and use of the Swan-Ganz catheter.
he actual availability of PICU beds in our milieu results in a high prevalence of admissions of very severely ill individuals. In addition, as our hospital is a regional reference hospital for pediatric subspecialties, approximately 30% of the patients admitted to PICU exhibit comorbidities.
hese facts not with standing, the healthcare outcomes based on the PIM2 score are similar to those reported by other centers for the same type of patients. Studies conducted in countries with limited resources found a mortality rate of 32%,(13) while Briassoulis(14) reported a mortality rate of 12% in one Greek PICU, and Brady(15) reported mortality rates varying from 3.2% to10.1% in various PICUs in the United Kingdom.
Of the demographic variables, age has been associated with an outcome of death. Einloft et al.(16) found a mortality rate of 13.22% among infants younger than one year, with a relative risk (RR) of 1.86 (95%CI: 1.65-2.10; p<0.0001). De Freitas Aragão et al.(17) found a statistically signiicant association between death in children admitted to the PICU and age below two years (p=0.007). In the present study, however, no signiicant diferences were found in this regard.
A study conducted by El-Nawawy(18) that included 406 children admitted to the PICU of a pediatric teaching hospital in Egypt over a period of 13 months found a mortality rate of 38%. Approximately 57.9% of the children admitted to that PICU had been referred from the emergency department, although with no signiicant diference in outcome. In this context, the features inherent to emergency care of severely ill patients should also be taken into consideration, as interventions are performed in settings and under conditions quite diferent from those in other hospital departments.(19) his situation entails several possible determinants, including the type of care aforded, issues related to access to healthcare services, particularly high-complexity issues, organization of the healthcare network and diiculties associated with the regional distribution of specialized care. herefore, further studies assessing those features are needed.
he association found in the present study between admissions for clinical reasons and an outcome of death agrees with indings reported by other authors. In a study conducted
Figure 1 - Deaths according to risk categories - Pediatric Index of Mortality 2.
Figure 2 - Area under the ROC curve of the Pediatric Index of Mortality 2: 0.77 (95% confidence interval: 0.72-0.82).
DISCUSSION
by López-Herce et al.,(20) 66.5% of admissions were for clinical reasons and associated with a greater mortality rate compared to surgical patients, 6.5±3.7% versus 2.6±3.2%.
he duration of stay of severely ill patients in the ICU varies among the various centers and ranges from 6.8 to 11.6 days on average.(21,22) In the present study, the duration of stay of approximately 43% of non-survivors was four to seven days, and approximately 70% of deaths occurred within seven days of admission.
In their study conducted in Greece, Briassoulis et al.(14) found an increase in the duration of stay in the PICU in 2001 following a period of stability (1997-2000), which they attributed to an increase in the number of admissions of patients with chronic diseases. In contrast, the case-control study conducted by van der Heide et al.(23) did not ind signiicant diferences between the characteristics of long-term patients and the control group.
he Hosmer-Lemeshow goodness-of-it test yielded a chi-square value of 12.26 and p=0.14 across the analysis in deciles and a chi-square value of 1.34 and p=0.71 across the ive risk categories. he overall SMR was 1.0, although the variation corresponding to the strata with the highest and lowest risk scores was overestimated. hese results indicate satisfactory calibration.
In a study by hukral et al.,(13) the overall SMR was 1.57, and with the Hosmer-Lemeshow goodness-of-it test, the chi-square value was 7.64 (p=0.47). hese authors called attention to the fact that their study population from India exhibited demographic and socioeconomic proiles that were diferent from those in the country where PIM2 was irst formulated, in addition to a greater load of severity of illness being managed with fewer resources and diferences in the quality of care, which may have contributed to an underestimation of the mortality risk.
Although the SMR was 0.85 in a study by Eulmesekian et al.(24), the Hosmer-Lemeshow goodness-of-it test did not yield signiicant results. hese authors observed that several researchers have raised concerns about the use of the PIM2. In fact, the original PIM2 formulators recommended caution in the use of the Hosmer-Lemeshow goodness-of-it test because small and clinically irrelevant diferences within a large sample could exhibit the same p-value as large and clinically relevant diferences within a small sample.
One further topic deserving of attention concerns the collection of data at admission. At that time, as a function of the support measures established, some children may exhibit stable clinical conditions despite the severity of disease, the progression of which over time may thus contradict predictions associated with low PIM2 scores, as Martha et al.(22) discussed with regard to the PIM.
Slater et al.(6) proposed that the variations in PIM2 calibration maybe associated with the following factors: results of patient intervention, changing attitudes as to the indications for commencing and discontinuing life support, changes in the thresholds for admission to intensive care, and the clinical proile of patients. hese factors not with standing, these authors indicate a cutof point of 1.0 for the PIM2 SMR.
he area under the ROC curve found by various authors indicates that the discrimination of the PIM2 is adequate: 0.90 (95%CI=0.89-0.92);(24) 0.81 (95%CI=0.750.87);(13) 0.84 (95%CI=0.82-0.86);(15) 0.97 (95%CI=0.96-0.99).(25) he variation among these values is due to the above mentioned impact of the proile of each individual center on model performance. In the present study, the area under the ROC curve was 0.778 (95%CI=0.725-0.826), which indicates that the model discrimination was satisfactory in the assessed population.
he PIM2 exhibited mixed results in populations that were diferent from the one in which it was originally tested. For that reason in 2013, Straney et al. published an updated version of the PIM2 known as the PIM3,(7) which was based on an international, multicenter, prospective cohort study conducted in 2010 and 2011. hat version formulated a novel stratiication of the variables corresponding to recovery from surgical procedures (cardiac surgery with bypass, cardiac surgery without bypass and other surgical procedures) as well as the risk categories, which are currently deined as low-, high- and very high-risk. he model discriminatory performance was better in Australia and New Zealand (area under the ROC curve: 0.91 [0.90-0.93]), compared to the United Kingdom and Ireland (area under the ROC curve: 0.85 [0.84-0.86]).
According to the current evidence, the predictive ability of the PIM2 is not afected when it is calculated using data collected four hours after admission to the PICU.(26) Other authors found that the PIM2 score discriminated well between survivors and deaths in the PICU and emphasized the use of PIM2 in the stratiication of interventions.(27) One study conducted in a mixed ICU raised some concerns as to the use of the PIM2, as there was overestimation of deaths in the highest risk group, more particularly in cardiac-surgical patients.(28) his adjustment was based on the PIM3.(7)
present study had some limitations. As a function of its cross-sectional and descriptive design, the results entail limitations for the investigation of phenomena. hen, because the study was conducted in a single PICU, the results may not be extrapolated to other health services with diferent characteristics. Finally, the data collected for analysis are quite old, although the epidemiological and structural proile of the investigated PICU did not exhibit any changes, but the results agree with those reported in more recent studies.
CONCLUSION
he present study showed that the discrimination and calibration of the Pediatric Index of Mortality 2 were adequate. It further found an association between mortality and admission for clinical reasons, as well as with origin from the emergency department. As a function of its operational characteristics, the Pediatric Index of Mortality 2 may be used as an auxiliary tool for the management of intensive care units.
Objetivo: Avaliar a discriminação e a calibração do Pediatric Index of Mortality 2 em pacientes de uma unidade de cuidados intensivos pediátrica.
Métodos: Estudo de coorte contemporânea realizado no
período de novembro de 2005 a novembro de 2006. Os limites de idade foram 29 dias de vida e 18 anos. Excluídos aqueles com óbito em menos de 12 horas após admissão e readmissões. Para o desempenho do Pediatric Index of Mortality 2, foram aplicados o teste de Hosmer-Lemeshow, o índice padronizado de mortalidade
standardized mortality ratio e área sob a curva ROC, intervalo de coniança de 95%. O nível de signiicância foi de 5%.
Resultados: Foram estudadas 276 admissões de pacientes. A taxa de mortalidade foi de 14,13%, com eiciência de admissão de 0,88%. A mediana de idade foi de 42,22 meses, havendo
predomínio do gênero masculino com 60,1%. O setor de emergência foi responsável por 48,91% das admissões. Tempo de permanência foi de 6,43±5,23 dias (média). As admissões clínicas corresponderam a 72,46% e associaram-se ao óbito (odds ratio: 2,9; intervalo de coniança de 95%: 1,09-7,74; p=0,017). O Pediatric Index of Mortality 2 apresentou calibração com qui-quadrado de 12,2686 (p=0,1396) no teste de Hosmer-Lemeshow, e índice padronizado de morte de 1,0. A discriminação relacionada à área abaixo da curva ROC foi de 0,778.
Conclusão: O escore Pediatric Index of Mortality 2 apresentou desempenho satisfatório.
RESUMO
Descritores: Unidades de terapia intensiva pediátrica; Avaliação de resultados (Cuidados de saúde); Mortalidade; Indicadores de qualidade em assistência à saúde; Medição de risco; Criança
REFERENCES
1. Cútulo LR, Furtado Júnior JR, Botelho L. Perfil dos pacientes internados na unidade de terapia intensiva pediátrica do Hospital Infantil Joana de Gusmão no Ano de 1993. ACM Arq Catarin Med. 1994; 23(2):95-100. 2. Chalfin DB, Cohen IL, Lambrinos J. The economics and cost-effectiveness of
critical care medicine. Intensive Care Med. 1995;21(11): 952-61.Review. 3. Pollack MM, Ruttimann UE, Getson PR. Pediatric risk of mortality (PRISM)
score. Crit Care Med. 1988;16(11):1110-6.
4. Pollack MM, Patel KM, Ruttimann UE. PRISM III: an updated Pediatric Risk of Mortality score. Crit Care Med. 1996;24(5):743-52.
5. Shann F, Pearson G, Slater A, Wilkinson K. Paediatric index of mortality(PIM): a mortality prediction model for children in intensive care. Intensive Care Med. 1997;23(2):201-7.
6. Slater A, Slater A, Shann F, Pearson G; Paediatric Index of Mortality (PIM) Study Group. PIM2: a revised version of the Paediatric Index of Mortality. Intensive Care Med. 2003;29(2):278-85.
7. Straney L, Clements A, Parslow RC, Pearson G, Shann F, Alexander J, Slater A; ANZICS Paediatric Study Group and the Paediatric Intensive Care Audit Network. Paediatric index of mortality 3: an updated model for predicting mortality in pediatric intensive care. Pediatr Crit Care Med. 2013;14(7):673-81.
8. Pearson GA, Stickley J, Shann F. Calibration of the paediatric index of mortality in UK paediatric care units. Arch Dis Child. 2001;84(2):125-8.
9. Fletcher RH, Fletcher SW. Diagnóstico. In: Fletcher RH, Fletcher SW. Epidemiologia clínica: elementos essenciais. 4ª ed. Porto Alegre: Artmed; 2006. p. 56-81.
10. Lemeshow S, Le Gall JR. Modeling the severity of illness of ICU patients. A systems update. JAMA. 1994;272(13):1049-55.
11. Lemeshow S, Hosmer DW Jr. A review of goodness of fit statistics for use in the development of logistic regression models. Am J Epidemiol. 1982;115(1):92-106.
12. Hanley JA, McNeil BJ. The meaning and use of the area under a receiver operating characteristic (ROC) curve. Radiology. 1982;143(1):29-36. 13. Thukral A, Lodha R, Irshad M, Arora NK. Performance of Pediatric Risk
of Mortality (PRISM), Pediatric Index of Mortality (PIM), and PIM2 in a pediatric intensive care unit in a developing country. Pediatr Crit Care Med. 2006;7(4):356-61.
14. Briassoulis G, Filippou O, Natsi L, Mavrikiou M, Hatzis T. Acute and chronic paediatric intensive care patients: current trends and perspectives on resources utilization. QJM. 2004;97(8):507-18.
15. Brady AR, Harrison D, Black S, Jones S, Rowan K, Pearson G, Ratcliffe J, Parry GJ; UK PICOS Study Group. Assessment and optimization of mortality prediction tools for admissions to pediatric intensive care in the United Kingdom. Pediatrics. 2006;117(4):e733-42.
17. De Freitas Aragão, de Fátima M, Albuquerque PM, Gonçalves de Mello MJ, Ximenes RA. Risk factors associated with death in children admitted to a paediatric intensive care unit. J Trop Pediatr. 2001;47(2):86-91. 18. EL-Nawawy A. Evaluation of the outcome of patients admitted to the
pediatric intensive care unit in Alexandria using the pediatric risk of mortality (PRISM) score. J Trop Pediatr. 2003;49(2):109-14.
19. Carvalho PR, Torreão LA. Aspectos éticos e legais na emergência. J Pediatr (Rio J). 1999;75(Supl 2):S307-14.
20. López-Herce J, Sancho L, Martinón JM. Study of paediatric intensive care units in Spain. Spanish Society of Paediatric Intensive Care. Intensive Care Med. 2000;26(1):62-8.
21. Prieto Espuñes S, Medina Villanueva A, Concha Torre A, Rey Galán C, Menéndez Cuervo S, Crespo Hernández M. Asistencia a los niños críticamente enfermos en Astúrias: características y efectividad. An Esp Pediatr. 2002;57(1):22-8. 22. Martha VF, Garcia PC, Piva JP, Einloft PR, Bruno F, Rampon V. Comparação
entre dois escores de prognóstico (PRISM e PIM) em unidade de terapia intensiva pediátrica. J Pediatr (Rio J). 2005;81(3):259-64.
23. van der Heide P, Hassing MB, Gemke RJ. Characteristics and outcome of long-stay patients in a paediatric intensive care unit: a case-control study. Acta Paediatr. 2004;93(8):1070-4.
24. Eulmesekian PG, Pérez A, Minces PG, Ferrero H. Validation of pediatric index of mortality 2 (PIM2) in a single pediatric intensive care unit of Argentina. Pediatr Crit Care Med. 2007;8(1):54-7.
25. Mestrovic J, Kardum G, Polic B, Omazic A, Stricevic L, Sustic A. Applicability of the Australian and New Zealand Paediatric Intensive Care Registry diagnostic codes and Paediatric Index of Mortality 2 scoring system in a Croatian paediatric intensive care unit. Eur J Pediatr. 2005;164(12):783-4. 26. Sankar J, Chandel A, Dubey NK, Sreenivas V, Sankar MJ. Do interventions
in an ICU affect the predictive ability of pediatric index of mortality and pediatric index of mortality-2 scores in a tertiary care hospital? Pediatr Crit Care Med. 2013;14(2):e70-6.
27. Gandhi J, Sangareddi S, Varadarajan P, Suresh S. Pediatric index of mortality 2 score as an outcome predictor in pediatric Intensive Care Unit in India. Indian J Crit Care Med. 2013;17(5):288-91.