© FECAP
RBGN
Received on
September 28, 2013 Approved on November 19, 2015
1.Wander Leonhardt Ribeiro Master in Management of Organizations
FEA-RP/USP (Brazil)
2.Geciane Silveira Porto Doctor in Administration FEA/USP
(Brazil)
Review of Business Management
DOI:10.7819/rbgn.v17i58.1764
Analyses of innovation networks financed by
biotechnology and energy sector funds
Wander Leonhardt Ribeiro and Geciane Silveira Porto
Faculdade de Economia e Administração de Ribeirão Preto, Universidade de São Paulo, SP, Brasil
Responsible editor: João Maurício Gama Boaventura, Dr. Evaluation process: Double Blind Review
ABStRAct
Objective – his paper assessed the formation of innovation networks by irms and institutions of science and technology (IST) so that they can receive inancial resources from science and technology sector funds (SFs). SFs are the cornerstones of the Brazilian national system of innovation (NSI). As the funds were created slightly over a decade ago, it is high time they underwent revision.
Design/methodology/approach – The research used data from projects ofered by FINEP, RAIS and Economática. Beyond the pursuit of basic patents Derwent Knowledge of Reuters. Descriptive analyzes were performed, network analysis through Gephi software and applied a multiple regression to the available indicators on the impacts generated by FS. he indicators used originate from diferent areas of knowledge and are analyzed in light of the theory of open innovation.
Findings – In the preliminary stage of the program, funds were largely allocated to the science and technology sector, but irms had a low level of participation in the projects. In addition, patent applications are below expectations at that stage, given that one of the aims of SF is the incentive for technological development.
Practical implications – Despite the improved transparency in the Brazilian economy, restrictions on information do not permit the application of statistical tests to measure the impacts of investments in innovation
Originality/value – he innovation networks were assessed by social network analysis, which indicated that most nodes (actors) are occupied by more active ISTs, lowering any expectations for a higher level of participation by irms. Some suggestions are made for improving incentive programs for innovation and their management.
Analyses of innovation networks financed by biotechnology and energy sector funds
1 IntRODuctIOn
he deinition of innovation is ceasing to discriminate the technological status of economic activity. Developed countries have long devoted themselves to encouraging innovation through public policies by investing large amounts of funds (Albuquerque, Suzigan, Kruss, & Lee, 2015; Lundvall, 2004; Organisation for Economic Co-operation and Developmen [OECD], 2011). hese countries see innovation as a driving force of economic competition, which allows for long-term economic growth and, consequently, for social welfare.
Brazil has put in a great deal of efort in trying to boost competition by means of innovation since the opening of its market in 1990. To do so, it has stimulated the formation and consolidation of a national system of (NSI), as well as of regional systems of innovation (RSI) (Ganem & Santos, 2006; Negri & Lemos, 2011). he creation of sector funds (SFs) for science and technology (S&T) in 1999 is one of the cornerstones of innovation incentive policies for the creation and consolidation of the NSI. his mechanism, alongside other government policies such as the Innovation Act of 2004 and the Welfare Act of 2005, allowed more public funds to be allocated to science, technology and innovation (S,T&I). With more funds at hand, there has been an increase in public bids for the inancing of innovation projects at the irm level.
One of the goals of an NSI is to forge strong relationships between irms and institutes of science and technology (IST) through mutual cooperation, so that technology transfer (TT) is possible and innovation can be generated and disseminated across markets. his issue is relevant both for the establishment and improvement of public policies, targeted at improving the efficiency of the NSI, and for the firms and institutes that beneit from them (Albuquerque et al., 2015; Porto & Bazzo, 2010).
A l i t t l e ov e r a d e c a d e a f t e r t h e implementation of the SFs, this is the right
time to assess how the process has evolved, since information about the impacts of government funds on science and technology SFs in the economic sectors that beneit from such incentives is still limited. Studies concerning this impact may provide a qualitative assessment of incentive programs and spot their strengths and weaknesses in comparison with international innovation models. Negri and Lemos (2009) advocate the need to assess funds as an improvement tool.
herefore, the present study investigates t h e re s u l t s o f c o l l a b o r a t i ve i n n ova t i o n networks
obtained from projects
inanced by biotechnology and energy SFs. his involves the assessment of: a) developed projects in terms of their objectives and the amount of funds allocated to firms; b) sharing of innovation results among the irms in each of the selected innovation networks starting from their year of entry into the program; c) evolution of the level of technological efort of publicly listed companies contemplated by SFs starting from their year of entry into the program; d) analysis of the cohesion of collaborative networks through patent co-ownership applications.2 theORetIcAL BAcKGROunD
Since the analysis in this study focuses on the partnerships that led to the formation of innovation networks, it was made in light of the open innovation (OI) management model, which gives priority to the creation and application of the best business model to the irm as far as innovation is concerned. According to Chesbrough, Vanhaverbeke and West (2006, p. 2), “OI is the use of purposive inlows and outflows of knowledge to accelerate internal innovation, and expand the markets for external use of innovation, respectively.”
perspective, it has the following advantages: a) it allows for quicker contact with new technologies and business opportunities; b) it delays inancial commitment; c) it allows exiting business more quickly and reducing losses; and d) exit is delayed if there is a spin-off. These benefits are not obtained automatically, only through new skills and routines for developing the potential for practice of OI real options (Vanhaverbeke, Van De Vrande & Chesbrough, 2008).
In Brazil, after analyzing irms that invest in R&D, such as Aché, Bematech, Braskem, Cemig, Chemtech, Cristália, Embraco, Embraer, Embrapa, EMS Fíbria, Herbarium, Lupatech, Natura, Petrobrás, Sabó, Tigre, Usiminas Vale, and Weg, Pitassi and Bouzada (2011) found that 80% agreed that their involvement in innovation networks was crucial to the technological strategy. In 90% of the cases, they observed that Brazilian universities were the major participants in innovation networks, indicating a possible improvement in irm-university relationships.
Breschi, Lissoni & Malerba (2003) and Azzola, Landoni & Van Looy (2010) make it clear that patents are a powerful indicator of OI analysis, used as one of the indicators in the present study. Lecocq and Van Looy (2009) looked into patent citations in the European biotechnology sector and concluded that collaboration between regional irms and universities plays a major role in the stages of emergence and development of the technological life cycle, whereas collaboration between regional irms has a stronger impact only during the emergence of the technological life cycle.
In Brazil, few studies utilize patents as an indicator of an OI modeling strategy. Cordeiro (2010) assesses patents to analyze technological complementarity and collaborative strategy in OI. Although the use of OI in Brazil has increased in recent years, evidence still runs counter to the expected tendency towards the abandonment of the closed model (Francini, 2012; Dihel and Rufoni, 2012; Coutinho and Bomtempo, 2010). Given the importance of coordinating public policies for the OI model, which has been
adopted at a higher frequency by international technology-intensive irms and less frequently by Brazilian innovation-intensive firms, the following section holds a discussion on national and regional innovation systems, whose results are more favorable when the irms adopt the OI model in order to bring irms and ISTs, two major actors of the NSI, closer together.
2.1 national innovation systems
An NSI includes irms, ISTs, technology intermediaries, and inancial agents that interact with each other in a dynamic and systematic fashion (Malerba, 2004; Albuquerque et al., 2015), in addition to public policies for the incentive and promotion of innovation and economic development, so as to strengthen the systemic and socially determined aspects of innovation processes (Valle, Bonacelli & Salles Filho, 2002). Balzat and Hanusch (2004) deined an NSI as a historically increasing subsystem of the domestic economy, in which several organizations interact with each other, inluencing one another in the production of innovative activities.
Freeman (2002) related the formation of innovation networks and of an NSI to economic growth. For the World Bank (Goel et al., 2004), the NSI is one of the four basic elements for the development of a knowledge economy. he other three elements are: a) S,T&I public policies and institutional infrastructure that foster the dissemination of knowledge and entrepreneurship, producing social changes; b) education and training, leading to the development of a capable, lexible, and creative society, producing long-term knowledge; c) information infrastructure, allowing easy access of irms to good-quality information obtained from ISTs, thus making the innovation process more dynamic.
Analyses of innovation networks financed by biotechnology and energy sector funds
2.2 Innovation networks
The literature describes networks in many diferent ways (Ryan and Gross, 1943; Friedkin, 1982; Jackson and Watts, 2002), but there exists a consensus that they consist of the relationships of irms with other organizations, both horizontally and vertically, including those that extrapolate the limits of the industry to which they belong and with no restrictions on physical distances. By way of a network of relationships, entrepreneurs improve communication, sending and receiving information in a more accurate manner, which leads to business growth (Donckels and Lambrecht, 1995).
Gulati (1998) introduces a social network perspective to the study of strategic alliances. He extends his previous research, in which he considered alliances to be just a trade-off between transaction costs and agreements, adding essential aspects such as precursors, processes, and outcomes associated with alliances. hese aspects are deined and applied to the networks to which most irms belong. he author identiies ive fundamental aspects for the study of alliances: a) their formation; b) the choice of their governance structure; c) their dynamic evolution; d) their performance; and e) performance consequences for irms taking part in alliances.
Schilling and Phelps (2007) assert that the structure of collaborative relationship networks, i.e., their density, inluences their potential for creating knowledge and provides higher capacity of information dissemination through the network, stimulating both communication and cooperation between agents. Non-redundant connections shorten the distance between irms and expand their range of operation by increasing potential access to funds and knowledge. he author believes that irms taking part in collaborative relationship networks with high clustering and range will be more innovative than those with many redundant connections.
According to Amato (2000), the aims of innovation network formation include sharing competences, acquiring know-how from third
parties, splitting technological research costs, and sharing risks. he author concludes that the determining factors for the formation of these networks are: differentiation, which fosters innovation within the network without signiicantly increasing costs; interdependence, which stimulates network formation and provides organizational unit; and lexibility, which supplies the whole network with competitive advantage by giving it great ability to adapt to a changing business environment.
he history of a given business network is the process whereby time and money were invested in the construction, adaptation, development, understanding, relationship, and combination of diferent physical and human resources. So, there is a speciic structure and intensity with economic, technical, and social implications. Firms’ opportunities and limitations are related to the resources invested in relationships and in their internal capacity. Each relationship and the resources can be developed and combined with those of other irms in a number of ways. hese combinations create great opportunities for innovation, beneiting those irms that take part in the relationship (Håkansson and Ford, 2002).
Innovation network formation has three implications: a) they offer a coordination mechanism that allows for and supports interorganizational learning; b) they allow exploring complementarities, which is crucial for the mastery of innovative technological solutions, characterized by their complexity and multidisciplinary nature; and c) they create the possibility for the exploration of a synergistic interaction through the combination of diferent technological competencies (Küpers and Pyka, 2002).
2.3 Innovative behavior
performance indicators: a) R&D investments; b) patent applications; c) patent citations; and d) ads for the release of new products. hese indicators are closely related and overlap, showing that the use of any indicators separately is representative as a measure of irms’ innovative performance.
Ritter (1999, p. 1) postulates that “a particular skill can be identiied and described that allows companies to handle, use, and exploit single relationships and whole networks. The new construct “network competence” is measured by assessing a company’s degree of network management qualifications and execution of network management tasks.” Zukin and DiMaggio (1990) concluded that embeddedness is a transaction system with unique market-oriented opportunities and that irms within a relationship network have better opportunities and perceive risks well in advance, gaining competitive advantage. hus, irms have better chances of survival within their networks than irms that maintain market transactions.
Uzzi (1996) concluded that a networked firm, when it practices OI, attracts better opportunities, and perceives and neutralizes threats, which contributes to creating an image of a more efective competitor, translating into market value for the irm in the medium and long run. Hall and Mairesse (2009) advocate the use of the irm’s market value because it corresponds to an outlook on the future, taking into consideration both tangible and intangible R&D investment expectations. Hence, market value represents an aggregate value that contemplates other values related to network performance.
Borgatti and Halgin (2011) focused their analyses on structural measures such as centrality, cohesive subsets, structural equivalence, and regular equivalence. hey suggest adding statistical models such as the exponential random graph model (a new trend) and the time dimension, which is poorly investigated by studies on ailiation networks, proposing two important approaches for their development: graphic changes in ailiation and graphic changes over time between approaches to the analysis of
networks modo-2 and modo-3 (Borgatti, 2009). Carpenter, Li & Jiang (2012) highlight that highly cohesive connections make the sharing of funds among partners easier, demonstrating strong similarity and complementarity in terms of competencies, and also stimulate partners to act according to the expectations of others. herefore, network density indicates the presence of strong connections with third parties in a relationship.
3 MethOD
This is a quantitative and descriptive longitudinal study. It is an ex post facto study, since the data refers to projects that have already been concluded. Secondary data (Malhotra et al., 2005) was used, from FINEP databases for energy and biotechnology SFs, accessed from the e-SIC web portal. Data from the Annual Social Information Report (RAIS) published by the Brazilian Ministry of Labor and Employment (MTE)1 and from Economática, which shows publicly listed irms’ revenue and market value. Reuters’ Derwent database was also used; it allows simultaneous access to over 90 patent authorities around the world, including all the major oices such as USPTO (USA), Espacenet (Europe), JPO (Japan), in addition to INPI (Brazil), among others.
The range of firms and ISTs available from the SF database published by FINEP was used for the descriptive analysis and also for the construction and characterization of formed innovation networks. Cooper and Schindler (2004) deine the population as the full set about which we would like to make some inferences, as occurs in the present study.
Analyses of innovation networks financed by biotechnology and energy sector funds
to 2002-2009, especially due to the data available from Economática and from the FINEP database. By referring to the theoretical works that served as basis for the study, we deined the variables used:
a) Innovation networks (IN): they are a graphic representation made up of a set of nodes or actors (organizations) and edges (relationships) (Borgatti, 2009). Hence, irms and ISTs are the nodes, and collaborative relationships for innovation between firms and ISTs stem from biotechnology and energy projects allowed to use SF funds from 2002 to 2009. b) Structural variables refer to available
resources; process variables refer to activities; and performance variables refer to the outcomes.
c) Impacts of SFs: mean rate of revenue and mean rate of market value of the selected publicly listed companies.
d) Cohesion of innovation networks – CN: contents associated with the low of funds and the isomorphic pressure in each link of the pair.
e) he irm’s technological efort (FTE) proxy refers to the number of employees that work in and/or are assigned to R&D. f ) Sharing of network results – number
of patents with co-ownership between irm and IST, which protect innovations derived from the central topic of the agreement.
g) Number of network projects – number of SF-funded S&T projects for the period 1999-2009.
h) Funds allocated to ISTs – sum of total funds approved for the project, including research grants.
i) Growth of irms’ revenue is a performance variable.
j) he irm’s market value is also a performance variable and refers to the annual growth rate of the irm’s market value.
4 ReSuLtS
The biotechnology and energy SFs account for respectively 1.2% and 4.3% of the approximate amount of funds (R$ 4.5 billions) allocated to the program over the analyzed period (IPEA, 2009). here were 440 energy projects and 126 biotechnology projects, totaling investments of R$ 522,986,472.56 and R$ 180,082,297.17, respectively.
4.1 Analysis of projects funded by energy and
biotechnology SFs.
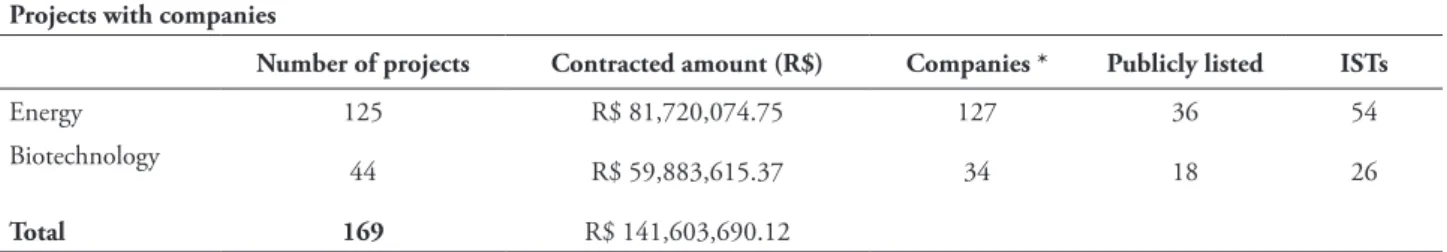
tABLe 1 – Description of projects with participation of companies involved in energy and biotechnology SF
Projects with companies
number of projects contracted amount (R$) companies * Publicly listed ISts
Energy 125 R$ 81,720,074.75 127 36 54
Biotechnology
44 R$ 59,883,615.37 34 18 26
total 169 R$ 141,603,690.12
* Excluding projects with participation of only universities, departments and government agencies and associations.
Figure 1 shows that publicly listed irms, compared with the total number of SF-funded irms, account for 35% of the biotechnology
sector and 28% of the energy sector. We highlight that 33% of the projects refer to the biotechnology SF, while 16% to the energy SF.
FIGuRe 1 – Representativeness of projects and volume of resources with the participation of companies compared to the total presented in the FINEP database.
Table 2 shows the total number of projects funded by the biotechnology and energy SFs, without the participation of private companies, including only universities and research institutes, which represent the S&T infrastructure. he projects were proposed by
NGOs and associations, in addition to State Departments, which may indicate the social or regional nature of the projects. It is important to underscore the large representation of these projects in the total amount of funds allocated to the biotechnology and energy SFs.
tABLe 2 – Representativeness of projects without the participation of companies in the SF, sorted by S & T interest projects, class interest, and regional interest
Biotechnology Energy
Universities and Research Institutes 63 251
Associations and NGOs 18 45
State Oices
3 20
Total value of the project without the participation of companies
R$ 120,198,681.80 R$ 441,266,397.81
Representation in SF
Analyses of innovation networks financed by biotechnology and energy sector funds
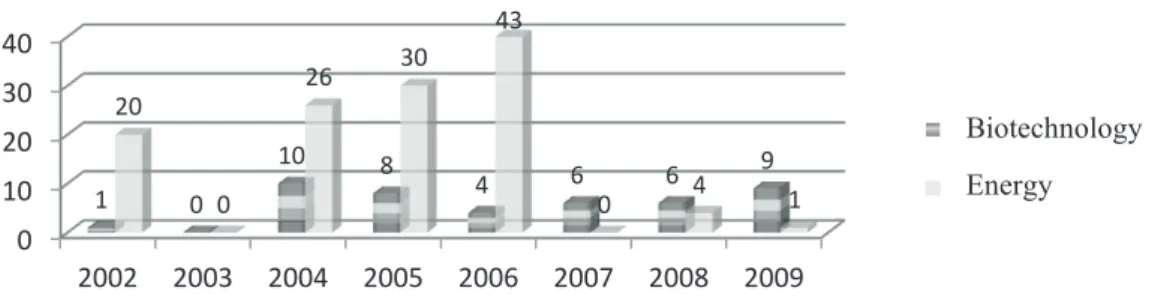
By analyzing the evolution of projects over time (Figure 2), there is a slight tendency towards an increase in the participation of irms in the biotechnology SF. On the other hand, in
the energy SF, after constant growth from 2002 to 2006, the inancing of projects by this fund virtually disappeared.
12
Figure 2.
Annual distribution of projects with participation of companies in th
010 20 30 40
2002 2003 2004 2005 2006 2007 2008 2009 1 0
10 8
4 6 6 9
20
0
26 30 43
0 4 1
Biotecnologia Energia
Biotechnology Energy
FIGuRe 2 – Annual distribution of projects with participation of companies in the biotechnology and energy SF.
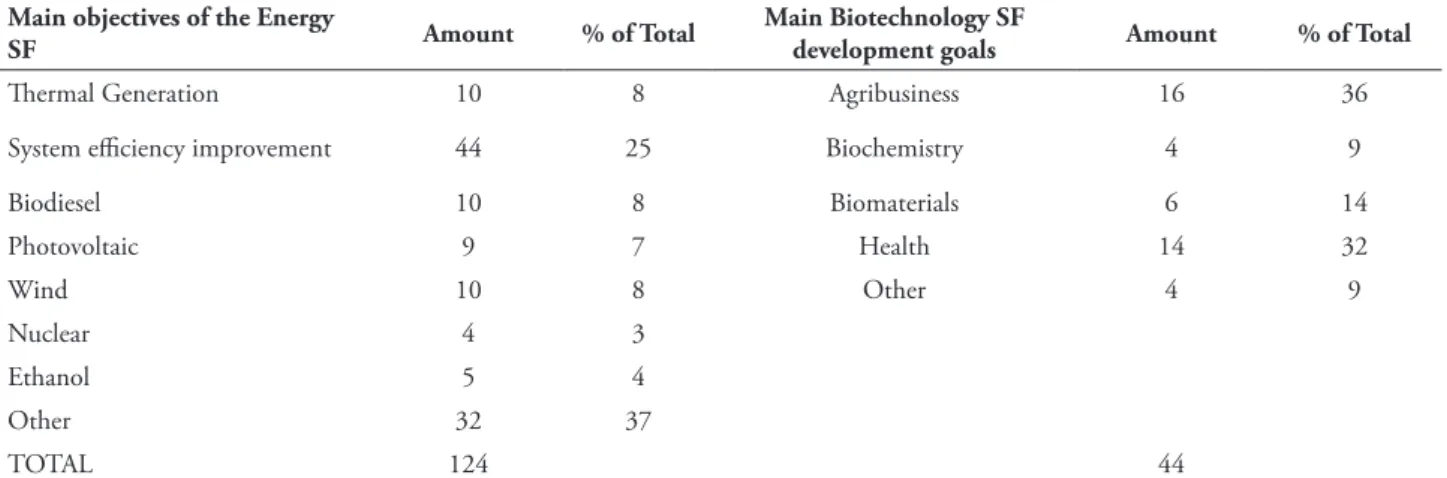
As to the objectives of the analyzed projects (Table 3), note that, in the case of the biotechnology SF, 50% of the projects have to do with agriculture, which predominated in the irst years of the program, followed by projects in the health sector, which became more frequent in the last years of the program. Other ields of interest included cosmetics, biochemistry, and biomaterials. he small participation in biofuels and bioenergy in both funds is noteworthy. In the case of energy SF in projects with participation of irms, 35% are concerned with the improvement of energy system and eiciency. Programs for the development of thermal and wind energy and biodiesel accounted for 8% each. Photovoltaic energy represented 7%, ethanol 4%, and nuclear power 3%. he low participation in projects aimed at ethanol development is of great relevance due to the importance of biofuels and of the bioelectricity potential, especially because of the strategic relevance of second-generation ethanol for procurement of a green energy matrix. he fact that 26% of the total number of projects in this fund is not related to energy is also a key aspect; they focus on the development of institutional management and S&T, export programs in the ceramics sector, and non-energy agribusiness.
Analysis of the project goals confirms that the allocation of funds in this initial stage of the program focused more on science than on innovation. In this analysis, innovation ranged from the consolidation of habitats and innovation infrastructure, such as the organization of Technological Innovation Centers (TICs) at ISTs, and personnel training in industrial property (IP) management and TT, incentive for the establishment of incubator networks, to speciic projects for new products or services, following the broader concept of innovation from the Oslo Manual (OCDE, 2005).
In the case of biotechnology SF, the igures were quite similar, i.e., 41% of the projects focused on innovation, including improvement and expansion of infrastructure for preclinical and
clinical analyses. he remaining 59% inanced projects were concerned with science, scientiic events, and scientiic infrastructure (organization of biological banks and the like).
tABLe 3 – Analysis of project objectives in energy and biotechnology SF
Main objectives of the energy
SF Amount % of total
Main Biotechnology SF
development goals Amount % of total
hermal Generation 10 8 Agribusiness 16 36
System eiciency improvement 44 25 Biochemistry 4 9
Biodiesel 10 8 Biomaterials 6 14
Photovoltaic 9 7 Health 14 32
Wind 10 8 Other 4 9
Nuclear 4 3
Ethanol 5 4
Other 32 37
TOTAL 124 44
4.2 Innovation networks
Based on the social network analysis method, innovation networks (Figures 3 and 4) were established, consisting of irms and ISTs inanced by SF from 1999 to 2011, dealing with projects which have companies as actors. Even with the low participation of irms in the total number of projects, some irms stood out. Most networks were formed by state-owned and mixed-capital companies, some of which acted as catalysts or ‘sponsors’, lending importance and reputation to projects taken on by small companies. In other cases, these companies clearly sought to develop research infrastructure with the implementation of laboratories and regional projects, but with no genuine interest in, or means for, the release of a new product in the market. Anyway, there were very few companies whose capital was totally private and which stood out as important nodes in innovation networks, helping to maintain a research program, which originates from the creation of a roadmap to be given an opportunity in the market and, therefore, develop multiple projects through diferent technological paths.
15
Networks formed by companies and ISTs with projects financed by biotFigure 3 – Networks formed by companies and
ISTs with projects inanced by biotechnology SF in the period 2002-2011.
Analyses of innovation networks financed by biotechnology and energy sector funds
(UNICAMP), and Universidade Federal de Goiás (UFG), all of them with three or more projects, was noteworthy. In the biotechnology network, central nodes are basically formed by ISTs. he network itself is too fragmented, looking more like a multiple cluster than an efective innovation network.
16
4. Networks of companies and ISTs with projects funded by the ene riod 2002-2011.
Figure 4 – Networks of companies and ISTs with projects funded by the energy SF in the period 2002-2011.
* CCB - Ceramic Center of Brazil.
The standouts in the energy network (Figure 4) were Eletrobrás, Copel, Whirpool do Brasil, Enersul Indústria e Soluções Energéticas, Indústrias Nucleares SA, and Petrobrás. Among ISTs, USFC, USP, UFPR, LACTEC, UFRJ and UFRGS, all with five or more projects, achieved a position of prominence. Hence, the energy SF proved to be a broader and closely interlinked network, with a more consistent principal component and several smaller clusters. his is desirable from the innovation network standpoint, as it may allow for the exchange of information and for the development of the whole NSI in Brazil.
he analysis of the networks identiied is complemented by the analysis of centrality graphs for each of the networks. he biotechnology network shows very low levels for this indicator (Figure 5), whereas the energy network yielded higher centrality values (Figure 6). Higher centrality values indicate the presence of more important nodes in terms of connectivity, which is equivalent to easy access to information and its dissemination over the network, complementarity, and sharing of funds, which are essential attributes for collaborative innovation networks. Thus, nodes with higher centrality values have a shorter distance from more distant edges and, therefore, are better positioned in the network.
4.3 company revenue and market value
growth
he analysis of inancial data was based on the information provided by Economática, but due to the limited number of irms that could be assessed, it was not possible to use a statistical model.
For the energy SF, there was information from 16 irms about revenue growth and from 13 irms about market value growth. For the biotechnology SF, data on revenue growth and on market value growth were obtained from three irms only. he other irms inanced by SF were not publicly listed and so they did not appear in the Economática database. Market value ranged
from 50 million to R$ 200 billion. Again, it should be highlighted that the information on publicly listed companies was used because it turned out to be the only available source of data. Certainly, the other irms were in the last quartile of the distribution regarding both revenue and market value.
Figure 7 shows the number of patent applications for the SF projects. Both fall short of what would be expected when one takes into consideration the main goal of SF, which is to promote technological development and innovation. his analysis was conducted for all irms participating in the SF during the study period and not only for publicly listed companies.
FIGuRe 7 – Patent applications iled after biotechnology and energy SF
he situation is much more critical in the case of the energy SF, both because of the number of projects and volume of allocated funds. An important aspect in this case is the failure to meet the requirement of co-ownership of ISTs in the energy fund for more innovative projects compared with the biotechnology sector. The energy program is characterized by the participation of large irms, with at least 10 irms with dozens or hundreds of patent applications.
Public company E8 participated in 20 projects, acted only as a ‘sponsor’ of projects for small companies, since it did not file for patents; consequently, patents were exclusively owned by small private companies. here is also the case of a mixed-capital company (E3), which did not share ownership with the ISTs included in the project.
Analyses of innovation networks financed by biotechnology and energy sector funds
tABLe 4 – Partial patent research – patents iled in the post ailiation period, patents referring to the project and patents shared with ICT – for companies whose variables evolution of sales and evolution in market value were drawn the Economática database
energy companies
Year of membership
number of Projects
contracted value of projects (R$)
total patents period
Patents resulting from projects
Patent shared with ISts
E11 2002 1 1,700,03.00 65 0 0
E1 2002 1 1,700,030.00 0 0 0
E12 2002 2 4,331,630.00 0 0 0
E13 2002 1 1,700,030.00 0 0 0
E14 2002 1 1,700,030.00 1 0 0
E15 2002 2 5,597,730.00 44 0 0
E2 2002 1 274,950.00 17 0 0
E16 2002 5 3,819,356.00 100 0 0
E3 2002 7 3,647,293.24 692 2 0
E4 2002 2 438,110.00 21 0 0
E5 2002 1 315,030.00 2 2 0
E6 2005 1 334,964.00 0 0 0
E7 2004 5 3,610,647.00 2 0 0
E8 2005 23 21.828.464.01 0 0 0
E9 2005 1 158.000.00 3 2 2
E10 2005 1 204.000.00 60 0 0
Biotechnology
B1 2005 1 251.050.00 58 0 0
B2 2008 1 9.143.850.80 0 0 0
B3 2009 3 3.201.357.00 55 1 1
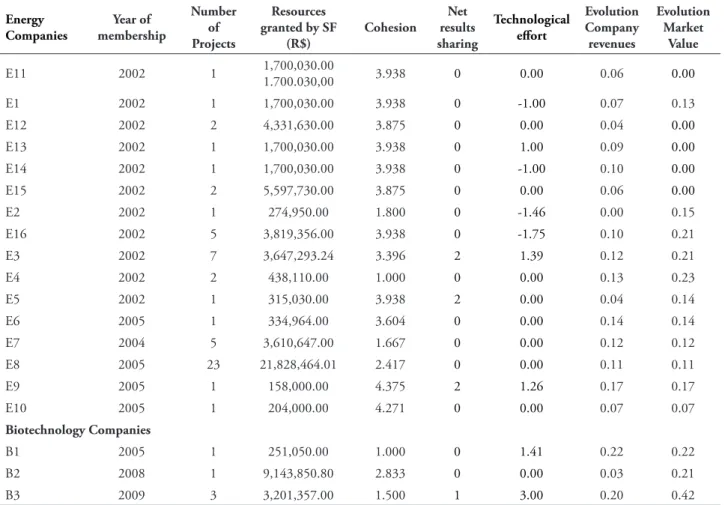
Table 5 shows the results for the irms’ average technological effort – publicly listed companies participating in the biotechnology and energy SFs, based on RAIS data and using the 2002 Brazilian Classiication of Occupations – CBO. For many irms, the CNPJ (National
tABLe 5 – Results of consolidated data listing in company research model
energy companies
Year of membership
number of Projects
Resources granted by SF
(R$)
cohesion net results sharing
technological efort
evolution company
revenues
evolution Market
Value
E11 2002 1 1,700,030.00
1.700.030,00 3.938 0 0.00 0.06 0.00
E1 2002 1 1,700,030.00 3.938 0 -1.00 0.07 0.13
E12 2002 2 4,331,630.00 3.875 0 0.00 0.04 0.00
E13 2002 1 1,700,030.00 3.938 0 1.00 0.09 0.00
E14 2002 1 1,700,030.00 3.938 0 -1.00 0.10 0.00
E15 2002 2 5,597,730.00 3.875 0 0.00 0.06 0.00
E2 2002 1 274,950.00 1.800 0 -1.46 0.00 0.15
E16 2002 5 3,819,356.00 3.938 0 -1.75 0.10 0.21
E3 2002 7 3,647,293.24 3.396 2 1.39 0.12 0.21
E4 2002 2 438,110.00 1.000 0 0.00 0.13 0.23
E5 2002 1 315,030.00 3.938 2 0.00 0.04 0.14
E6 2005 1 334,964.00 3.604 0 0.00 0.14 0.14
E7 2004 5 3,610,647.00 1.667 0 0.00 0.12 0.12
E8 2005 23 21,828,464.01 2.417 0 0.00 0.11 0.11
E9 2005 1 158,000.00 4.375 2 1.26 0.17 0.17
E10 2005 1 204,000.00 4.271 0 0.00 0.07 0.07
Biotechnology companies
B1 2005 1 251,050.00 1.000 0 1.41 0.22 0.22
B2 2008 1 9,143,850.80 2.833 0 0.00 0.03 0.21
B3 2009 3 3,201,357.00 1.500 1 3.00 0.20 0.42
Some irms in the energy sector reduced their workforce in R&D&I activities. Two contradictory factors should be stressed for the understanding of this sector. he irst one concerns the fact that the early 2000s were characterized by strong privatization eforts and consolidation in this sector. Moving companies from the public to the private sphere, especially through mergers, often means a cutback on staf for reorganization and later growth resumption. On the other hand, the concessions and privatizations model adopted led to a mandatory R&D fund that had to be used by participants. From this perspective, the model adopted aims to strengthen irms’ innovative activity in the energy sector and, consequently, the R&D workforce. Owing to this combination of factors, it is very hard to draw a conclusion
about these data. It is important to highlight the weaknesses of RAIS, mainly with respect to the commitment of irms to the completion of its questionnaire. However, RAIS is the available source of information for most studies on R&D employees, since PINTEC imposes strict restrictions on the access to its data (IBGE, 2015)
Analyses of innovation networks financed by biotechnology and energy sector funds
tABLe 6 – Correlation matrix of variables of the statistical model of publicly listed companies in the Energy SF. * 0,05 signiicance and ** 0,01 signiicance
NPR VTCR CR CCR ETE
NPR 1
-VTCR 0.955** 1
0.000
CR -0.309 -0.203 1
0.244 0.451
CCR -0.039 -0.173 0.255 1
0.885 0.521 0.341
ETE 0.071 0.022 0.149 0.554* 1
0.795 0.937 0.583 0.26
5 F I n A L c O n S I D e R At I O n S A n D
ReSeARch LIMItAtIOnS
he innovation networks formed by irms and ISTs in the energy and biotechnology SFs showed, in general, a higher level of participation of some ISTs, with irms playing a secondary role. Hence, one may say that ISTs were more active, yielded more central nodes, and allowed interconnecting different links in innovation network formation. ISTs also stood out in terms of centrality, which indicates the cohesion of publicly listed company networks in the energy and biotechnology SFs. As few irms had more central nodes in the networks, the structural properties demonstrated, in general, low variability, even with regard to centrality, the property with higher dispersion of results. By comparing the energy and biotechnology SFs, the latter was more fragmented, with lower participation of these same irms in other projects. Fragmentation also indicated some regional characteristics, which are perfectly understandable for a continental country. By and large, it is important that irms select their partners based on their competencies and have access to other ISTs, thereby expanding their access to information, technologies, and funds. he irms that stood out as to the number of projects and total volume of funds allocated to them were mostly public and mixed-capital ones, regarding both the level of participation in
the projects and the diversiication of partners and ISTs.
he technological efort made by publicly listed companies, measured by the number of employees in the R&D sector over the years, and taking into account their participation in SF, was undermined by the lack of information on the irms, based on their CNPJ consolidated data. his was the criterion used to collect revenue and market value growth data. he considerable changes the energy sector was subject to must be underscored: privatizations and consolidations of assets along with the creation of the mandatory innovation fund, previously discussed in the Results section. Nevertheless, these changes produced contradictory efects on the results of this variable. Some irms increased their workforce in the R&D sector. One should also recall the problem with using RAIS as source of data, as many authors criticized the lack of commitment of irms towards the completion of the questionnaire and the inaccuracy of their answers.
case of biotechnology, which is an industry based on knowledge and innovation, all cases followed the regulations and shared results. In the case of energy SF, failure to comply with the rules was observed. Smaller companies were ‘sponsored’ by a public company in the projects, with joint participation in a large number of projects, and in case of a new patent granted in a common project, this company did not share ownership results. Another large mixed-capital company did not share the ownership of patents obtained from the ISTs involved in the projects.
he analysis of the impacts of the number of projects and amount of funds allocated to the energy and biotechnology SFs could not be conducted with all data, as these data were available for only 16 of the sampled irms.
A total 440 projects with the allocation of approximately R$ 523 million to the energy SF and 126 projects with R$ 180 million allocated to the biotechnology SF were developed. Of these projects, irms participated in around 35%. It was observed that several projects and funds have not been used for innovation yet. Conversely, most of the inancial resources in the biotechnology and energy SFs were applied to the development of scientiic infrastructure in Brazil. his scenario is expected to improve in forthcoming years with the increase in the participation of irms in programs that incentivize innovation. On the other hand, of the total number of projects in which irms participated, only 53% in the biotechnology SF and 28% in the energy SF were taken on by publicly listed companies. herefore, the amount of data for the statistical model was substantially reduced, which prevented the achievement of results for the biotechnology SF and certainly produced a bias, probably minimizing the signiicance of the analysis for the energy SF as well.
For a country that wishes to participate actively in the attraction of foreign investments, the lack of data on innovation is still a major limitation and runs counter to the principle of transparency advocated by current management theories. hus, some choices made in the selection
of data further compromise the analysis of results and of the process and performance.
Despite the need to generate more quantitative analyses to improve the system, contributing to the coordination and expansion of public policies for S, T & I, it is argued that intangible impacts have gained more importance. hese, in turn, are very diicult to measure and quantify.
One should also note the amount of restriction on information from the SF database for S, T & I, particularly for undisclosed amounts, especially in the price charged from businesses, which eventually limits the analysis. he diiculty in accessing data for the study of public policy programs in Brazil is also emphasized. Despite improvements required by BOVESPA’s New Market; by new management practices, which adopted sustainability reporting by companies; the access to information act; and the requirements of the international capital market for approval of public program funding, access to information is still far from that observed in most developed and developing countries.
To conclude, recall that, in spite of all limitations, the goal of this study is to produce indicators and analyses of the NSI; in other words, to produce relative rather absolute arguments. his way, the aim is to produce knowledge and stimulate learning instead of absolute truths about facts.
Analyses of innovation networks financed by biotechnology and energy sector funds
actually stimulating debate and the organization of priority development ields and focus on action strategies that are too broad and difuse for the resources at hand.
nOtA
1 In the case of RAIS data, as data on speciic irms are needed but not disclosed by PINTEC, whose conidentiality is protected by Act no. 12.527/2011, which overrides the Access to Information Act, it was necessary to sign a speciic agreement to guarantee the conidentiality of participants and to comply with the law.
ReFeRenceS
Albuquerque, E., Suzigan, W., Kruss, G., & Lee, K. (2015). Developing national systens of innovation: University-industry interactions in the Global South. Cheltenham, Uk: Edward Elgar. Amato, J. N. (2000). Redes de cooperação produtiva e clusters regionais: Oportunidades para pequenas e médias empresas. São Paulo: Atlas.
Azzola, A., Landoni, P., & Looy, B. van (2010). Exploring indicators of Open Innovation: he role of co-patents. Book of Abstracts of the Eleventh International Conference on Science and Technology Indicators (pp. 25-27). Netherlands. Recuperado de http://www.cwts.nl/pdf/ BookofAbstracts2010_version_15072010.pdf
Balzat, M., & Hanusch, H. (2004). Recent trends in research on National Innovation Systems.
Journal of Evolutionary Economics, 14, 197-210. Borgatti, S. P. (2009). 2-mode concepts in social network analysis. Re c u p e r a d o d e h t t p : / / w w w. a n a l y t i c t e c h . c o m / b o r g a t t i / papers/2modeconcepts.pdf
Borgatti, S. P., & Halgin, D. S. (in press). Analyzing ailiation networks. In Carrington, P. & Scott, J. (Eds.), The Sage Handbook of Social Network Analysis. housand Oaks: Sage Publications.
Breschi, S., Lissoni, F., & Malerba, F. (2003). Knowledge networks from patent citations? Methodological issues and preliminary results.
DRUID Summer Conference, Copenhagen. Recuperado de http://www.druid.dk/conferences/ summer2003/papers/BRESCHI_MALERBA.pdf
Carpenter, M. A., Li, M., & Jiang, H. (2012). Social Network Research in Organizational Contexts: A Systematic Review of Methodological Issues and Choices. Journal of Management, 38(4), 1328-1361.
Chesbrough, H. W. (2006). Open innovation: A new paradigm for understanding industrial i n n ova t i o n . In H . W. C h e s b ro u g h , W. Vanhaverbeke, & J. West (Eds.), Open innovation: Researching a new paradigm (Chap. 1, pp. 1-12). New York: Oxford University Press.
Cooper, D. R., & Schindler, P. S. (2004). Métodos de pesquisa em administração (7a ed.). Porto Alegre: Bookman.
Cordeiro, P. (2010). Avaliação de conhecimentos explicitados em patentes para levantamento de indícios de possíveis parcerias empresariais (Dissertação de mestrado). Universidade Tecnológica Federal do Paraná Ponta Grossa, Ponta Grossa, PA, Brasil.
Coutinhio, P. L. A., & Bomtempo, J. V. (2010). Uso de roadmaps tecnológicos para favorecer o ambiente de inovação: Uma proposta em matérias primas renováveis. Anais do Simpoi, São Paulo, SP, Brasil, 13. Recuperado de http://www.simpoi. fgvsp.br/arquivo/2010/artigos/E2010_T00466_ PCN34815.pdf
Francini, W. S. (2012). Modelos de gestão da inovação: Um estudo de casos em empresas brasileiras do setor petroquímico (Tese de doutorado). Escola de Administração de Empresas, Fundação Getúlio Vargas, São Paulo, SP, Brasil. Recuperado de http://bibliotecadigital.fgv.br/dspace/bitstream/ handle/10438/9751/TESE%2007%2005%20 2012%20-%20William.Francini%20-%20 CDAE.pdf?sequence=1
Freeman, C. (2002). Continental, national a n d s u b - n a t i o n a l i n n ova t i o n s y s t e m s - complementarity and economic growth. Research Policy, 31(2), 191-211.
Friedkin, N. E. (1982). Information low through strong and weak ties in intraorganizational social networks. Social Networks, 3(4), 273-285. Ganem, C., & Santos, E. M. (2006). Brasil Inovador: O desaio empreendedor - 40 histórias de sucesso de empresas que investem em inovação. Brasília: IEL – NC. Recuperado de http:// www.inep.gov.br/dcom/brasilinovador.pdf
Goel, V. K., Korjunkin, E., Bhatia, M., & Agarwal, P. (2004) Innovation systems: World of Bank support science and technology development
[World Bank Working Paper, nº 32]. Washington, DC. Recuperado de https://openknowledge. worldbank.org/handle/10986/15026
Gulati, R. (1998). Alliances and networks.
Strategic Management Journal, 19, 293-317. Recuperado de http://scholar.googleusercontent. com/scholar?q=cache:HYoA1h1N3JcJ:scholar. google.com/&hl=pt-BR&as_sdt=0
Hagerdoon, J. & & Coodt, M. (2003, September). Measuring innovative performance: Is there an advantage in using multiple indicators? Research Policy, 32(8), 1365-1379. Recuperado de http:// www.sciencedirect.com/science/article/pii/ S0048733302001373
Hakansson, H., & Ford, D. (2002) How should companies interact in business networks? Journal of Business Research, 55(2), 133-139.
Hall, B. H., & Mairesse, M. (2009). Measuring corporate R&D returns. Recuperado de http:// www.eurosfaire.prd.fr/7pc/doc/1262622894_ kfg_report_no6.pdf
Instituto Brasileiro de Geograia e Estatística. (2015). PINTEC: Pesquisa de atividade tecnológica. Recuperado de www.ibge.gov.br.
Instituição de Pesquisa Econômica Aplicada. (2009). Guia das bases de dados para os FS. Brasília: Diretoria de Estudos Setoriais – IPEA.
Jackson, M. O., & Watts, A. (2002). he evolution of social and economic networks. Journal of Economic heory, 106(2), 265-295.
Kuppers, G., & Pyka, A. (2002). The self-organization of innovation networks: Introductory remarks in innovation networks - Theory and practice. Cheltenham: Edward Elgar.
Lecocq, C., & Looy, B. van (2009). he impact of collaboration on the technological performance of regions: time invariant or driven by life cycle dynamics? An explorative investigation of European regions in the ield of Biotechnology.
Scientometrics, 80(3), 847–867.
Lundvall, B. A. (2004). National innovation systems: Analytical concept and development tool. Paper presented at the DRUID Tenth Anniversary Summer Conference 2005, Copenhagen, Denmark, 10. Malerba, F. (2004). Sectoral systems of innovation: Concepts, issues and analysis of six major sectors in Europe. Cambridge: Cambridge University Press. Malhotra, N. K., Rocha, I., Laudisio, M. C., Altherman, E., & Borges, F. M. (2005).
Introdução à pesquisa de marketing (5a ed.). São Paulo: Pearson Prentice Hall.
Martins, G. A., & heophillo, C. R. (2007).
Metodologia da investigação cientíica para ciências sociais aplicadas. São Paulo: Atlas.
Analyses of innovation networks financed by biotechnology and energy sector funds
no Brasil (Nota Técnica IPEA). Recuperado de http://www.ipea.gov.br/sites/000/2/pdf/Nota_ Tecnica_julho20094.pdf
Organisation for Economic Co-operation and Development. (2011). Regions and innovation policy, OECD reviews on regional innovation. France: Autor.
Pitassi, C., & Bouzada, M. C. A. C. O. (2011). Uso da inovação aberta nas empresas brasileiras: Resultados de um levantamento de campo. Anais do Congresso Nacional de Administração e Ciências Contábeis – AdCont, Rio de Janeiro, RJ, Brasil, 2. Recuperado de http://www.facc.ufrj.br/ocs/index. php/adcont/adcont2011/paper/viewFile/280/24
Porto, G. S., & Bazzo, K. C. (2010). Redes de Cooperação Formadas a partir dos FS (Relatório Técnico/2010),Ribeirão Preto, SP, FEARP/USP, USP.
Ritter, T. (1999). The networking company: Antecedents for coping with relationships and networks efectively. Industrial Marketing Management, 28(5), 467-479.
Ryan N, B., & Gross, N. C. (1943). he difusion of hybrid seed corn in two Iowa communities.
Rural Sociology, 8(1), 15-24.
Schilling, M., & Phelps, C. C. (2007). Interirm collaboration networks: he impact of large-scale network structure on firm innovation.
Management Science, 53(7), 1113-1126.
Uzzi, B. (1996). he sources and consequences of embeddedness for economic performance of organizations: he network efect. American Sociological Review, 61(4), 674-698.
Valle, M. G., Bonacelli, M. B. M., & Salles, S. L. M., Fº.(2002).Os FS e a política nacional de ciência, tecnologia e inovação. Anais do Simpósio de Gestão da Inovação Tecnológica, Salvador, BA, Brasil, 22.
Vanhaverbeke, W., Vrande, V. van, & Chesbrough, H. (2008). Understanding the advantages of open innovation practices in corporate venturing in terms of real options. Creativity and Innovation Management, 17(4), 251-258.