Genome Scan for Selection in Structured
Layer Chicken Populations Exploiting Linkage
Disequilibrium Information
Mahmood Gholami1*, Christian Reimer1, Malena Erbe1, Rudolf Preisinger2, Annett Weigend3, Steffen Weigend3, Bertrand Servin4, Henner Simianer1
1Animal Breeding and Genetics Group, Department of Animal Sciences, Georg-August-University Göttingen, Göttingen, Germany,2LOHMANN Tierzucht GMBH, Cuxhaven, Germany,3Institute of Farm Animal Genetics (ING), Friedrich-Loeffler-Institut (FLI), Neustadt, Germany,4Laboratoire Génétique, Physiologie et Systèmes d’Elevage, Institut National de la Recherche Agronomique, Castanet-Tolosan,
France
Abstract
An increasing interest is being placed in the detection of genes, or genomic regions, that have been targeted by selection because identifying signatures of selection can lead to a better understanding of genotype-phenotype relationships. A common strategy for the detection of selection signatures is to compare samples from distinct populations and to search for genomic regions with outstanding genetic differentiation. The aim of this study was to detect selective signatures in layer chicken populations using a recently proposed approach, hapFLK, which exploits linkage disequilibrium information while accounting appropriately for the hierarchical structure of populations. We performed the analysis on 70 individuals from three commercial layer breeds (White Leghorn, White Rock and Rhode Island Red), genotyped for approximately 1 million SNPs. We found a total of 41 and 107 regions with outstanding differentiation or similarity using hapFLK and its single SNP coun-terpart FLK respectively. Annotation of selection signature regions revealed various genes and QTL corresponding to productions traits, for which layer breeds were selected. A num-ber of the detected genes were associated with growth and carcass traits, includingIGF-1R, AGRPandSTAT5B. We also annotated an interesting gene associated with the dark brown
feather color mutational phenotype in chickens (SOX10). We compared FST, FLK and
hapFLK and demonstrated that exploiting linkage disequilibrium information and accounting for hierarchical population structure decreased the false detection rate.
Introduction
A local reduction of genetic variation up- and downstream of the beneficial mutation is caused by the rapid fixation of a beneficial mutation, leaving special patterns of DNA behind, which is commonly referred to as a“selective sweep”[1]. The study of such signatures of selection can OPEN ACCESS
Citation:Gholami M, Reimer C, Erbe M, Preisinger R, Weigend A, Weigend S, et al. (2015) Genome Scan for Selection in Structured Layer Chicken Populations Exploiting Linkage Disequilibrium Information. PLoS ONE 10(7): e0130497. doi:10.1371/journal.pone.0130497
Editor:Yongchang Cao, Sun Yat-sen University, CHINA
Received:July 30, 2014
Accepted:May 20, 2015
Published:July 7, 2015
Copyright:© 2015 Gholami et al. This is an open access article distributed under the terms of the Creative Commons Attribution License, which permits unrestricted use, distribution, and reproduction in any medium, provided the original author and source are credited.
Data Availability Statement:All relevant data are within the paper and its Supporting Information files.
Funding:This research was funded by the German
Federal Ministry of Education and Research within the AgroClustEr "Synbreed–Synergistic plant and
animal breeding" (Funding ID: 0315528C). We acknowledge support by the German Research Foundation and the Open Access Publication Funds of the Göttingen University.
provide valuable insights into genomic regions harboring interesting genes that are or have been under selective pressure and hence can help to understand the mechanisms that led to the differentiation of various genotypes and their influenced phenotypes during selection.
Recently, an increasing interest has been placed in the detection of genes, or genomic regions, that are targeted by selection [2], permitted by the availability of large-scale SNP datasets that allow to scan the genome for positions that may have been targets of recent selection [3].
Many different methods are available for detecting selective sweeps from DNA sequence data. Qanbariet al. (2014) [4] classified these methods in two main groups: intra-population statistics (e.g. Kim and Nielsen (2004) [5] and Sabetiet al. (2002) [3]) and inter-populations statistics (e.g. Lewontin and Krakauer (1973) [6] and Beaumont and Balding (2004) [7]). Innan and Kim (2008) [8] and Yiet al. (2010) [9] showed that between recently diverged populations, inter-populations statistics have more statistical power for the detection of selection signatures. These methods are particularly suited for studying species that are structured in well-defined populations, which is the case in many domesticated species.
Inter-populations statistics can be divided into two groups based on single site or haplotype differentiation analyses [4]. The most widely used single site differentiation statistic is Wright’s fixation index, FST[10]. A major concern with Wright’s FSTis that it implicitly assumes that populations have the same effective size (Ne) and to be derived independently from an ancestral
population. When this is not true FSTwill produce false positive signals, similar to the well-known effects of cryptic structure in genome-wide association studies [11]. Bonhommeet al. (2010) [12] proposed a new statistic, termed FLK, that deals withNevariation and historical
branching of populations by incorporating a population kinship matrix into the Lewontin and Krakauer (LK) [6] statistic and showed that FLK is indeed more powerful than FSTfor a given false positive rate.
Another group of methods builds on the fact that haplotype diversity and linkage disequilib-rium (LD) patterns contain useful information for the detection of selection signatures [13] and therefore, usage of haplotype or LD based differentiation analyses has its own advantages. Browning and Weir (2010) [14] showed that SNP ascertainment bias has less impact on haplo-type based differentiation analyses compared to single site differentiation. A major challenge regarding the haplotype differentiation scans is that it does not account for the possibility of hierarchical structure between populations. Therefore Farielloet al. (2013) [15] proposed the hapFLK statistic which is a haplotype based extension of the FLK statistic that accounts for both hierarchical structure and haplotype information. They showed that using haplotype information to detect selection in FST-like approaches greatly increases the detection power. Specifically, they demonstrated that the hapFLK statistic has more power in detecting soft sweeps, incomplete sweeps and sweeps occurring in several populations.
The chicken is an excellent model for studying the signatures of selection under artificial breeding conditions due to growing genomic resources, the relatively rapid reproduction time and the existence of several inbred lines together with strong agricultural interest [16]. Several studies have investigated selection signatures in chicken either using sequence data or genotype data from low to medium density SNP chips. Rubinet al. (2010) [17] studied the signatures of domestication and selective sweeps using the“Pooled Heterozygosity”(HP) statistic in various commercial broiler and layer lines. Johanssonet al. (2010) [18] explored the genomes of two lines of chickens subjected to 50 generations of divergent selection using a 60k SNP assay. Qan-bariet al. (2012) [19] applied a modified sliding window, called“creeping window”, of HP mea-sures in pooled sequence data in laying chickens. In an earlier work we [20] studied the signatures of selection by FSTin seven commercial breeds using approximately one million SNPs which, however, ignored the hierarchical structure of the populations analyzed. Recent divergence of certain commercial breeds [21] and the introduction of strong selection for
production traits (in the 20th century) [22] fosters the interest in detecting selective sweeps in chicken using statistical methods that account for the strong hierarchical structure between these populations. Therefore, this dataset offers an interesting opportunity to evaluate methods that account for population structure in a setting characterized by a strong past selection pres-sure, high genetic drift and clear population structure, which has never been done before.
In this study, FLK [12] and hapFLK [15] statistics were applied on the same data as in our previous study on selection signatures in commercial chicken [20], allowing a comparison between FST, FLK and hapFLK. In contrast to our previous work, the approaches used in the current study have the potential to identify genomic regions which have been selected more recently (e.g. soft sweeps) and are associated with specific layer traits.
Materials and Methods
Animals, Data collection and filtering
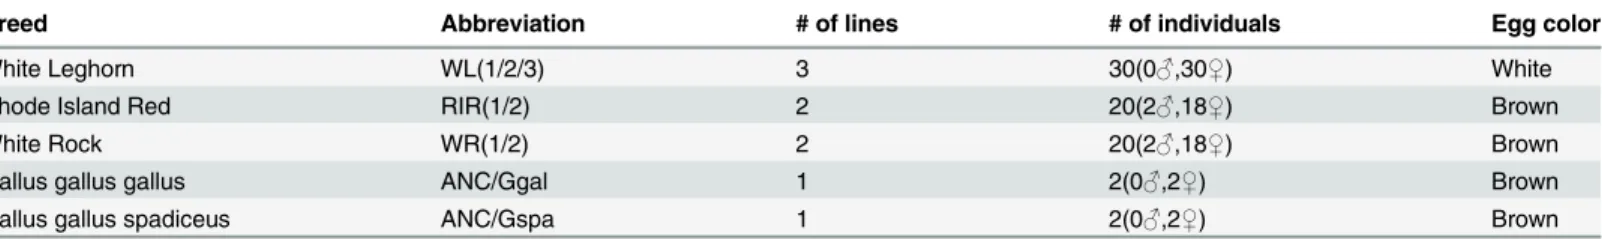
Two sets of samples—commercial egg layers and wild chicken (coded respectively LAY and ANC)—were used in this study. The commercial individuals from Lohmann Tierzucht GmbH originated from three different breeds. One commercial white egg layer breed based on White Leghorn (WL), with three separate lines, and the other two brown egg layer breeds based on White Rock (WR) and Rhode Island Red (RIR), respectively, each with two separate lines per breed. In each of these seven lines, ten individuals were sampled and genotyped. The wild chickens, comprising Red Jungle fowl (Cochin-Chinese) (G.g.gallus) and Red Jungle fowl (Burmese) (G.g.spadiceus) were sampled within the AVIANDIV project. A more detailed list of breeds is presented inTable 1. The ANC group consisted of two subspecies ofGallus gallus that are believed to stem in straight line from wild ancestors of domestic chickens. Data is pub-licly available (S1 Dataset).
Genotyping was done with three Affymetrix 600K SNP arrays. Overlapping SNPs between the three 600K SNP arrays were removed by the data provider and a total of 1,139,073 SNPs remained. For this study we included only the SNPs that were located on autosomal chromo-somes (1–28), SNPs that were located on sex chromosomes and linkage groups were removed (62,337 were removed). SNPs with at least one missing value and SNPs with minor allele fre-quencies lower than 5% (172,344 SNPs) were removed in order to avoid dealing with genotyp-ing errors; this approach was suggested by the data provider. A total of 904,392 SNPs remained after filtering. The entire filtering process was done using the PLINK software (http://pngu. mgh.harvard.edu/purcell/plink/) [23].
Population structure analysis
Using Reynolds’genetic distances [24], a phylogenetic tree was constructed to retrieve the structure of the studied samples.
FLK and hapFLK calculation
which indicated that 5 or 10 haplotype clusters were adequate. We found that using either 5 or 10 haplotype clusters gave nearly identical results and therefore present those obtained assum-ing 5 haplotype clusters.
Assigning signatures of selection to specific population groups
When using differentiation-based approaches, it is sometimes difficult to pinpoint the popula-tion(s) that have been the target of selection. Farielloet al. (2013) [15] proposed to decompose the hapFLK statistic by projecting it on principal components (PC) of the population kinship matrix to identify which part of the population tree exhibits an outlying differentiation in a particular genomic region. Here, we employed this approach to look for selection signatures that affected either (i) the whole population set (LAY), (ii) white layer populations or (iii) brown layer populations. For (i) we used the hapFLK statistic, for (ii) and (iii) we considered the projection of the statistic on the subtree corresponding to white (resp. brown) layer popula-tions. In each case we considered that a position lying in the top and bottom 0.05% of the empirical distribution was potentially within a selection signature.
For each selection signature, we then re-estimated the branch lengths of the population tree, using local allele or haplotype clusters frequencies (see Farielloet al. (2013) [15] for details) and identified the branch lengths that seem significantly larger than the branches of whole genome tree to pinpoint selected populations.
Fitting of gamma distribution
As hapFLK statistic does not follow a known distribution under neutrality, the null distribution has to be estimated from the data. As hapFLK is similar to FLK, a good approximation to the asymptotic distribution of hapFLK comes from the gamma distribution family. To estimate p-values of selection signatures, we fitted a gamma distribution to the hapFLK observed distribu-tion, using the minimum distance estimation method [26,27] which is robust to outliers, which helps to reduce the influence of selection signatures in estimating the null distribution. This was done for false detection rate (FDR) estimation.
Annotation
As explained above, regions with extreme FLK and hapFLK values were considered as candi-dates for selective sweeps. For all the three groups (all layers, white layers and brown layers) the extreme values (the upper and lower 0.05%) that were within 500 kb of each other were grouped together. For all joined groups gene annotations, QTL annotations and pathway anno-tations were completed. Gene annoanno-tations were done with the biomaRt R package [28] based on the Ensembl database [29] of Gallus_gallus-4.0 assembly. Animal QTL database [30] was used for QTL annotation, KEGG database for pathway annotation [31] and Gene Ontology (GO) database for GO annotation [32]. Gene enrichment analysis was done with Fisher’s exact
Table 1. Name, abbreviation, number of individuals and the egg color for each breed used in this study.
Breed Abbreviation # of lines # of individuals Egg color
White Leghorn WL(1/2/3) 3 30(0♂,30♀) White
Rhode Island Red RIR(1/2) 2 20(2♂,18♀) Brown
White Rock WR(1/2) 2 20(2♂,18♀) Brown
Gallus gallus gallus ANC/Ggal 1 2(0♂,2♀) Brown
Gallus gallus spadiceus ANC/Gspa 1 2(0♂,2♀) Brown
test [33] for all annotated genes in all groups (all layers, white layers and brown layers) sepa-rately. Pathways and gene ontologies with p0.05 were identified as being under selection.
Results
Population structure
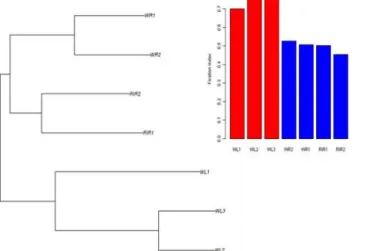
A phylogenetic tree based on Reynolds’genetic distances with 100,000 randomly selected SNPs (100 replications) was constructed and is shown inFig 1. AsFig 1shows, commercial white egg-layer breeds were separated from brown egg-layers and grouped in one sub-tree. In the sub-trees, the two white-layer lines WL2 and WL3 as well as the two brown-layer lines WR1 and WR2 form a separate sub-cluster, respectively. The population specific fixation indices of all populations, also shown inFig 1, are extremely high (ranging from 0.45 to 0.75), reflecting the very strong effect of genetic drift in these populations, with the three White Leghorn popu-lations notably more inbred than the Brown layer popupopu-lations.
FLK
Based on the FLK values distribution, a total of 107 regions (63 in all layers, 27 in white layers and 17 in brown layers) were detected as signatures of selection (S1 Table). All these regions were in the upper 0.05% of the distribution which is representative of regions with fixed differ-ence between populations. The genome-wide distribution of FLK values obtained from each group—all, white and brown—are depicted inFig 2A, 2B and 2C, respectively. Annotation was carried out for all regions with extreme FLK values, i.e. potential selection signatures. The lists of genes in selective sweeps detected with FLK are available in the supplementary tables (S2,S3 andS4Tables). The annotation list is enriched with genes of biological interest involved in var-ious pathways such as ATP metabolic process (P = 0.023), metal ion binding (P = 0.001), nucleic acid binding (P = 0.008) and metabolic pathways (P<0.001), all of which can be related
to production traits under selection in layers. The lists of pathways and gene ontologies under selection are available in supplementary tables (S5,S6andS7Tables). We identified three candidate genes which can be related to the breeding goals of chickens.H3F3CandAGRP which are associated with body growth and body weight [34,35], andIL19which is associated to the immune system in chicken [36]. More details about gene locations and study groups are
Fig 1. Reynolds’genetic distances population tree of seven commercial breeds and histogram of fixation index for each line.
available inTable 2. We also detected several QTL overlapping selection signatures for traits such as breast muscle weight, abdominal fat weight and liver weight, which all are related to the breeding goals of chickens (Table 3).
hapFLK
Based on the hapFLK values distribution, a total of 41 regions (17 in all layers, 12 in white lay-ers and 12 in brown laylay-ers) were detected as selection signatures (S8 Table). All these regions were in either the upper or the lower 0.05% of the distribution, which represent regions with a fixed difference or fixed similarity between populations, respectively. The genome-wide distri-bution of hapFLK values with 5 haplotype clusters obtained for each group—all, white and brown—are depicted inFig 3A, 3B and 3C, respectively. Annotation was carried out for all regions with extreme hapFLK values, i.e. potential selective sweeps. The lists of genes for selec-tive sweeps detected with hapFLK are available in the supplementary tables (S9,S10andS11 Tables). The annotation list is enriched with genes of biological interest involved in various pathways such as nerve development (p = 0.027), growth factor receptor (p = 0.008), RNA met-abolic process (p = 0.042) and skeletal muscle cell differentiation (p = 0.032), all of which could be related to production traits indirectly. The lists of pathways and gene ontologies under which were detected under selection in this study are available in the supplementary tables (S12,S13andS14Tables). We identified four genes that were related to the breeding goals of chickens with the hapFLK method.IGF-1RandSTAT5Bare associated with growth and car-cass traits [37,38].BPIFB8andSOX10, which are associated with egg natural defense [39] and dark brown mutational phenotype [40] respectively (more details is available inTable 2). Sev-eral QTL, which were related to the breeding goals of egg-layer chickens were detected as well,
Fig 2. Manhattan plot of FLK analysis over the entire genome.Blue line indicates the upper 0.05% of FLK distribution, for (A) within all breeds, (B) within white breeds, and, (C) within brown breeds.
doi:10.1371/journal.pone.0130497.g002
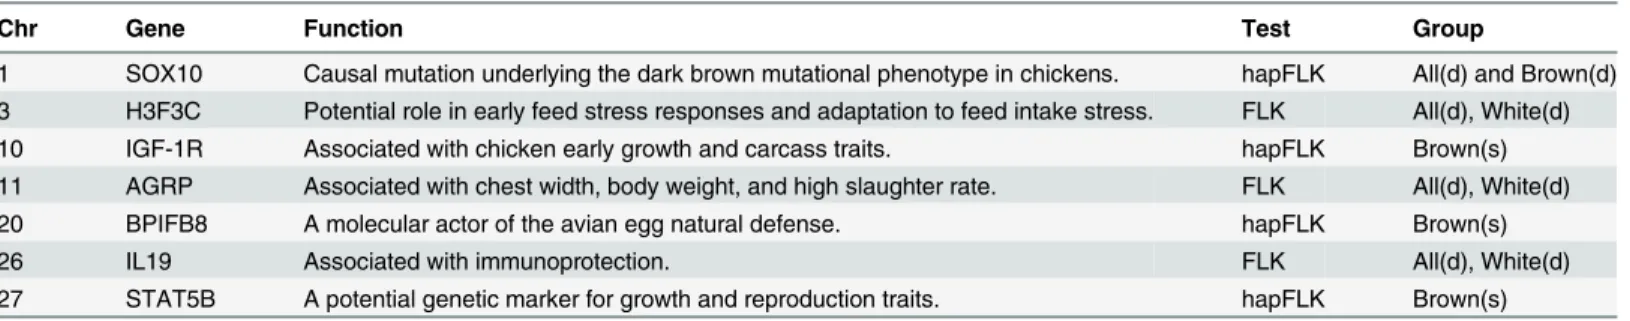
Table 2. Genes associated with productive traits in FLK and hapFLK analysis in all three studies.‘All’,‘White’, and‘Brown’stand for inclusion of all the commercial breeds, analysis within white layers and analysis within brown layers, respectively.‘s’stands for similarity and‘d’for difference.
Chr Gene Function Test Group
1 SOX10 Causal mutation underlying the dark brown mutational phenotype in chickens. hapFLK All(d) and Brown(d) 3 H3F3C Potential role in early feed stress responses and adaptation to feed intake stress. FLK All(d), White(d)
10 IGF-1R Associated with chicken early growth and carcass traits. hapFLK Brown(s)
11 AGRP Associated with chest width, body weight, and high slaughter rate. FLK All(d), White(d)
20 BPIFB8 A molecular actor of the avian egg natural defense. hapFLK Brown(s)
26 IL19 Associated with immunoprotection. FLK All(d), White(d)
27 STAT5B A potential genetic marker for growth and reproduction traits. hapFLK Brown(s)
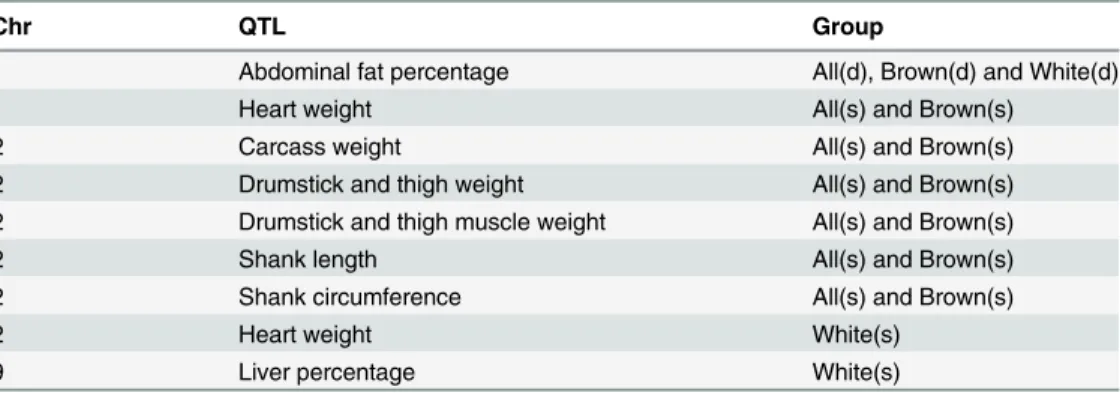
for traits such as drumstick and thigh morphology, carcass weight and shank length. A com-plete list of all QTL with more details is available inTable 4.
Discussion
Structure analysis and P
0comparison
Our population structure analyses are largely in agreement with the expected historical origin of the breeds [21] and as expected, they are also similar to the previous study using the same data [20].
One of the issues in the FLK and hapFLK analysis in this study is using only 4 wild chickens for development of the population's kinship matrix. We assessed whether using a different set of outgroup individuals could possibly change our findings by verifying the influence of the outgroup set on the estimation of the ancestral allele frequency (p0). p0can be seen as a nui-sance parameter in the model that has to be estimated from the data through the kinship matrix. We studied the possible impact of the number of wild chickens used by comparing p0 when being calculated from 4 wild chickens (our ANC group) vs. 40 wild chickens (consisted of 20Gallus gallus gallusand 20Gallus gallus spadiceuswhich were genotyped with Axiom Genome-Wide Chicken Genotyping Array of Affymetrix and were available only for this com-parison). p0was calculated for each group (ANC group and 40 wild chickens) for every SNP on the 600K SNP chip. Pairwise comparison of each group’s p0values along the genome gave an average correlation of 0.95. This high correlation suggests that there is no vital difference in development of population's kinship matrix with 4 or 40 wild chickens. Therefore the kinship matrix calculated based on four wild chickens, which had been genotyped for the complete set
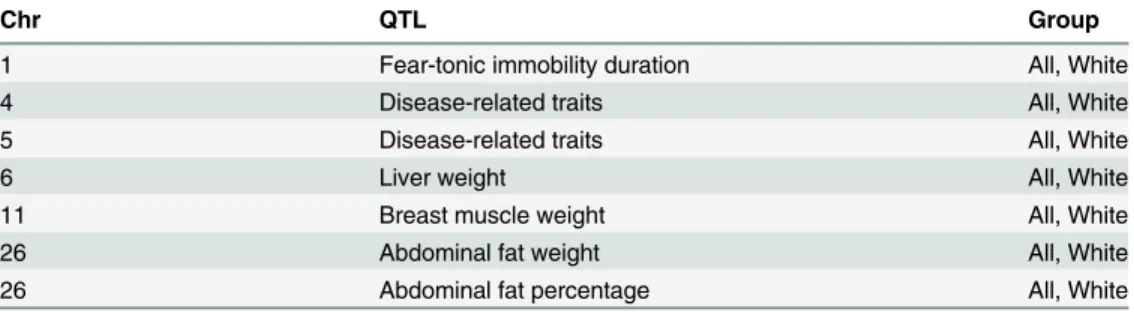
Table 3. QTL associated with productive traits in FLK analysis in all three studies.‘All’stands for inclusion of all commercial breeds, and‘White’for analysis within white layers.
Chr QTL Group
1 Fear-tonic immobility duration All, White
4 Disease-related traits All, White
5 Disease-related traits All, White
6 Liver weight All, White
11 Breast muscle weight All, White
26 Abdominal fat weight All, White
26 Abdominal fat percentage All, White
doi:10.1371/journal.pone.0130497.t003
Fig 3. Manhattan plot of hapFLK analysis over the entire genome with 5 clusters.Blue (red) line indicates the upper (lower) 0.05% of hapFLK distribution, for, (A) within all breeds, (B) within white breeds, and, (C) Within brown breeds.
of close to one million SNPs was considered sufficient. A histogram of the differences in p0 esti-mated with the two outgroup sets is shown inS1 Fig, showing that more than 90% of the differ-ences are less than ± 0.02.
Fitting of gamma distribution
Although the outlier approach is an effective and widely used method for identification of genes under selection lacking known phenotypes [41], an outlier signal is not necessarily syn-onymous with regions being under selection [42]. Therefore we fitted a gamma distribution to the hapFLK in order to estimate the false discovery rate (FDR). This approach suggested an FDR of 10–20% in our analysis.
F
ST, FLK and hapFLK
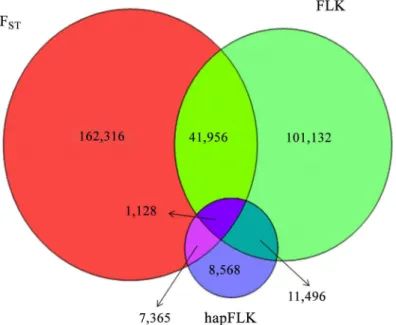
An overlap exists between the regions that have been determined as regions under selection in a previous study with FST[20] and the current analysis of FLK and hapFLK as shown by the Venn diagram for the number of SNPs identified as being under selection with either of the methods shown inFig 4. Using the same threshold as in our previous work [20] (upper and lower 1%) resulted in detection of a lower number of selection signatures with FLK (73.2%) and much lower with hapFLK (13.4%) compared to the FSTbased results reported in our earlier study on the same data (list of regions detected with FSTmethod is available inS15 Table) [20]. A finding suggested that ten-thousands of polymorphisms respond to selection, which was the case in our earlier work [20], does not appear realistic [43]. Many of the outliers detected with FSTmust be considered as false positives, which might be partly due to the fact that the method assumes populations to have the same effective size and to have emerged independently from the same ancestral population. Therefore we used a much stricter threshold (upper and lower 0.05%) in the study presented here than in our previous work (upper and lower 1%) [20]. Accordingly, the use of a stricter threshold and the application of methods that account for dif-ferent effective population sizes and hierarchical phylogenies (FLK and hapFLK), resulted in the detection of much lower number of selection signatures. There is also an overlap between regions detected by hapFLK and FLK (44.2%) which is due to the use of same statistic in both methods. The difference between regions detected by FLK and hapFLK can be due to the fact that haplotype and SNPs harbor different information.
As an example, inFig 5Awe demonstrate allele frequencies at SNP positions around the TGFB2gene (Chr3: 18,690,003–18,753,123) which was detected as a gene under selection by
Table 4. QTL associated with productive traits in hapFLK analysis in all three studies.‘All’,‘White’, and‘Brown’, stand for inclusion of all the commercial breeds, analysis within white layers and analy-sis within brown layers, respectively.‘s’stands for similarity and‘d’for difference.
Chr QTL Group
1 Abdominal fat percentage All(d), Brown(d) and White(d)
1 Heart weight All(s) and Brown(s)
2 Carcass weight All(s) and Brown(s)
2 Drumstick and thigh weight All(s) and Brown(s)
2 Drumstick and thigh muscle weight All(s) and Brown(s)
2 Shank length All(s) and Brown(s)
2 Shank circumference All(s) and Brown(s)
2 Heart weight White(s)
9 Liver percentage White(s)
FST[20] due to a reduction of diversity within the WL breed. However, since this reduction exists only within the WL breed this can also be explained by drift alone. By taking the popula-tion tree into considerapopula-tion, FLK does not detect any signals in this region. Another example is
Fig 5. Allele frequency in different breeds for 2 Mbp around the intended region.Red box indicates, for (A)TGFB2gene (Chr3: 18,690,003–
18,753,123), (B)H3F3Cgene (Chr3: 16,483,162–16,487,393) and (C) 60Kb region on chromosome 10 (6,799,776–6,738,610).
doi:10.1371/journal.pone.0130497.g005
Fig 4. Venn diagram of overlapping SNPs identified as under selection, with FST, FLK and hapFLK methods using same threshold (upper and lower 1%).
the region around theH3F3Cgene (Chr3: 16,483,162–16,487,393) which was detected to be under selection by FLK. Allele frequencies around this region shows that a huge diversity exists between some breeds (Fig 5B). We detect an outlier with FLK in particular because WR1 and WR2 show very different patterns of allele frequencies in this region although they are closely related in the population tree. However FSTwas not able to detect any signal here, since FST treats each population as an independent evidence for sweep detection and does not consider the huge difference between WL, RIR and WR breeds. There are as well cases in which all three methods (FST, FLK and hapFLK) were able to detect the region under selection. An example is a 60Kb region on chromosome 10 (6,799,776–6,738,610).Fig 5Cshows allele frequencies around this region.
A complete hard sweep is expected to be large [44], while a soft sweep is more likely to have smaller size [45]. In the current study we detected smaller sweeps (bp length) compared to our FSTstudy, which may be due to the fact that hapFLK has greater power in detection of soft sweeps. Nevertheless we should as well take into account the false positive rate of our FST study. A boxplot of sweep size with FSTand hapFLK method is shown inS2 Fig.
A vast majority of differentiated polymorphisms in our data set could be caused by genetic drift. Genetic drift is high when the (effective) population size is small [46] which is the case in commercial laying breeds [47]. Since regions differentiated by selection and regions differenti-ated by drift alone may overlap, there is a lack of power in our analysis. This could be solved by using a larger number of populations to minimize the risk that a systematic pattern of differen-tiation in many breeds (say, several white layers vs. several brown layers) is created at random by drift alone. Other obstacles in this study are the use of only 10 animals per sample and filter-ing for minor allele frequencies; these two issues might have an effect on the estimation of allele frequencies, comparison of rarer alleles and identification of all haplotypes. In a recent simula-tion study [48] it was shown that the power of most selection signature tests is more dependent on marker density than on sample size, and that with a marker density similar to the one used in the present study a high power and positional resolution was achieved with 15 sampled indi-viduals per population. We detected several genes related to the breeding goals of egg-layer chickens, such as low body weight, high reproduction performance and good feed conversion [49], both with FLK and hapFLK. For instance, with the FLK method we detected several QTL associated to disease-related traits and breast muscle weight, as well asAGRP(agouti related protein homolog), which is associated with breast muscle water loss rate, chest width, body weight, slaughter rate and semi-evisceration weight [35].
In the hapFLK analysis, we also detected several genes, which are associated with growth and carcass traits, such asIGF-1RandSTAT5B.STAT5B(signal transducer and activator of transcription 5B) is associated with growth and reproduction traits [38].IGF-1R(insulin-like growth factor 1) is similar toIGF2[50], which was detected in our previous work [20].IGF-1R is associated with chicken early growth and carcass traits [37]. We additionally detected several QTL associated to carcass weight, drumstick weight and shank length. QTL associated with meat production, as well as bothIGF-1RandSTAT5B, were located in regions that were similar between brown layers. Supporting results were found in our previous study [20], where we detected genes associated to meat quality and production in brown layers, which reflects the fact that brown egg-layers were originally a dual-purpose breed [21].
SOX10was detected in regions that were different between brown layers. Re-estimation of the local tree using haplotype clusters frequencies (Fig 6A) and haplotype frequencies (Fig 6B) for the region surroundingSOX10revealed selection in the RIR breeds in this region. RIR is the only breed with dark brown feather in our data set [51], which is in great agreement with our selection signature detection.
Conclusions
In conclusion we were able to identify several putative selection signature regions with genes corresponding to the traits associated to growth and reproduction traits. Some of these anno-tated genes were similar (or had similar functions) to our findings in our previous work [20]. However, several of the detected regions were not associated with any genes related to produc-tion traits, which could be due to insufficient knowledge about these regions [52]. We did not identify selection signatures that were reported in other studies on chicken [17,53] which could be due to lack of diversity in our data compared to their data set. By detection ofSOX10as a gene under selection, we demonstrated that the use of haplotype frequencies and consideration of hierarchical structure can improve the power of detection of soft sweep in our data set.
Supporting Information
S1 Fig. Histogram of p0difference between the calculation with 4 wild chickens (ANC group) and 40 wild chickens.
(TIFF)
S2 Fig. Boxplot of sweep size with FSTand hapFLK method. (TIFF)
Fig 6. (A) Re-estimation of local tree using haplotype clusters frequencies for surrounding region ofSOX10gene.(B) Haplotype frequencies for the surrounding region ofSOX10gene (50.8 Mbp).
S1 Table. Regions detected as putative selective sweeps detected with FLK with upper 0.05% threshold.All, White and Brown stands for studies with all layers, within white layers and within brown layers, respectively.
(PDF)
S2 Table. List of genes for selective sweeps detected with FLK with 0.05% threshold in all layers.
(PDF)
S3 Table. List of genes for selective sweeps detected with FLK with 0.05% threshold in white layers.
(PDF)
S4 Table. List of genes for selective sweeps detected with FLK with 0.05% threshold in brown layers.
(PDF)
S5 Table. Lists of pathways and gene ontologies under selection with FLK with 0.05% threshold in all layers.
(PDF)
S6 Table. Lists of pathways and gene ontologies under selection with FLK with 0.05% threshold in white layers.
(PDF)
S7 Table. Lists of pathways and gene ontologies under selection with FLK with 0.05% threshold in brown layers.
(PDF)
S8 Table. Regions detected as putative selective sweeps detected with hapFLK with upper (U) and lower (L) 0.05% threshold.All, White and Brown stands for studies with all layers, within white layers and within brown layers, respectively.
(PDF)
S9 Table. List of genes for selective sweeps detected with hapFLK with 0.05% threshold in all layers.
(PDF)
S10 Table. List of genes for selective sweeps detected with hapFLK with 0.05% threshold in white layers.
(PDF)
S11 Table. List of genes for selective sweeps detected with hapFLK with 0.05% threshold in brown layers.
(PDF)
S12 Table. Lists of pathways and gene ontologies under selection with hapFLK with 0.05% threshold in all layers.
(PDF)
S13 Table. Lists of pathways and gene ontologies under selection with hapFLK with 0.05% threshold in white layers.
S14 Table. Lists of pathways and gene ontologies under selection with hapFLK with 0.05% threshold in brown layers.
(PDF)
S15 Table. Regions detected as putative selective sweeps detected with FSTwith upper (U) and lower (L) 1% threshold.LG stands for studies between commercial-layers and non-com-mercial chickens and BW stands for studies between brown and white layers, respectively. (PDF)
S1 Dataset. Compress file of genotyped data in plink format. (RAR)
Acknowledgments
This research was funded by the German Federal Ministry of Education and Research within the AgroClustEr "Synbreed–Synergistic plant and animal breeding" (Funding ID: 0315528C). The funders had no role in study design, data collection and analysis, decision to publish, or preparation of the manuscript. Dr. Preisinger is the head of Genetic department of LOH-MANN Tierzucht GmbH. This does not alter our adherence to all the PLOS ONE policies on sharing data and materials. We acknowledge support by the German Research Foundation and the Open Access Publication Funds of the Göttingen University.
Author Contributions
Conceived and designed the experiments: MG BS HS. Performed the experiments: MG BS. Analyzed the data: MG BS RP AW. Contributed reagents/materials/analysis tools: MG CR BS. Wrote the paper: MG CR ME SW BS HS. Contributed in data providing: RP AW. Collection and preparation of the data (Blood sample, DNA extraction and Genotyping) for the analysis: RP AW.
References
1. Kaplan NL, Hudson RR, Langley CH (1989) The“hitchhiking effect”revisited. Genetics 123: 887–899. PMID:2612899
2. Nielsen R (2005) Molecular Signatures of Natural Selection. Annu Rev Genet 39: 197–218. doi:10. 1146/annurev.genet.39.073003.112420PMID:16285858
3. Sabeti PC, Reich DE, Higgins JM, Levine HZP, Richter DJ, Schaffner SF, et al. (2002) Detecting recent positive selection in the human genome from haplotype structure. Nature 419: 832–837. doi:10.1038/ nature01140PMID:12397357
4. Qanbari S, Simianer H (n.d.) Mapping signatures of positive selection in the genome of livestock. Livest Sci. Available:http://www.sciencedirect.com/science/article/pii/S187114131400239X. Accessed: 18 June 2014.
5. Kim Y, Nielsen R (2004) Linkage Disequilibrium as a Signature of Selective Sweeps. Genetics 167: 1513–1524. doi:10.1534/genetics.103.025387PMID:15280259
6. Lewontin RC, Krakauer J (1973) Distribution of Gene Frequency as a Test of the Theory of the Selec-tive Neutrality of Polymorphisms. Genetics 74: 175–195. PMID:4711903
7. Beaumont MA, Balding DJ (2004) Identifying adaptive genetic divergence among populations from genome scans. Mol Ecol 13: 969–980. PMID:15012769
8. Innan H, Kim Y (2008) Detecting Local Adaptation Using the Joint Sampling of Polymorphism Data in the Parental and Derived Populations. Genetics 179: 1713–1720. doi:10.1534/genetics.108.086835 PMID:18562650
10. Wright S (1949) The Genetical Structure of Populations. Ann Eugen 15: 323–354. doi: 10.1111/j.1469-1809.1949.tb02451.x
11. Price AL, Zaitlen NA, Reich D, Patterson N (2010) New approaches to population stratification in genome-wide association studies. Nat Rev Genet 11: 459–463. doi:10.1038/nrg2813PMID: 20548291
12. Bonhomme M, Chevalet C, Servin B, Boitard S, Abdallah J, Blott S, et al. (2010) Detecting Selection in Population Trees: The Lewontin and Krakauer Test Extended. Genetics 186: 241–262. doi:10.1534/ genetics.110.117275PMID:20855576
13. Sabeti PC, Varilly P, Fry B, Lohmueller J, Hostetter E, Cotsapas C, et al. (2007) Genome-wide detec-tion and characterizadetec-tion of positive selecdetec-tion in human populadetec-tions. Nature 449: 913–918. doi:10. 1038/nature06250PMID:17943131
14. Browning SR, Weir BS (2010) Population Structure With Localized Haplotype Clusters. Genetics 185: 1337–1344. doi:10.1534/genetics.110.116681PMID:20457877
15. Fariello MI, Boitard S, Naya H, SanCristobal M, Servin B (2013) Detecting signatures of selection through haplotype differentiation among hierarchically structured populations. Genetics 193: 929–941. doi:10.1534/genetics.112.147231PMID:23307896
16. Brown WRA, Hubbard SJ, Tickle C, Wilson SA (2003) The chicken as a model for large-scale analysis of vertebrate gene function. Nat Rev Genet 4: 87–98. doi:10.1038/nrg998PMID:12560806
17. Rubin CJ, Zody MC, Eriksson J, Meadows JR, Sherwood E, Webster MT, et al. (2010) Whole-genome resequencing reveals loci under selection during chicken domestication. Nature 464: 587–591. doi:10. 1038/nature08832PMID:20220755
18. Johansson AM, Pettersson ME, Siegel PB, Carlborg Ö (2010) Genome-Wide Effects of Long-Term Divergent Selection. PLoS Genet 6: e1001188. doi:10.1371/journal.pgen.1001188PMID:21079680 19. Qanbari S, Strom TM, Haberer G, Weigend S, Gheyas AA, Turner F, et al. (2012) A High Resolution
Genome-Wide Scan for Significant Selective Sweeps: An Application to Pooled Sequence Data in Lay-ing Chickens. PLoS ONE 7: e49525. doi:10.1371/journal.pone.0049525PMID:23209582
20. Gholami M, Erbe M, Gärke C, Preisinger R, Weigend A, Weigend S, et al. (2014) Population Genomic Analyses Based on 1 Million SNPs in Commercial Egg Layers. PLoS ONE 9: e94509. doi:10.1371/ journal.pone.0094509PMID:24739889
21. Crawford R (1990) poultry breeding and genetics. Elsevier science.
22. Burt DW (2005) Chicken genome: Current status and future opportunities. Genome Res 15: 1692– 1698. doi:10.1101/gr.4141805PMID:16339367
23. Purcell S, Neale B, Todd-Brown K, Thomas L, Ferreira MAR, Bender D, et al. (2007) PLINK: A Tool Set for Whole-Genome Association and Population-Based Linkage Analyses. Am J Hum Genet 81: 559– 575. PMID:17701901
24. Reynolds J, Weir BS, Cockerham CC (1983) Estimation of the Coancestry Coefficient: Basis for a Short-Term Genetic Distance. Genetics 105: 767–779. PMID:17246175
25. Scheet P, Stephens M (2006) A fast and flexible statistical model for large-scale population genotype data: applications to inferring missing genotypes and haplotypic phase. Am J Hum Genet 78: 629–644. doi:10.1086/502802PMID:16532393
26. Clarke BR, McKinnon PL, Riley G (2012) A fast robust method for fitting gamma distributions. Stat Pap 53: 1001–1014. doi:10.1007/s00362-011-0404-3
27. Zhou H, Alexander D, Lange K (2011) A quasi-Newton acceleration for high-dimensional optimization algorithms. Stat Comput 21: 261–273. doi:10.1007/s11222-009-9166-3PMID:21359052
28. Durinck S (n.d.) biomaRt: Interface to BioMart databases (e.g. Ensembl, COSMIC, Wormbase and Gra-mene). R package version 260.
29. Flicek P, Ahmed I, Amode MR, Barrell D, Beal K, Brent S, et al. (2012) Ensembl 2013. Nucleic Acids Res 41: D48–D55. doi:10.1093/nar/gks1236PMID:23203987
30. Hu Z-L, Park CA, Wu X-L, Reecy JM (2012) Animal QTLdb: an improved database tool for livestock ani-mal QTL/association data dissemination in the post-genome era. Nucleic Acids Res 41: D871–D879. doi:10.1093/nar/gks1150PMID:23180796
31. Kanehisa M, Goto S, Sato Y, Furumichi M, Tanabe M (2012) KEGG for integration and interpretation of large-scale molecular data sets. Nucleic Acids Res 40: D109–114. doi:10.1093/nar/gkr988PMID: 22080510
33. Fisher RA (1922) On the Interpretation ofχ2 from Contingency Tables, and the Calculation of P. J R Stat Soc 85: 87–94. doi:10.2307/2340521
34. Xu P, Denbow CJ, Meiri N, Denbow DM (2012) Fasting of 3-day-old chicks leads to changes in histone H3 methylation status. Physiol Behav 105: 276–282. doi:10.1016/j.physbeh.2011.06.023PMID: 21824486
35. Bai Y, Sun G, Kang X, Han R, Tian Y, Li H, et al. (2012) Polymorphisms of the pro-opiomelanocortin and agouti-related protein genes and their association with chicken production traits. Mol Biol Rep 39: 7533–7539. doi:10.1007/s11033-012-1587-yPMID:22399312
36. Kim S, Miska KB, McElroy AP, Jenkins MC, Fetterer RH, Cox CM, et al. (2009) Molecular cloning and functional characterization of avian interleukin-19. Mol Immunol 47: 476–484. doi:10.1016/j.molimm. 2009.08.027PMID:19767108
37. Lei M, Peng X, Zhou M, Luo C, Nie Q, Zhang X (2008) Polymorphisms of the IGF1R gene and their genetic effects on chicken early growth and carcass traits. BMC Genet 9: 70. doi: 10.1186/1471-2156-9-70PMID:18990245
38. Zhao XH, Wang JY, Zhang GX, Wei Y, Gu YP, Yu YB (2012) Single nucleotide polymorphism in the STAT5b gene is associated with body weight and reproductive traits of the Jinghai Yellow chicken. Mol Biol Rep 39: 4177–4183. doi:10.1007/s11033-011-1202-7PMID:21766180
39. Gautron J, Réhault-Godbert S, Pascal G, Nys Y, Hincke MT (2011) Ovocalyxin-36 and other LBP/BPI/ PLUNC-like proteins as molecular actors of the mechanisms of the avian egg natural defences. Bio-chem Soc Trans 39: 971–976. doi:10.1042/BST0390971PMID:21787332
40. Gunnarsson U, Kerje S, Bed’hom B, Sahlqvist A- S, Ekwall O, Tixier-Boichard M, et al. (2011) The Dark brown plumage color in chickens is caused by an 8.3-kb deletion upstream of SOX10. Pigment Cell Melanoma Res 24: 268–274. doi:10.1111/j.1755-148X.2011.00825.xPMID:21210960
41. Narum SR, Hess JE (2011) Comparison of FST outlier tests for SNP loci under selection. Mol Ecol Resour 11: 184–194. doi:10.1111/j.1755-0998.2011.02987.xPMID:21429174
42. Akey JM (2009) Constructing genomic maps of positive selection in humans: Where do we go from here? Genome Res 19: 711–722. doi:10.1101/gr.086652.108PMID:19411596
43. Nuzhdin SV, Turner TL (2013) Promises and limitations of hitchhiking mapping. Curr Opin Genet Dev 23: 694–699. doi:10.1016/j.gde.2013.10.002PMID:24239053
44. Smith JM, Haigh J (1974) The hitch-hiking effect of a favourable gene. Genet Res 23: 23–35. doi:10. 1017/S0016672300014634PMID:4407212
45. Pritchard JK, Pickrell JK, Coop G (2010) The Genetics of Human Adaptation: Hard Sweeps, Soft Sweeps, and Polygenic Adaptation. Curr Biol 20: R208–R215. doi:10.1016/j.cub.2009.11.055PMID: 20178769
46. Nielsen R, Slatkin M (2013) An introduction to population genetics: theory and applications. Sunder-land, Mass.: Sinauer Associates.
47. Qanbari S, Hansen M, Weigend S, Preisinger R, Simianer H (2010) Linkage disequilibrium reveals dif-ferent demographic history in egg laying chickens. BMC Genet 11: 103. doi: 10.1186/1471-2156-11-103PMID:21078133
48. Ma Y, Ding X, Qanbari S, Weigend S, Zhang Q, Simianer H (2015) Properties of different selection sig-nature statistics and a new strategy for combining them. Heredity 00, 1–11. doi:10.1038/hdy.2015.42 49. Muir WM, Aggrey SE (2003) Poultry Genetics, Breeding and Biotechnology. CABI. 724 p.
50. Jiao S, Ren H, Li Y, Zhou J, Duan C, Lu L (2013) Differential regulation of IGF-I and IGF-II gene expres-sion in skeletal muscle cells. Mol Cell Biochem 373: 107–113. doi:10.1007/s11010-012-1479-4PMID: 23054195
51. Bassom F (2009) Mini encyclopedia of chicken breeds & care: a color directory of the most popular breeds and their care. Bufflao, N.Y.; Richmond Hill, Ont.: Firefly Books.
52. Eyras E, Reymond A, Castelo R, Bye JM, Camara F, Flicek P, et al. (2005) Gene finding in the chicken genome. BMC Bioinformatics 6: 131. doi:10.1186/1471-2105-6-131PMID:15924626