LMBR1
in Human Population
Fang He1,3, Dong-Dong Wu1,3, Qing-Peng Kong1, Ya-Ping Zhang1,2*
1State Key Laboratory of Genetic Resources and Evolution, Kunming Institute of Zoology, Chinese Academy of Sciences, Kunming, China,2Laboratory for Conservation and Utilization of Bio-resource, Yunnan University, Kunming, China,3Graduate School of the Chinese Academy of Sciences, Beijing, China
Abstract
Background:The intron 5 of geneLMBR1is the cis-acting regulatory module for the sonic hedgehog (SHH) gene. Mutation in this non-coding region is associated with preaxial polydactyly, and may play crucial roles in the evolution of limb and skeletal system.
Methodology/Principal Findings:We sequenced a region of theLMBR1gene intron 5 in East Asian human population, and found a significant deviation of Tajima’s D statistics from neutrality taking human population growth into account. Data from HapMap also demonstrated extended linkage disequilibrium in the region in East Asian and European population, and significantly low degree of genetic differentiation among human populations.
Conclusion/Significance:We proposed that the intron 5 ofLMBR1was presumably subject to balancing selection during the evolution of modern human.
Citation:He F, Wu D-D, Kong Q-P, Zhang Y-P (2008) Intriguing Balancing Selection on the Intron 5 Region ofLMBR1in Human Population. PLoS ONE 3(8): e2948. doi:10.1371/journal.pone.0002948
Editor:Vincent Macaulay, University of Glasgow, United Kingdom
ReceivedApril 15, 2008;AcceptedJuly 18, 2008;PublishedAugust 13, 2008
Copyright:ß2008 He et al. This is an open-access article distributed under the terms of the Creative Commons Attribution License, which permits unrestricted use, distribution, and reproduction in any medium, provided the original author and source are credited.
Funding:This work was supported by the Key State Research Program of China (2006CB943900), Science and Technology Committee of Yunnan Province and the National Natural Science Foundation of China.
Competing Interests:The authors have declared that no competing interests exist. * E-mail: [email protected]
Introduction
After dispersal from African, modern human migrated to the rest of the world and adapted rapidly to a variety of environmental challenges, such as climate, food supply, etc. Many phenotypes may undergo apparent adaptation [1]. Skeletal system has been observed to evolve rapidly during the past 10,000 years among human populations during the time of rapid population growth [2]. However, unlike other beneficial traits, e.g. speech, cognitive ability, diverse skin and others [1], virtually no single gene has been identified under a major selection event accounting for the rapid evolution of skeletal system of human.
Polydactyly, characterized by the addition or part of a digit, is one of the most common congenital limb malformations which are relatively common human abnormalities occurring at an incidence of one per,500–1000 live births [3]. Polydactyly occurs in many
phenotypes, like preaxial polydactyly II (PPD II), triphalangeal thumb-polysyndactyly syndrome (TPT-PS) and isolated triphalan-geal thumb (OMIM 174500) [3–7].LMBR1gene, which contains 17 exons spanning approximately 200 kb of genomic DNA, encodes a 490-amino acid protein containing 9 putative transmembrane and one coiled-coil domains [8]. Level ofLMBR1
activity had been associated with the number of digits across vertebrates [4]. The crucial functional element of LMBR1 is located within the intron 5, which serves as the long-range regulatory element of the adjacentSHHgene, a key development gene in the nervous system, skeletal system and others. Disruption of this intron, leading to dysregulation ofSHH, can cause all kinds
of above mentioned polydactyly [3–7]. Phylogenetic analysis also indicated conservation of the intron 5 region in teleost fishes and throughout the tetrapod lineage [9].
Considering the profound role ofLMBR1gene, particularly the intron 5, in the development of limb and skeletal system, we checked the evolutionary pattern by sequencing a,10 kbp region
in the intron 5 in 41 East Asian individuals. Tajima’s D value is significantly higher than neutrality as after considering human population growth. Additionally, the advent of large-scale genome and polymorphism data in human population supports specific selection effect during human evolution. Extensive linkage disequilibrium and lower genetic differentiation were found in this region in East Asian and European populations. We concluded that balancing selection at the region occurred during the evolution of modern human.
Results
Genetic variation of the sequenced region in the intron 5 in the East Asians
We sequenced one 9256 bp region in the 5th intron ofLMBR1
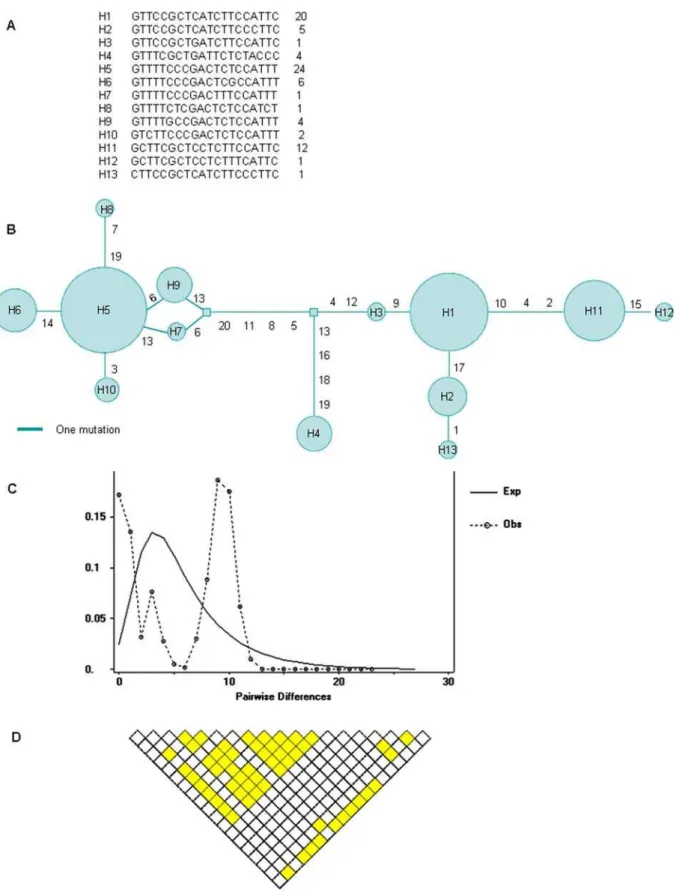
construct the haplotypes by the PHASE program [10,11], and 13 haplotypes were obtained (Figure 1A). All SNPs were not deviated from Hardy-Weinberg equilibrium.
The nucleotide diversitypis 6.461024, lower than the human genome average (,7.561024) [12], and the Watterson’s estimator hw is 4.4961024. The haplotype diversity is 0.828. There are two major haplotypes found at high frequencies, and the network analysis indicates that they are separated by relative long branch length (Figure 1B). The ‘‘twin-peak’’ phenomenon is observed in the mismatch distribution of pairwise differences between the haplotypes (Figure 1C). Tajima’s D value is 1.25 (p.0.1), but the value is significantly higher at the empirical 95% level (by one sided p-value) in an empirical distribution available from a study of 313 genes [13]. These data are suggestive of the direction of balancing selection.
Evidences have suggested that human populations have grown dramatically, which have strong effects on the genetic diversity. The assumption of constant population size is highly conservative in the detection of balancing selection, and will cause type II statistical error (i.e. a failure to reject the null hypothesis of neutrality when it is false) [14]. Considering the population size change in human populations, we performed 250 different tests of Tajima’s D using the algorithm of Rogers [15] across different magnitudes of population growth (from 1-fold growth [i.e., no growth] to 250-fold growth), with the growth beginning at different times (0 years ago to 250,000 years ago). The hypothesis of neutrality is rejected by Tajima’s D under those models assuming magnitudes of growth greater than 1.3, from an ancient effective population size of 10,000, beginning more than about 65,000 years ago. The sequence is large enough that recombination may have occurred, and it would make Tajima’s D test conservative.
Age estimation
The time of the most recent common ancestor (TMRCA) is calculated as THC*DH/DHC. THC is the time of divergence between human and chimpanzee, DHCis the divergence between human and chimpanzee sequences (from NCBI) and DH is the average difference of human haplotypes. The values are 66106 years, 95.00, and 5.71 respectively, and the TMRCAis 3.616105 years, much longer than 65,000 years.
Extensive linkage disequilibrium of the intron 5 in the East Asian and European populations
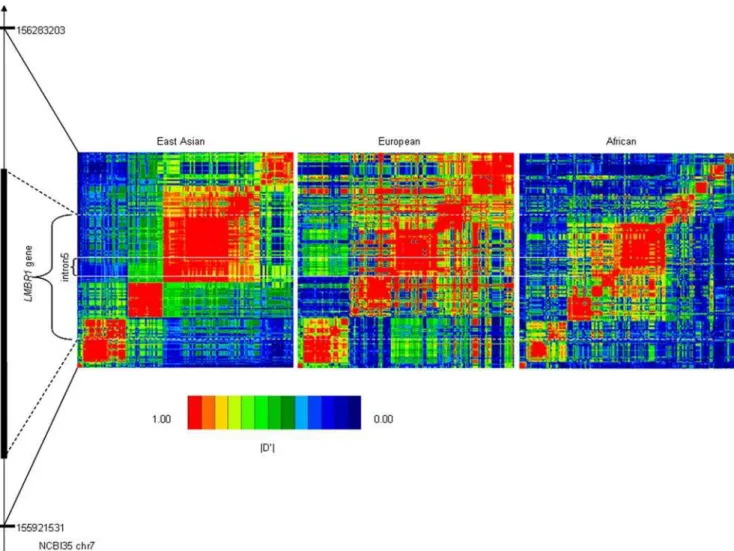
Extended linkage disequilibrium is usually observed in the selected region because recombination does not have enough time to break it down [16]. Large scale polymorphism data are facilitating the studies of evolutionary patterns in human genome. We examined the characteristics ofLMBR1by the HapMap data. All pairwise D’ measures among these HapMap SNPs were estimated, and the graphical representation of LD level is illustrated in Figure 2, which demonstrates strong LD of the intron 5 region in the East Asian and European populations (Figure 2). We also estimate the LD extent by analyzing the R2of all pairwise comparisons between the 20 SNPs, and found 56 significant pairs at 5% level (Figure 1D).
Lower genetic differentiation among human populations In general, positive directional selection promotes the divergence among populations, but balancing selection will decrease the differentiation of selected loci compared with neutrality. The average Fst values of total 113 SNPs in theLMBR1gene were 0.036 (East Asian vs European), 0.081 (East Asian vs African), and 0.064 (European vs African), significantly lower than the average values in [17], 0.098, 0.128 and 0.102 respectively by t test (p = 9.36E-44, 1.57E-07, 2.08E-06 respectively with degree of freedom 112;
p = 0.00098, 0.016, p = 0.02 respectively with degree of freedom 2; and p = 0.014, 0.058, 0.065 respectively with degree of freedom 1). Such weak genetic differentiation indicates balancing selection might have occurred in this region rather than population subdivision.
Discussion
Evidences have indicated that the size of human population increased in the Upper Pleistocene [15]. Populations that have grown are expected to have an excess of low-frequency alleles and thus low pairwise difference between sequences, which will lead to the reduction of common statistics used to detect from neutrality, e.g. Tajima’s D, [18]. Therefore, it is inappropriate to detect natural selection, e.g. conservative to detect balancing selection, under the model of constant population size [14]. In this study, we identified significant deviation of Tajima’s D from neutrality under models incorporating different human population growth parameters. Another two pieces of evidences, strong linkage disequilibrium and lower genetic differentiation among human ethnical populations also support the existence of a balancing selection, because population subdivision, another competing hypothesis, could also lead to significantly high Tajima’s D for divergent haplotypes existing in different geographical regions [14,19]. However, the nucleotide diversity is low in the region, which is not usually observed in the genes under balancing selection (Figure 3). Perhaps, the intron 5 region is highly conservative during evolution for its essential function and does not allow accumulation of new mutations. For example, the nucleotide diversity ofACE2gene, subject to balancing selection, is even lower than that found in this intron [20].
Cis-regulating modules have been known contributing profoundly to the genome evolution as they are key regulator of gene expression level. Up to now, cis-regulatory regions of many genes showed evidence of positive and/or balancing selection. For example, the cis-regulator ofCCR5[21] was involved in a strong balancing selection,
whereas, the encoding sequence of the gene was subject to positive selection. The intron 5 and the downstream SHH gene appear evolving in a similar manner asCCR5, in that evidence of positive selection has been found in SHH gene in primate, particularly lineage leading to human, and human population [22].
It is appealing that testing for selection should be based on a strong biological working hypothesis [23]. The lower genetic differentiation of the loci among human populations indicated that the balancing selection had occurred before the divergence between the main modern human subpopulations. Accordingly, we proposed that polydactyly has maintained for a long time during the evolution of human. However, considering the strangeness appearance of the phenotype, it may be a slightly side effect and disadvantage during the adaptive evolution of limb and skeletal system, like limb size, hand bone strength, finger flexibility or others. Presumably, the variants maintained by balancing selection may be associated additional intermediate phenotypes other than polydactyly. In addition, the balancing selection on the region probably also plays a role in maintaining the diversity of skeletal system, e.g. sizes, among different populations and different individuals. Although we showed the evidence of balancing selection in this region, the mechanism under which balancing selection occurred at the intron 5 ofLMBR1gene is unclear. It may become more apparent when more insight into function of the intron 5 is available by the future functional studies.
Materials and Methods
Samples and sequencing
Figure 1. Genetic variation analyses in theLMBR1intron 5 among 41 East Asian individuals.A: The 13 haplotypes constructed by PHASE program, and the right-most column shows the number of each haplotypes among 41 subjects. B: Median joining network of haplotypes. Each circle represents a haplotype indicated in Figure 1A, and the size of the circle is the relative frequency. Beside the branches are labels of the SNPs in the haplotypes counted from left to right. C: Graph of pairwise differences between the haplotypes. The dash line represent the observed sequence pairwise difference, and the real line represent the expected distribution of pairwise difference simulated by DnaSP under population growth with initial theta as 3.442, final theta as 1000, and final tau as 2.267. The ‘‘twin-peak’’ of observed mismatch distribution is suggestive of balancing selection. D: LD extent analyzed by R2of all pairwise comparisons between the 20 SNPs. The shadows indicate significant pairwise comparison
for sequencing. Ethical approval for this study was provided by the Ethics Committee of Kunming Institute of Zoology, Chinese Academy of Sciences, and all participants provided written informed consent. The first ten kbps of LMBR1 intron 5 was
amplified by LA-PCR method with two pair primers (59 -AGAAAGGAGGTCATTGTAG-39as first sense primer and 59 -AGATTGAGGTCCAGGTAT-39 as first antisense primer; 59 -CGTATGGGAACTCAGAAA-39as second sense primer and 59 -ACGCAAGCCAAATAAGAC-39 as second antisense primer), and sequenced by ABI PRISM 3730xl DNA analyser (Applied Biosystems) with ABI BigDye Terminator Cycle Sequencing Kit, Version 3.1 (Applied Biosystems, Foster City, California, USA). The thermal cycling condition of two pair primers both are: 95uC, 4 min; 94uC, 1 min, 57uC, 5 min, 72uC, 5 min, 30 cycles; 72uC, 10 min. The resulting sequences were analyzed by the DNASTAR software (DNASTAR). Detailed information on sequencing primer sequences is available on request.
Statistical analysis on the sequenced intron 5 region The haplotypes were constructed by PHASE program [10,11], and the network was constructed by using median joining algorithm [24] implemented in Network. The average number of pairwise difference (p), Watterson’s estimator (hw) [25] and haplotype diversity were calculated. Tajima’s D (1989) [26] was used to test the evolutionary pattern by Arlequin program [27]. Allowing for human population growth, we applied the Tajima’s D test on the background of different magnitudes of population growth and the growth beginning at different times simulated by
Figure 2. Linkage disequilibrium pattern of chr7: 155920–156290 kbp (NCBI35) region in the East Asian, European and African populations based on the HapMap Data.LMBR1gene and the intron 5 are showed.
doi:10.1371/journal.pone.0002948.g002
Figure 3. Nucleotide diversity (p) of previous reported
balancing selection genes and the LMBR1 intron 5 studied here.It shows thatLMBR1intron 5 had lowpamong these genes with documented evidence of balancing selection. The data are from [29] (LDLR), [30] (HAVCR1), [18] (ABO,IL10RB,IL1A, andACE2), [19] (59CCR5), [31] (MBL2), [32] (CD209L), [33] (C6), [13] (PTC), [34] (FSHB), [35] (FMO3), [36] (G6PD), [37] (FUT2).
the algorithm of Rogers (1995) [15]. Pairwise mismatch analysis was performed by DnaSP [28] under population growth assumptions with initial theta as 3.442, final theta as 1000, and final tau as 2.267. LD extent was analyzed by R2of all pairwise comparisons between SNPs, and the significances were identified withx2tests by using a Bonferroni correction for multiple testing. The nucleotide diversity (p) values of previous reported balancing selection genes were obtained from [29] (LDLR), [30] (HAVCR1),
[20] (ABO, IL10RB, IL1A, and ACE2), [21] (59 CCR5), [31] (MBL2), [32] (CD209L), [33] (C6), [14] (PTC), [34] (FSHB), [35] (FMO3), [36] (G6PD), [37] (FUT2).
LD analysis and Fst comparison based on the HapMap data
SNPs of LMBR1 location in chr7:155920–156290 kbp (NCBI35) were chosen from HapMap with the criteria: minor allele frequency $10% and consistent with Hardy-Weinberg equilibrium in 0.01 level. LD measures between pairs of SNPs were quantified using statistic D’ [37], which were calculated by
Haploview program [39]. The results of pairwise D’ were visualized by the GOLD program [40]. SNPs in the LMBR1
gene region were used to calculate Fst values between Caucasians, Africans, and East Asians. Total 113 SNPs in theLMBR1region fulfilled the criteria were used to calculate the Fst values among human populations as described in [17,41].
Acknowledgments
We are grateful to Dr. Stephen Wooding from the Department of Human Genetics, University of Utah School of Medicine for helping stimulating and analyzing the data, Dr. Yong-Gang Yao for helpful suggestions and comments, and Dr. Nelson Leung-sang Tang for reading and polishing the manuscript. We also thank Li Hui and Xie Liang for technical helping; and Gou S.-K., Wu S.-F., and Zhu C.-L. for technical assistance.
Author Contributions
Conceived and designed the experiments: FH DDW QPK YPZ. Performed the experiments: FH. Analyzed the data: FH DDW. Wrote the paper: FH DDW YPZ.
References
1. Sabeti PC, Schaffner SF, Fry B, Lohmueller J, Varilly P, et al. (2006) Positive natural selection in the human lineage. Science 312: 1614–1620.
2. Armelagos GJ, Harper KN (2005) Genomics at the origins of agriculture, part one. Evol Anthropol 14: 68–77.
3. Wang ZQ, Tian SH, Shi YZ, Zhou PT, Wang ZY, et al. (2007) A single C to T transition in intron 5 ofLMBR1gene is associated with triphalangeal thumb-polysyndactyly syndrome in a Chinese family. Biochem Biophys Res Comm 355: 312–317.
4. Clark RM, Marker PC, Roessler E, Dutra A, Schimenti JC, et al. (2001) Reciprocal mouse and human limb phenotypes caused by gain-and loss-of-function mutations affecting lmbr1. Genetics 159: 715–726.
5. Ianakiev P, van Baren MJ, Daly MJ, Toledo SP, Cavalcanti MG, et al. (2001) Acheiropodia is caused by a genomic deletion in C7orf2, the human orthologue of the Lmbr1 gene. Am J Hum Genet 68: 38–45.
6. Lettice LA, Heaney SJH, Purdie LA, Li L, de Beer P, et al. (2003) A long-range Shh enhancer regulates expression in the developing limb and fin and is associated with preaxial polydactyly. Hum Mol Genet 12: 1725–1735. 7. Gurnett CA, Bowcock AM, Dietz FR, Morcuende JA, Murray JC, et al. (2007)
Two novel point mutations in the long-range SHH enhancer in three families with triphalangeal thumb and preaxial polydactyly. Am J Med Genet A 143: 27–32. 8. Clark RM, Marker PC, Kingsley DM (2000) A novel candidate gene for mouse
and human preaxial polydactyly with altered expression in limbs of hemimelic extra-toes mutant mice. Genomics 67: 19–27.
9. Sagai T, Masuya H, Tamura M, Shimizu K, Yada Y, et al. (2004) Phylogenetic conservation of a limb-specific, cis-acting regulator of sonic hedgehog (Shh). Mamm Genome 15: 23–34.
10. Stephens M, Smith NJ, Donnelly P (2001) A new statistical method for haplotype reconstruction from population data. Am J Hum Genet 68: 978–989. 11. Stephens M, Scheet P (2005) Accounting for decay of linkage disequilibrium in
haplotype inference and missing-data imputation. Am J Hum Genet 76: 449–462. 12. Sachidanandam R, Weissman D, Schmidt SC, Kakol JM, Stein LD, et al. (2001) A map of human genome sequence variation containing 1.42 million single nucleotide polymorphisms. Nature 409: 928–933.
13. Stephens JC, Schneider JA, Tanguay DA, Choi J, Acharya T, et al. (2001) Haplotype variation and linkage disequilibrium in 313 human genes. Science 293: 489–493.
14. Wooding S, Kim UK, Bamshad MJ, Larsen J, Jorde LB, et al. (2004) Natural selection and molecular evolution in PTC, a bitter-taste receptor gene. Am J Hum Genet 74: 637–646.
15. Rogers AR (1995) Genetic evidence for a pleistocene population explosion. Evolution 49: 608–615.
16. Sabeti PC, Reich DE, Higgins JM, Levine HZP, Richter DJ, et al. (2002) Detecting recent positive selection in the human genome from haplotype structure. Nature 419: 832–837.
17. Akey JM, Zhang G, Zhang K, Jin L, Shriver MD (2002) Interrogating a high-density SNP map for signatures of natural selection. Genome Res 12: 1805–1814.
18. Wooding S, Rogers A (2002) The matrix coalescent and an application to human single-nucleotide polymorphisms. Genetics 161: 1641–1650. 19. Hudson RR, Boos DD, Kaplan NL (1992) A statistical test for detecting
geographic subdivision. Mol Biol Evol 9: 138–151.
20. Akey JM, Eberle MA, Rieder MJ, Carlson CS, Shriver MD, et al. (2004) Population history and natural selection shape patterns of genetic variation in 132 genes. PLos Biol 2: e286.
21. Bamshad MJ, Mummidi S, Gonzalez E, Ahuja SS, Dunn DM, et al. (2002) A strong signature of balancing selection in the 5’cis-regulatory region of CCR5. Proc Natl Acad Sci USA 99: 10539–10544.
22. Dorus S, Anderson JR, Vallender EJ, Gilbert SL, Zhang L, et al. (2006) Sonic Hedgehog, a key development gene, experienced intensified molecular evolution in primates. Hum Mol Genet 15: 2031–2037.
23. Kreitman M, Di Rienzo A (2004) Balancing claims for balancing selection. Trend Genet 20: 300–304.
24. Bandelt HJ (1999) Median-joining networks for inferring intraspecific phylog-enies. Mol Biol Evol 16: 37–48.
25. Watterson GA (1975) On the number of segregating sites in genetical models without recombination. Theor Popul Biol 7: 256–276.
26. Tajima F (1989) Statistical method for testing the neutral mutation hypothesis by DNA polymorphism. Genetics 123: 585–595.
27. Excoffier L, Laval G, Schneider S (2005) Arlequin version 3.0: An integrated software package for population genetics data analysis. Evolutionary Bioinfor-matics Online 1: 47–50.
28. Rozas J (1999) DnaSP version 3: an integrated program for molecular population genetics and molecular evolution analysis. Bioinformatics 15: 174–175.
29. Fagundes NJR, Salzano FM, Batzer MA, Deininger PL, Bonatto SL (2005) Worldwide genetic variation at the 39-UTR region of the LDLR gene: possible influence of natural selection. Ann Hum Genet 69: 389–400.
30. Nakajima T, Wooding S, Satta Y, Jinnai N, Goto S, et al. (2005) Evidence for natural selection in the HAVCR1 gene: high degree of amino-acid variability in the mucin domain of human HAVCR1 protein. Genes Immun 6: 398–406. 31. Bernig T, Taylor JG, Foster CB, Staats B, Yeager M, et al. (2004) Sequence
analysis of the mannose-binding lectin (MBL2) gene reveals a high degree of heterozygosity with evidence of selection. Genes Immun 5: 461–476. 32. Barreiro LB, Patin E, Neyrolles O, Cann HM, Gicquel B, et al. (2005) The
heritage of pathogen pressures and ancient demography in the human innate-immunity CD209/CD209L region. Am J Hum Genet 77: 869–886. 33. Soejima M, Tachida H, Tsuneoka M, Takenaka O, Kimura H, et al. (2005)
Nucleotide sequence analyses of human complement 6(C6) gene suggest balancing selection. Ann Hum Genet 69: 239–252.
34. Grigorova M, Rull K, Laan M (2007) Haplotype structure of FSHB, the beta-subunit gene for fertility-associated follicle-stimulating hormone: possible influence of balancing selection. Ann Hum Genet 71: 18–28.
35. Allerston CK, Shimizu M, Fujieda M, Shephard EA, Yamazaki H, et al. (2007) Molecular evolution and balancing selection in the flavin-containing monoox-ygenase 3 gene (FMO3). Pharmacogenet Genom 17: 827–839.
36. Verrelli BC, McDonald JH, Argyropoulos G, Destro-Bisol G, Froment A, et al. (2002) Evidence for balancing selection from nucleotide sequence analyses of human G6PD. Am J Hum Genet 71: 1112–1128.
37. Koda Y, Ishida T, Tachida H, Wang B, Pang H, et al. (2003) DNA sequence variation of the human ABO-secretor locus (FUT2) in New Guinean populations: possible early human migration from Africa. Hum Genet 113: 534–541. 38. Lewontin RC (1964) The interaction of selection and linkage. I. General
considerations; heterotic models. Genetics 49: 49–67.
39. Barrett JC, Fry B, Maller J, Daly MJ (2005) Haploview: analysis and visualization of LD and haplotype maps. Bioinformatics 21: 263–265. 40. Abecasis GR, Cookson WOC (2000) GOLD–graphical overview of linkage
disequilibrium. Bioinformatics 16: 182–183.