_____________________________
*) Corresponding author: [email protected]
doi:
10.2298/SOS0803251S
UDK 661.183.8:57.012.3:622.785
Prediction of Densification and Microstructure Evolution for
α
-Al
2O
3During Pressureless Sintering at Low Heating Rates Based
on the Master Sintering Curve Theory
W.Q. Shao, S.O. Chen*
), D.Li, H.S.Cao, Y.C.Zhang, S.S. Zhang
College of Physics Science, Qingdao University, Qingdao 266071, China
Abstract:
The master sintering curve (MSC), in which the sintered density is a unique function of the integral of a temperature function over time, is insensitive to the heating path. Densification of α-Al2O3 with the mean particle size of 2.5μm was continuously recorded
during heating at 0.5, 2 and 5oC/min. A MSC was successfully constructed using dilatometry data with the help of a combined-stage sintering model. The validity of the MSC was verified by seveal experimental runs. The microstructural evolution with densification during different heating-rate sintering was explored. The sintered microstructure is a function of the time-temperature sintering conditions, and it is verified that there exists a link between sintered density and microstructure. The MSC can be used to predict and control microstructure evolution during sintering of α-Al2O3 ceramics.
Keywords:α-Al2O3; Pressureless sintering; Master sintering curve; Microstructure evolution
1. Introduction
In advanced ceramic component manufacturing, reproducible processing of powders was critical for the cost-effective manufacture of reliable ceramic components. Historically, empirical engineering has been used to develop the processes used to manufacture ceramic components [1]. However, empirical engineering alone can not provide the fundamental understanding necessary to design new products, to process new materials, or to troubleshoot processing problems. Consequently, a different approach is needed to realize the benefits of advanced ceramics. One approach is to integrate fundamental scientific understanding into science-based processing technology that can be applied to better understand and control ceramic powder processing and sintering [2, 3].
The fundamental science of sintering is reasonably well understood, including the driving force for densification, microstructure evolution, the mechanisms and paths of material transport [4, 5]. However, the practical application of fundamental sintering science and modeling in ceramic component manufacturing has been a challenge.
help simplify the analysis of sintering in a way that enables the practical application of sintering theory in the manufacturing environment.
Another promising and practical approach to predict and control sintering is based on the concept of the master sintering curve (MSC) [8]. The MSC is an empirical curve that provides a characteristic measure of the densification of a material over a given density range. A unique MSC can be constructed for a given material processed in a given way. Once constructed, the MSC can be used to predict density and densification rates. Favorable comparisons of predicted and experimentally measured sintered densities have verified the predictive power of the MSC [8]. The MSC was originally developed and demonstrated for solid-state sintering materials that exhibit isotropic sintering behavior [8]. More recently, the master curve concept has been extended to systems that exhibit anisotropic sintering behavior, and that densify by liquid-phase and viscous-phase sintering [9].
This curve is sensitive to such factors as starting morphology of the powder, fabrication route, and dominant diffusion mechanism during sintering. So the MSC curve can also be used as an aid to compare the sinterability of different powders [10, 11] and to know the effects of additives, atmosphere and fabrication procedure of sintering [12]. In the MSC theory, Φ(ρ) which is a function only of density, is given as the function of temperature and time:
( ) (
)
01
=
t T t
, ( )
texp
Q
dt
T
RT
ρ
⎛
⎞
Φ
Θ
=
⎜
−
⎟
⎝
⎠
∫
(1)
where Q is the apparent activation energy for sintering, R is the gas constant, T is the absolute temperature, t is the time. For the master sintering curve, the measured density is plotted as a function of the right-hand side, denoted by Θ.
It is well-known that surface diffusion inhibits sintering, particularly at low temperatures and during the earliest stages of sintering. In constant-heating-rate sintering, this inhibition diminishes with time and increased temperature. Estimates of the activation energy of densification are biased upward by this surface diffusion effect, particularly at low heating rates. The MSC for low heating rates in the presence of low-activation-energy surface diffusion would be biased to higher temperatures from those at higher heating rates.
It was found that [13] the MSCs obtained by sintering at a heating rate of 3-5oC/min did not correspond to that based on the heating rate of 7.5-20oC/min. It can be presumed that contribution of the surface diffusion for the slow heating rate becomes large. For this reason, in firing at 3-5oC/min, densification proceeded by a different diffusion mechanism from the
others. In other words, the activation energy in 3-5oC/min sintering differed from 7.5-20oC/min firing. Moreover, application of the master sintering curve theory was mainly
focused on prediction of the sintered density and evaluation of apparent activation energy for ceramic sintering [8, 14]. Little attention was paid to predict and control the microstructure evolution of ceramics during low heating-rate sintering using the MSC theory.
The objectives of this study were to construct the MSC for α-Al O2 3 based on
non-isothermal sintering containing lower heating rates only. In addition, another objective of the present research is to predict and control microstructure evolution during low heating-rate sintering of α-Al O2 3 ceramics. The results demonstrate how the MSC theory can be applied to
design a reproducible process to fabricate controlled density and microstructure ceramics.
2. Experimental procedure
For constant-heating-rate sintering, α-Al O2 3 powder (99.9% purity, Dalian Luming
pressing at 250 MPa to create bars of ∼5mm×5mm×45mm. The binder was burned out at 500°C. This resulted in negligible densification but provided green strength and minimized contamination from any adsorbed species in the raw powder. The green density was measured by the geometric method. The green density of α-Al O2 3 powder compacts was
2.59±0.02 g/cm3. The value of 3.98 g/cm3 was used as the theoretical density, which is the monocrystal density.
The shrinkage of α-Al O2 3 samples were measured with a push rod type dilatometer in
axial direction. The length change measurements were made by a linear voltage differential transducer (LVDT) which was maintained at a constant temperature by means of water circulation from a constant temperature bath. The accuracy of the measurement of change in length was within ±0.1μm. The temperature was measured using a calibrated thermocouple which is placed directly above the sample. A small force of 0.2 N was applied to the sample through the push rod.
Firstly, three green compacts were heated to the peak temperature of 1650oC at the heating rates of 0.5, 2 and 5°C/min (Much higher heating rates could not be used with the existing equipment. Much lower heating rates are very time-consuming and difficult to control accurately). Secondly, other runs for non-isothermal sintering were carried out in the same system by heating at 1°C /min to 1250°C, 3°C/min to 1420°C, 4°C /min to 1575°C and 5°C /min to 1650°C without holding dwell time, respectively. Apparent densities of the sintered samples were determined by the Archimedes method. The microstructures of the specimens were examined by scanning electron microscopy (JSM-6390LV, JEOL, JAPAN).
3. Results and discussion
3.1 MSC construction
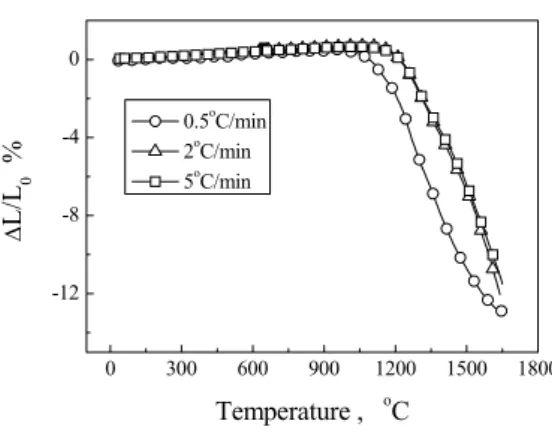
Sintering plots of the samples sintered at three heating rates are shown in Fig. 1. During heating, the compacts show the normal linear expansion behaviors with a maximal expansion in length (0.52, 0.68 and 0.65% corresponding to the heating rate of 0.5, 2 and 5oC/min, respectively) at around 1000 oC and then a tendency to shrink around 1000oC. Taking the initial length of 45mm, we determine the maximal expansion in length: 45mm×0.0052 (0.0068 and 0.0065)= 0.234mm (0.306mm and 0.293mm ) for three heating rates. The dilatometric curves (taking the temperature 1000 oC as the initial temperature) of Fig. 1 were replotted as the relative density versus temperature (Fig. 2). The ΔL/L0 values
were converted into the time-dependent relative density using the following relation [15]:
(
G)
30 0
1
1- L L
ρ
ρ
ρ
=
Δ
(2)where ρ is the relative density of the sintered compacts, ρG is the density of green compacts,
ρ0 is the theoretical density, ΔL/L0 is the temperature-dependent linear shrinkage. The curves
have the familiar sigmoidal shape and generally shifted to higher temperatures with increasing heating rate.
It is true that dilatometry data, that is ΔL/L0, include thermal expansion and theoretical
density ρ0 also varying with temperature because of thermal expansion. However, as seen
from Fig.1, the thermal expansion before shrinking for the samples by heating at three heating rates is very low (compared with the whole shrinkage). Before shrinking, ΔL/L0 underwent a
maximum thermal expansion and then decreased to zero. The dilatometry data of it was taken from zero to the maximum shrinkage in the present work. Moreover, ρ0 is the monocrystal
density of α-Al O2 3, which will change little during the sintering process without phase
relative density for the construction of the MSC [14] without taking the thermal expansion into consideration.
0 300 600 900 1200 1500 1800
-12 -8 -4 0
Δ
L/
L0
%
Temperature , oC
0.5oC/min 2oC/min 5o
C/min
Fig. 1 Sintering curves for α-Al O2 3
powder compacts at three heating rates
For the construction of MSC, the integral of Eq. (1) and the experimental density should be known. The dilatometry can be conveniently used to determine the density since the instantaneous density at all times can be obtained from the dilatometric data [16]. For the calculation of Θ, the activation energy (a characteristic quantity that elucidates the fundamental diffusion mechanisms during the sintering process) must be known. If the activation energy is unknown, it can be estimated with good precision from Θ versus the relative density (ρ) data [8]. The apparent activation energy for the MSC of densification are determined by minimising mean residual method. The mean residual used is defined as follows [17]:
(
)
(
)
21
1
1
Re
fi
N
m avg
m
f i
Mean
sidual
d
N
ρ
ρ
ρ
ρ
ρ
=
Θ − Θ
−
=
−
∑
∫
(3)where m is the dummy variable for summation, N is the number of experimental data, Θavg is
the average value of work of sinterings at density for mth experiment, Θm is the work of
sintering for mth experiment, and ρi is the initial density, and ρf is the final density,
respectively.
1000 1200 1400 1600
0.6 0.7 0.8 0.9 1.0
Relative D
en
si
ty
Temperature , oC
0.5oC/min
2oC/min
5oC/min
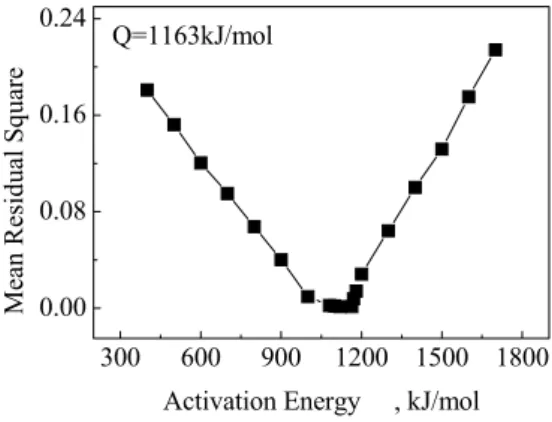
For this purpose, initially, an estimate is made for the activation energy Q, and the MSCs for three heating profiles are computed using Eq. (1). If the correct value of Q has been given, all of the data converge to a single curve. A curve (a polynomial function) can be fitted to all the data points, and then the convergence of the data to the fitted line can be quantified through the sum of the residual squares of the points with respect to the fitted line. Another estimate of Q is made, and the process is repeated. When the best estimate of Q is found, the mean of residual (sum of residual squares divided by total number of data points) is a minimum. According to the mentioned above, such an exercise for alumina sintering data of Fig. 2 was performed. The results for such an exercise for the alumina sintering data of Fig. 2 are shown in Fig. 3. The minimum is reached at ~1163kJ/mol, indicating the estimated sintering activation energy. From the knowledge of the activation energy of sintering obtained above, MSC for α-Al O has been constructed and is shown in Fig. 4. 2 3
Fig. 3 MSC was used to obtain the sintering activation energy: mean of residual squares versus activation energy. Minimum occurs at 1163 kJ/mol
It is a high estimate, considering the reported activation energies for alumina in the literature [13, 18]. The activation energy value of α-Al
300 600 900 1200 1500 1800 0.00
0.08 0.16 0.24
Mean
Resid
u
al Sq
uare
Activation Energy , kJ/mol Q=1163kJ/mol
O
2 3 obtained by Tatami et al [13] for
heating rates 7.5-20oC/min was 555 kJ/mol based on the MSC theory. In their experiments, the powder was uniaxially molded at 50 MPa, followed by cold isostatic pressing at 200 MPa. Shrinkage behavior during sintering of the green bodies was evaluated using an electric furnace equipped with a dilatometer. The samples were heated to 1400oC at constant heating rates (7.5, 10, 15, 20 oC/min). The shrinkage ranging from 2.5 to 17.5% was analyzed.
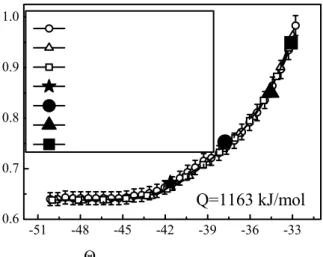
-51 -48 -45 -42 -39 -36 -33 0.6
0.7 0.8 0.9 1.0
Relative Dens
ity
Log[Θ(t,T(t))] , Log(s/K)
0.5oC/min
2oC/min
5oC/min
Q=1163 kJ/mol
Fig. 4
Master sintering curve for α -Al O2 3. The curve is constructedIn the α-Alumina (with an average particle size of 0.27 μm) sintering experiments by Wang and Raj [18], the activation energy was determined to be 440 kJ/mol by an Arrhenius plot of ln(
ε
&T) versus the reciprocal of the absolute temperature. Five values of density ranging from 0.65 to 0.85 are used. The cylindrical samples themselves were prepared by uniaxial pressing in a steel die at 40 MPa and then by isopressing cylindrical green compacts at 100 MPa. The samples were 12 mm in diameter and 10 mm in height. Their relative green density was 55±1%. The temperature of the specimen was raised to 800°C in 1 h and held at that temperature for 10 min. Thereafter three different heating rates were used to increase the temperature from 800 °C to 1600°C. They were 5oC/min, 10 oC/min, and 20 oC/min. The experiments were terminated when the temperature reached 1600°C.It should be noted that the activation energy value obtained in the present work is quite high (twice as high as 555 kJ/mol obtained by Tatami et al [13] or Wang and Raj [18] of 440 kJ/mol). The activation energy for sintering is equal to the activation energy for the rate-controlling diffusional mechanism since the sintering rate is proportional to the diffusion coefficient. However, the value obtained for Q can vary drastically, depending on the conditions (i.e., the characteristics of the raw materials, the preparing procedure of green compacts, the sintering procedure, and etc) under which the sintering data are obtained. As has been shown, the condition under which the activation energy was obtained in the literature [13, 18] differs much more significantly from that in the present work, especially the heating rate (heating rates lower than 5oC/min only in the present work).
In literature [19], the α-Al2O3 powder had an average diameter of 0.21μm. Sintering
was performed in air using a dilatometer. For nonisothermal sintering, four heating rates of 3, 5, 10, and 20 oC/min were used to reach the desired temperature (1700 oC) without holding. The activation energy of sintering is evaluated by an Arrhenius plot of ln(
ε
&T) versus the reciprocal of the absolute temperature. Five values of density ranging from 0.70 to 0.90 are used.For the powder above, three values of activation energy in the intermediate stage of sintering can be evaluated based on different heating rates, i.e., 478 kJ/mol for 10 and 20 oC/min, 640 kJ/mol for 5, 10, and 20 oC/min, and 1080 kJ/mol for 3, 5, and 10 oC/min, respectively. It indicated that higher value of the evaluated activation energy will be obtained when the Arrhenius plot involves low heating rates. Comparing the activation energy of 1080 kJ/mol in the literature and 1163 kJ/mol obtained in the present work, this kind of similarity can be attributed to the similar heating rates used in the literature and the present work.
3.2 MSC Validation
A trial of application of the master sintering curve was carried out to see whether a unique densification curve exists during sintering. Fig.5 shows the relative density continuously determined by a dilatometer during sintering with a constant heating rate as well as those measured by the Archimedes method after sintering with different heating profiles. The relatively small error bars (1.5%) on the MSC for 2.5μm α-alumina shown in Fig.5 are indicative of the small and apparently random scatter of the sintering data about the MSC. The relative densities from dilatometer trace (66.2, 74.2, 85.9, 95.3%) are consistent well with those determined by Archimedes method (67.1, 75.3, 85.1, 94.9.%) after different sintering process (1°C /min to 1250°C, 3°C/min to 1420°C, 4°C /min to 1575°C and 5°C /min to1650°C), even though they undergo a different heating history. It is proved that the density profile versus time–temperature integral values, Θ, can be used to predict the final density processed with a different heating history.
profile yields a point on the MSC curve.
Fig. 5 Validation of the master sintering curve for α-Al2O3 (Including error bars). The density
determined by a dilatometer trace agreed well with the Archimedes density -51 -48 -45 -42 -39 -36 -33
0.6 0.7 0.8 0.9 1.0
Q=1163 kJ/mol
Θ
The expected density can be obtained by finding the ordinate value at that point. On the other hand, if the final desired density is known, it is possible to find out the corresponding Θ value from the abscissa of the master sintering curve and thereafter to plan the sintering schedule [16].
3.3 Microstructure evolution prediction using MSC
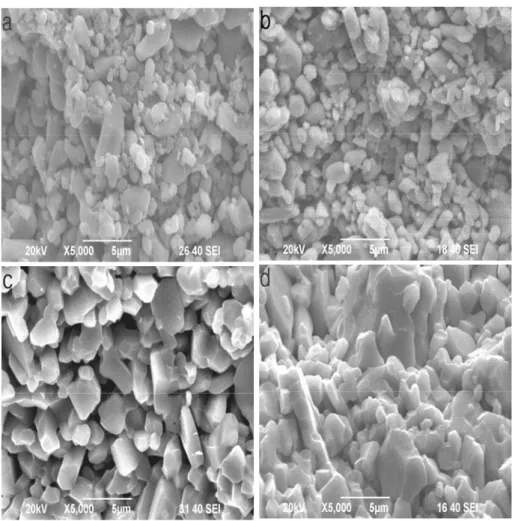
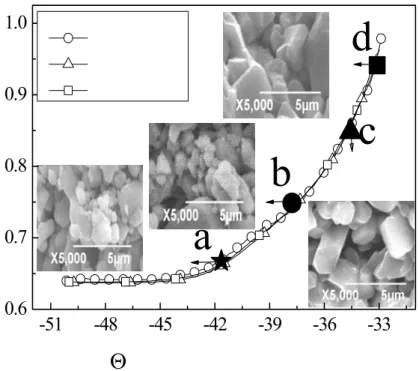
Fig. 6(a)–(d) shows SEM micrographs of the fractured surfaces of the specimens sintered at 1°C /min to 1250°C, 3°C/min to 1420°C, 4°C /min to 1575°C and 5°C /min to1650°C without holding dwell time. Based on SEM images, the microstructure is characterized by the presence of coarser α-Al O2 3 particles (2–4μm) and finer particles
(1-2μm) in Fig. 6(a) and (b). The densities of all the sintered specimens were measured according to the Archimedes principle in distilled water. The Archimedes densities of samples by heating at 1°C /min to 1250°C and 3°C/min to 1420°C without holding dwell time were determined to be 2.67 and 2.99g/cm3.
A comparison of Fig. 6(c) and (d) indicates that the density for specimen by heating at 4°C /min to 1575°C are relatively lower (3.39 g/cm3) than that for the specimen by heating at 5°C /min to1650°C (3.78g/cm3). The average α-Al O2 3 grain size in the Fig. 6(c) appears to be
around 2.5–5μm, while the presence of coarser α-Al2O3 grains of sizes 5μm or more can be
noted in the Fig. 6(d). Moreover, the fractographs reveal the transgranular fracture of α-Al O2 3
particles in Fig. 6(c) and (d), and predominantly intergranular fracture of α-Al O2 3 grains in
V V b b
3 4
d
(
d
D
D
L
L t
kT
G
G
δ
γ
)
Γ
Γ
Ω
−
=
+
(4)
Where dL/(Ldt) is the linear shrinkage rate, γ the surface energy, Ω the atomic volume, k the Boltzmann constant, G the mean grain diameter, D and Dv b the coefficients for volume and
grain boundary diffusion, respectively, and
δ
the width of the grain boundary. Γb and Γv thescaling parameters that represents a specific feature of the microstructure that influences the kinetics of sintering. They contain information that describes the driving force of the microstructure for sintering (curvature), efficiency for diffusional transport (mean diffusion distance and area available for diffusion), and the rate at which mass transport is converted to shrinkage (base to centroid distance and grain-boundary area). Taken together, Γb and Γv
define the linear shrinkage rate which will be experienced by such a microstructure for given scale, temperature, and material parameters. Experiments on sintering of nickel [20] and alumina [21] have demonstrated that the Γ parameters in Eq. (4) are functions only of density. Although this assumption has not been justified generally, those examples seem to indicate that it can be accepted at least as a first approximation.
Fig. 6 SEM fractographs of the specimens sintered at different heating rates to the peak temperatures. (a)1°C/min to 1250°C, (b)3°C/min to 1420°C, (c)4°C /min to 1575°C, (d)5°C /min to 1650°C
stage-sintering model provides a basis for analysis of sintering in compacts that extends beyond the simplified single-stage models. Most of the sintering models can be used to evaluate the value of the activation energy of sintering. It is conventionally obtained using shrinkage-rate data from either isothermal-heating or constant-shrinkage-rate experiments based on the Arrhenius theory. There are two assumptions (One diffusion mechanism is dominant; Grain size is independent of density) to calculate activation energy based on the combined stage-sintering model. An alternative method used in the present work is to estimate the activation energy on the basis of the MSC. It is assumed that G and Γ values are functions only of density [8].
About the assumption that microstructure evolution (both grain size and geometry) is dependent only on density for any given powder and green-body process and that one diffusion mechanism dominates in the sintering process, its’ validity has been clarified widely. There exists evidence from sintering experiments on both metals (copper [22] and nickel [20]) and ceramics (Al2O3 [21], BeO and ZnO [22]) that the average grain size is a
function only of density for a given compact and is independent of the sintering temperature and heating rate. Coble and Gupta [23] have considered this as evidence that both the grain-growth and the densification mechanisms had the same activation energy. Lange and Kellett [24] made a theoretical approach to this property with a linear array of spheres. Reduction in surface area and evolution of average pore size are very important characteristics related to microstructure evolution during sintering. Allen et al [25] have observed in a neutron-scattering study that reduction of the surface area during sintering is dependent only on density for the same batch of powder. Chen and Mayo [26] have found that the average pore size (obtained from mercury intrusion experiments)-density trajectory for ZrO2 compacts is
independent of the thermal history.
d
c
b
a
-51
-48
-45
-42
-39
-36
-33
0.6
0.7
0.8
0.9
1.0
Θ
The principal contribution of the combined-stage sintering model is that the description of the microstructural geometry has been generated so that densification can be described through all stages of sintering. In addition, by expressing geometry in terms of well-defined scaling factors, the geometrical parameters are related directly to specific features of the microstructure. Fig. 7 shows the microstructure evolution in different sintering profiles in the MSC curve. If the heating profiles are given, the Θ value can be calculated by Eq.(1). Then, according to Fig. 7, it is possible to predict the final relative density and microstructure of samples sintered in different heating profiles. On the other hand, the Θ value can be determined according to the required density and microstructure. Then, the heating procedure can be determined.
4. Conclusions
The densification of α-alumina with an average grain size of 2.5μm in diameter was studied by pressureless sintering at a low heating rate. The density continuously determined by a dilatometer during sintering was plotted against the integral of a temperature function over time, Θ(t, T(t)). It agreed well with the densities determined by the Archimedes method after sintering with different heating histories. It is proved that the density profile versus time–temperature integral values, Θ, can be used to predict the final density regardless of the heating history.
The sintered microstructure is a function of the time-temperature sintering conditions, and it is verified that there exists a link between sintered density and microstructure. The MSC can be used to predict and control microstructure evolution during sintering of α-Al2O3
ceramics. On the other hand, the MSC theory can be applied to design a reproducible process to fabricate controlled density and microstructure α-Al2O3 ceramics.
Acknowledgments
The financial support by the Natural Science Foundation (05-1-JC-89), Qingdao (China), is gratefully acknowledged.
References
1. K.G. Ewsuk, J.G. Argüello, D. H. Zeuch, B. Farber, L. Carinci, J. Kaniuk, J. Keller, C. Cloutier, B. Gold, R. B. Cass, J. D. French, B. Dinger, W. Blumenthal, Bull. Am. Ceram. Soc., 80 (2001) 53.
2. K.G. Ewsuk, J.G. Argüello, D.N. Bencoe, D. T. Ellerby, S. J. Glass, D. H. Zeuch, J. Anderson, Bull. Am. Ceram. Soc., 82 (2003) 41.
3. K.G. Ewsuk, J.G. Argüello, Key. Eng. Mater., 264 (2004) 149. 4. R.L. Coble, J. Appl. Phys., 32 (1961) 787.
5. J. Hansen, R.P. Rusin, M.H.Teng, D. L. Johnson, J. Am. Ceram. Soc., 75 (1992) 1129.
6. M.F. Ashby, Acta. Metall., 22 (1974) 275.
7. E. Artz, M.F. Ashby, K.E. Easterling, Metall. Trans A., 14 (1983) 211. 8. H. Su, D.L. Johnson, J. Am. Ceram. Soc., 79 (1996) 3211.
9. K.G. Ewsuk, J.G. Argüello, Key. Eng. Mater., 247 (2003) 27.
Forum, 494 (2005) 417.
12.C.B. DiAntonio, K.G. Ewsuk, Ceram. Trans., 157 (2005) 15.
13.J. Tatami, Y. Suzuki, T. Wakihara, T.Meguro, K. Komeya, Key Engineering Materials, 317-318 (2006) 11.
14.T.R.G. Kutty, K.B. Khan, P.V. Hegde, J. Banerjee, A. K. Sengupta, S. Majumdar, H. S. Kamath, J. Nucl. Mater., 327 (2004) 211.
15.T.R.G. Kutty, P.V. Hegde, K.B. Khan, U. Basak, S. N. Pillai, A. K. Sengupta, G. C. Jain, S. Majumdar, H. S. Kamath, D. S. C. Purushotham, J. Nucl. Mater., 305 (2002) 159.
16.J.J. Host, M.H. Teng, B.R. Elliott, J. H. Hwang, T. O. Mason, D. L. Johnson, V. P. Dravid, J. Mater. Res., 12 (1997) 1268.
17.S.J. Park, R.M. German, Int. J. Materials and Structural Integrity, 1 (2007) 128. 18.J.D. Wang, R. Raj, J. Am. Ceram. Soc., 73 (1990) 1172.
19.T.T. Fang, J.T. Shive, F.S. Shiau, J. Mater. Chem. Phys., 80 (2003) 108.
20.R.P. Rusin, Sintering of Nickel Powder With or Without Dispersed Alumina Particles, Ph.D. Dissertation, Northwestern University, Evanston, IL, June 1993. 21.H. Su, D.L. Johnson, J. Am. Ceram. Soc., 79 (1996) 3199.
22.T.K. Gupta, J. Am. Ceram. Soc., 55 (1972) 276.
23.G.C. Kuczynski, N.A. Hooton, C.F. Gibbon, Sintering and related phenomena, Gorden and Breach Press, New York, 1967. (in English)
24.F.F. Lange, B.J. Kellett, J. Am. Ceram. Soc., 72 (1989) 735.
25.A.J. Allen, G.G. Long, S. Krueger, The microstructure of nanophase and mm-grain ceramics during sintering, Presented at the 97th Annual Meeting of the American Ceramic Society, Cincinnati, OH, May 3, 1995 (Microstructure development and sintering symposium, Paper No. SXV-29-95).
26.D.-J. Chen, M.J. Mayo, J. Am. Ceram. Soc., 79 ( 1996) 906.
Са р а: М ј ј
ј ј
. З α-Al2O3 2.5 μm
0.5, 2 5oC/min. У ј
.
ј .
А ј ј
. С ј ј
ђ ј ђ . М
ђ ј
α-Al2O3 .
К учн р чи: α-Al2O3, , ,