RESEARCH ARTICLE
Label-Free Protein-RNA Interactome Analysis
Identifies Khsrp Signaling Downstream of the
p38/Mk2 Kinase Complex as a Critical
Modulator of Cell Cycle Progression
Jorge Boucas1,2☯*, Christian Fritz1,2☯, Anna Schmitt1,2, Arina Riabinska1,2, Lisa Thelen1,2, Martin Peifer3,4, Uschi Leeser1,2, Peter Nuernberg2,3,5, Janine Altmueller5,
Matthias Gaestel6, Christoph Dieterich7‡, H. Christian Reinhardt1,2‡*
1Department I of Internal Medicine, University Hospital of Cologne, Weyertal 115B, 50931, Cologne, Germany,2Cologne Excellence Cluster on Cellular Stress Response in Aging-Associated Diseases, University of Cologne, Weyertal 115B, 50931, Cologne, Germany,3Center for Molecular Medicine Cologne (CMMC), University of Cologne, Cologne, Germany,4Department of Translational Genomics, University of Cologne, Cologne, Germany,5Cologne Center for Genomics (CCG), University of Cologne, Cologne, Germany,6Institute of Biochemistry, Hannover Medical School, Hannover, Germany,7Computational RNA Biology and Ageing, Max Planck Institute for Biology of Ageing, Joseph-Stelzmann Straße 9b, 50913, Cologne, Germany
☯These authors contributed equally to this work. ‡These authors also contributed equally to this work.
*[email protected](HCR);[email protected](JB)
Abstract
Growing evidence suggests a key role for RNA binding proteins (RBPs) in genome stability programs. Additionally, recent developments in RNA sequencing technologies, as well as mass-spectrometry techniques, have greatly expanded our knowledge on proteRNA in-teractions. We here use full transcriptome sequencing and label-free LC/MS/MS to identify global changes in protein-RNA interactions in response to etoposide-induced genotoxic stress. We show that RBPs have distinct binding patterns in response to genotoxic stress and that inactivation of the RBP regulator module, p38/MK2, can affect the entire spectrum of protein-RNA interactions that take place in response to stress. In addition to validating the role of known RBPs like Srsf1, Srsf2, Elavl1 in the genotoxic stress response, we add a new collection of RBPs to the DNA damage response. We identify Khsrp as a highly regulat-ed RBP in response to genotoxic stress and further validate its role as a driver of the G1/S
transition through the suppression ofCdkn1aP21transcripts. Finally, we identify KHSRP as an indicator of overall survival, as well as disease free survival in glioblastoma multiforme.
Introduction
In response to genotoxic stress, cells activate a complex, kinase-based signaling network, which is commonly referred to as the DNA damage response (DDR) [1,2]. To ensure that DNA has OPEN ACCESS
Citation:Boucas J, Fritz C, Schmitt A, Riabinska A, Thelen L, Peifer M, et al. (2015) Label-Free Protein-RNA Interactome Analysis Identifies Khsrp Signaling Downstream of the p38/Mk2 Kinase Complex as a Critical Modulator of Cell Cycle Progression. PLoS ONE 10(5): e0125745. doi:10.1371/journal. pone.0125745
Academic Editor:Michael Shing-Yan Huen, The University of Hong Kong, HONG KONG
Received:December 8, 2014
Accepted:March 26, 2015
Published:May 20, 2015
Copyright:© 2015 Boucas et al. This is an open access article distributed under the terms of the
Creative Commons Attribution License, which permits unrestricted use, distribution, and reproduction in any medium, provided the original author and source are credited.
Data Availability Statement:All relevant data are within the paper and its Supporting Information files.
been fully replicated in an undamaged state before distribution to both daughters, cells progress through a series of highly conserved cell cycle checkpoints prior to mitosis [3–5]. These check-points allow time to repair genotoxic lesions, or, if damage is excessive, lead to the induction of apoptosis [3,4]. Thus, checkpoint signaling can be seen as an effective fail-safe mechanism to provide genome stability through cell cycle arrest with subsequent DNA repair, or apoptotic elimination of mutated, incipient cancer cells. The canonical DDR network consists of two major kinase signaling branches, which operate through the upstream kinases ATR (ATM--Rad3 related) and ATM (ataxia telangiectasia mutated), as well as their downstream effector ki-nases CHK1 and CHK2, respectively [1,2,6–8]. In addition to these core pillars of the DDR, a third checkpoint effector pathway, mediated through TAO- and p38-dependent MK2 activity, was recently identified [9–12]. The p38/MK2 pathway is a global stress-kinase pathway that operates in parallel to CHK1. In response to DNA damage, this pathway is recruited as part of the ATM/ATR-dependent checkpoint network [11–14]. CHK1 and MK2 control checkpoint initiation and maintenance, respectively [15]. The activity of both kinases converges on medi-ating inhibitory phosphorylations on CDC25 family members [10,16–18]. Specifically, CHK1-and MK2-dependent CDC25B phosphorylation on Ser-323 leads to the generation of a 14-3-3 binding epitope [10,19,20]. Upon 14-3-3 engagement, CDC25B is sequestered into the cyto-plasm, away from its nuclear CDK substrates [21]. Thus, CHK1 and MK2 mediate inactivation of CDC25B and induce a cell cycle arrest by blocking CDC25B-dependent CDK activation [5].
Recently, the intimate connection between the DDR and post-transcriptional control of gene expression was highlighted through a proteomic analysis that identified proteins phos-phorylated by the proximal DDR kinases ATM and ATR [22]. This screen revealed ~700 sub-strates, most of which belonging to pathways implicated in RNA metabolism [22]. Another proteomic analysis quantifying DNA damage-regulated alterations of the proteome, phospho-proteome and acetylome in response to etoposide resulted in a significant fraction of alter-ations involved in RNA metabolism [23].
Interestingly, a large number of RNA binding proteins (RBPs) have been shown to be di-rectly or indidi-rectly regulated by MK2 [5,9–12,24,25]. Acting downstream of ATM and ATR, the p38/MK2 module is required to prevent G1/S, intra-S phase and G2/M transition after
cis-platin and doxorubicin treatment in p53-deficient cells [11]. Following DNA damage, the p38/ MK2 complex is exported to the cytoplasm, where it phosphorylates several RBPs, including PARN, TIAR and hnRNP A0 [15,24,26]. As a result of these phosphorylation events, the com-mon mRNA client Gadd45a is stabilized leading to an increased expression of GADD45A pro-tein levels, ultimately maintaining the p38/MK2 module in an active state through a positive feedback loop [15,24,26]. In addition to its role in maintaining p38/MK2 activity, GADD45A has also been shown to be a potent CDK inhibitor [27,28].
Here, we show how label-free LC/MS/MS can be used for the profiling of functional RBP-mRNA interactome changes in response to genotoxic stress induced by etoposide. We further demonstrate how known RBP-mRNA interactions can be used together with transcriptomics to infer RBP activity. We show how changes in one regulator of RBPs, Mk2, can affect the over-all spectrum of protein-RNA interactions in response to etoposide and how the RBP KHSRP contributes to DDR signaling through the regulation ofCdkn1aP21.
Materials and Methods
Cell culture
Mouse embryonic fibroblasts (MEFs) were isolated as described previously [29], and cultured in high-glucose DMEM supplemented with 10% heat-inactivated FBS, 1% HEPES, 100 U/mL penicillin, and 100μg/mL treptomycin (Gibco). Cells were treated with either etoposide
Deutsche Jose Carreras Stiftung (DJCLS-R12/26 to H.C.R.).
(Sigma, E1383) or DMSO (vehicle / mock control; Carl Roth, A994.2). Mk2/3 knock out ani-mals were previously published and were a kind gift from Matthias Gaestel at the Hannover Medical School [30].Khsrp-/-MEFs were previously published and were a kind gift from Ching-Yi Chen at the University of Alabama at Birmingham [31]. Colony formation assays were performed as previously described [11]. Animal keeping was authorized by the“ Lande-samt für Natur, Umwelt und Verbraucherschutz Nordrhein-Westfalen”with the license 87–
51.04.2010.A006.
RNA isolation, sequencing, and qPCRs
RNA isolation was done using TRIzol reagent (Invitrogen, 15596–026) in agreement with man-ufacturer instructions. For RNA-sequencing RNA was further purified using a TruSeq Strand-ed Total RNA LT kit (with Ribo-Zero Human/Mouse/Rat). 1ug of total RNA was usStrand-ed as input material and hybridization-based negative enrichment of ribosomal sequences was performed. Afterwards, RNA fragmentation took place using divalent cations under elevated temperature. The RNA fragments underwent reverse transcription using random primers. This was followed by second strand cDNA synthesis with DNA Polymerase I and RNase H. To obtain strand specificity, a modified base is incorporated in this step. After end repair and A-tailing, indexing adapters were ligated, and the strand containing the modified base was digested. The products were then purified and amplified (15 PCR cycles) to create the final strand specific cDNA li-braries. After validation (Agilent 2200 TapeStation) and quantification (Invitrogen Qubit Sys-tem) we pooled 8 trancriptome libraries each. The pools were quantified by using the Peqlab KAPA Library Quantification Kit and the Applied Biosystems 7900HT Sequence Detection System. One pool was loaded on one lane of a Hiseq2000 sequencer and sequenced with a 2x100bp v3 protocol. We produced 4,1–6.5Gb/sample (41M-65M read paires). Basic read qual-ity check was carried out using FastQC showing 86–90% of Q30 bases (PF) and a mean quality score between 34.1–35.2 (PF). Differential gene and transcript expression analysis was done using TopHat and Cufflinks [32]. Data can be accessed at the Gene Expression Omnibus under the access number GSE67266. Influence plots were done using the data contained on“The Atlas of UTR Regulatory Activity (AURA)”[33] and human and mouse homology tables from the mouse genome database [34]. Ontology analysis was done using DAVID [35,36]. For real-time quantitative PCR (RT-qPCR), reverse transcription was performed using SuperScript VILO cDNA Synthesis Kit (Life Technologies, #11754050). RT-qPCRs were performed using Power SYBR Green (Life Technologies, #4367659) on an AB 7300 Real Time PCR System (Life Technologies).Cdkn1aforward primer: CTA TCA CTC CAA GCG CAG AT;Cdkn1areverse primer: gca gcg tat ata cag gag acg;Gapdhforward primer: CCA ATG TGT CCG TCG TGG ATC T;Gapdhreverse primer: GTT GAA GTC GCA GGA GAC AAC C.
Protein-RNA interactome assay
Protein-RNA crosslinking, and protein purification was performed as previously described [37]. For each replicate 4.0x10⁸cells in 40 15cm dishes were UV irradiated at a wavelength of 254 nm with 200mJ/cm2using a Bio-Link BLX 254 (peqLab). 250μg of protein were disgested in
solu-tion using trypsin. Afterwards, 1μg of peptide per sample was analyzed by nano LC/MS/MS
with a Waters NanoAcquity HPLC system interfaced to a ThermoFisher Q Exactive. Peptides were loaded on a trapping column and eluted over a 75μm analytical column at 350nL/min;
both columns were packed with Jupiter Proteo resin (Phenomenex). A 4h gradient was em-ployed. The mass spectrometer was operated in data-dependent mode, with MS and MS/MS performed in the Orbitrap at 70,000 FWHM and 17,500 FWHM resolution, respectively. The fifteen most abundant ions were selected for MS/MS. Data were processed through MaxQuant
software [38,39]. Protein-protein based network expansion was performed using GeneMANIA [40].
Cell cycle analysis, immunostainings
Cell cycle analysis was done using a Gallios flow cytometer (Beckman Coulter) and PI. After treatment, cells were washed twice in ice-cold PBS, trypsinized and fixed in 90% Methanol overnight at -20°C, permeabilized with PBS containing 0.25% Triton X-100 for 20 min at 4°C, blocked with 10% BSA in PBS and incubated with 1μg of anti-phospho-histone H3 (Millipore,
#16–218) or anti-gammaH2AX (Abcam, ab22551) per 106cells for 60 min on ice. Following washing, cells were incubated with FITC-conjugated secondary antibody (Millipore, #12–506) for 30 min on ice, washed, and resuspended in PBS containing RNase and 50μg/ml PI prior
to analysis.
Immunoprecipitations and Western blotting
For RNA immunoprecipitations (RIP) protein-RNA crosslinking was performed as described above. Protein extraction was performed using cell lysis buffer in agreement with manufacturer instructions (Cell Signaling Technology, 9803) supplemented with RNase inhibitor (Thermo Scientific, #EO0381). Dynabeads Protein G Immunoprecipitation Kit was used in agreement with manufacturer instructions (Life Technologies, #10007D). 50μl Dynabeads were incubated
4μg anti-Khsrp antibody (Biomol, #A302-021A) in a final volume of 200μl. After 30’
incuba-tion at room temperature (RT) and rotating, supernatant (SN) was removed and 200μg protein
added to a final volume of 900μl. Samples were incubated overnight, rotating, and washed with
1ml IP wash buffer (50mM HEPES-KOH, pH 7.5; 300mM KCl; 0.05% (v/v) NP40; 0.5mM DTT). Precipitates were then washed twice with high-salt wash buffer (50mM HEPES-KOH, pH 7.5; 500 mM KCl; 0.05% (v/v) NP40; 0.5mM DTT), resuspended in 1ml IP wash buffer and transferred to a clean reaction tube. After two PBS washes, RNA was eluted by incubation for 1h and 37°C with elution buffer (10mM Tris-HCl, pH 7.5; 1mM EDTA; 1% SDS; 4 mg/ml pro-teinase K). Afterwards, 400μl RNA phenol (Ambion, #9710) and 130μl of CHCl3 were added
and standard phenol/chloroform RNA extraction performed. After collection of the aqueous phase 50μl of 3M NaOAc pH 5.2, 0.5μl of glycogen (Ambion, #9510) and 1ml of 1:1
EtOH:Iso-propanol solution was added for overnight RNA precipitation and -20°C. After 10’at 12000 G RNA pellets were washed twice with 500μl cold 75% EtOH, pellet dried and resuspended in
20μl H2O for 10’at 58μC. RT-qPCRs were performed as described above. Total amounts of
Cdkn1aP21were normalized to whole Gapdh levels. Standard Western blotting was performed using the following antibodies: anti-P21, Santa Cruz Biotechnology, #sc-397; anti-Khsrp, Bio-mol, #A302-021A; anti-β-Actin, Sigma, #A5316.
Results
Etoposide-induced protein-RNA interactome changes
Mounting evidence for a role of RBPs in the DDR, as wells as the growing number of identified RBPs led us to the characterization of the changes in the protein-RNA interactome in response to DNA damage. For this purpose, primary MEFs from 13.5 days old embryos were treated with the DSB-inducing topoisomerase-II inhibitor etoposide (20μM). The occurrence of
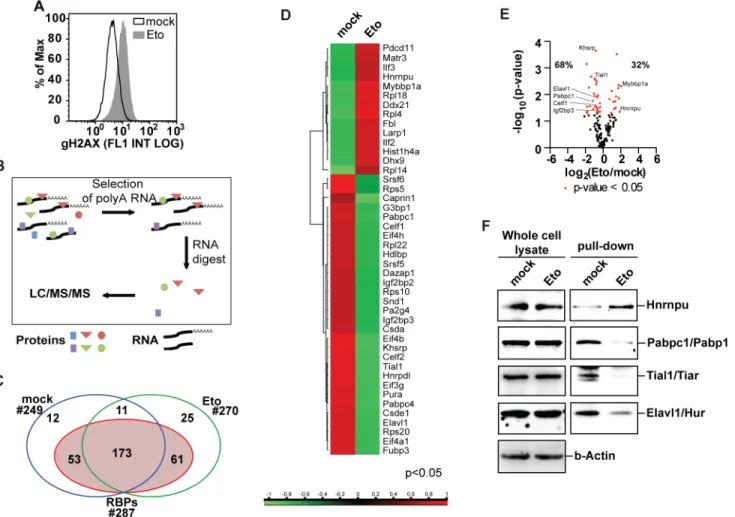
using oligo-dT-coated magnetic beads (Fig 1B). Co-purified proteins were subsequently sub-mitted to label-free quantification LC/MS/MS. Of the 335 obtained protein group hits, 287 contained proteins previously identified as RBPs (Fig 1C). Of the 184 RBPs present in both the untreated and etoposide-exposed samples, 44 RBPs were significantly altered in their abun-dance with RNA following etoposide (Fig 1C–1E). We next validated these mass
spectrome-try-derived differences using immunoblotting. As shown inFig 1F, protein levels in whole cell lysates showed no change in response to etoposide treatment, while the etoposide-induced changes that were observed in the RNA-bound fractions could be reproduced by immunoblot-ting. These data suggest that the interaction between the RBPs under investigation and their client mRNAs is indeed altered after genotoxic stress (Fig 1F, left panel). Further corroborating this hypothesis, transcript levels of RBPs showing differential protein-RNA interaction, were also not changed (S3 Table). Thus, etoposide treatment induces protein-RNA interactome changes that can be identified by label-free LC/MS/MS and validated by immunoblotting.
Fig 1. Changes in protein-RNA interactions in response to etoposide treatment. (A)Etoposide induces DNA double strand breaks after 6h of treatment as reported by the DSB markerγ-H2AX.(B)Schematics of the experimental procedure for the purification of RBPs show how UV-mediated crosslinking of
RNA to interacting proteins was followed by poly-A selection to identify RBPs through LC/MS/MS.(C)Crosslinking followed by purification of mRNA-interacting proteins and nano LC/MS/MS identified 335 protein group hits of which 287 were known as RBPs.(D)Heat map of differentially abundant RBPs. (E)Vulcano plot representing changes in mRNA-protein interactions in response to etoposide treatment identifies Khsrp as the most significantly changed RBP in response to etoposide treatment.(F)Immunoblot analysis of proteins co-purified with poly-A-containing RNA validates protein-RNA interactome changes identified by label free LC/MS/MS (right panel). Whole cell lysates show no significant changes in protein levels of analyzed RBPs (left panel).
doi:10.1371/journal.pone.0125745.g001
Interestingly, changes in protein-RNA interactions do not correlate with changes in overall protein levels.
Transcriptomics-based identification of differential RBP-client
interactions
We next hypothesized that changes in the transcript levels of client mRNAs are a result of differ-ential RBP activity. For this purpose, cells were either treated with etoposide (20μM, 6hr) or
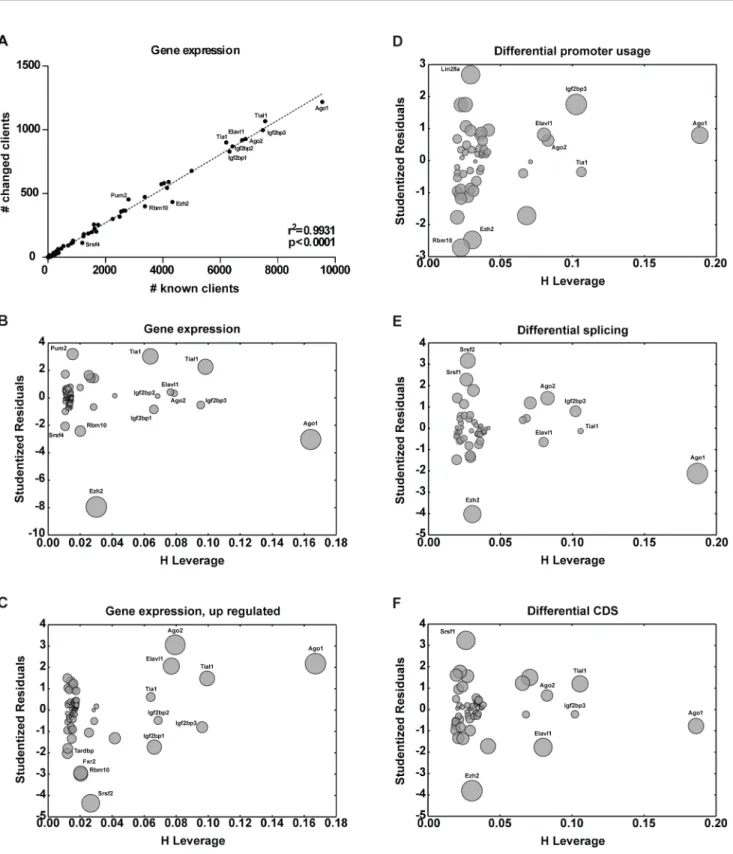
ex-posed to vehicle control. Upon completion of drug exposure, cells were harvested, RNA was isolated and transcriptome analysis was performed using RNA-seq. We then asked how the number of altered mRNA clients for each RBP is correlated to the number of respective known mRNA clients (Fig 2A). Regression analysis identified a linear correlation between the number of known client RNAs and the number of client mRNAs with altered overall expression (known vs. changed; R2= 0.9931, p<0.0001,Fig 2A). Outlying points identified RBPs associated with
stronger changes in client mRNA expression (Fig 2A). Intriguingly, Ago1 emerged as an outlier and as the RBP with the largest number of known targets (Fig 2A). Thus, the large number of known Ago1 clients isolates this point from the remaining population making it difficult to as-sess its relation to the regression. Thus, isolation is better characterized by leverages—the poten-tial for an individual data point to influence the entire model. As with Ago1, the more isolated a data point is, the stronger its potential to influence the model becomes. Cases like Ago1, outliers with a high leverage, have the highest influence on the model, perturb the model, and should be either excluded or taken into account with care. We therefore plotted studentized residuals (a measure of outlyingness [41]) in function of the leverage—influence plots (Fig 2B) [41]. In-terestingly, Tial1, one of the RBPs identified in our interactome analysis emerged as an outlier (Fig 2B). Furthermore, correlation analysis between number of upregulated clients and number of clients with altered expression showed that most Tial1 targets were upregulated (Fig 2C). This is consistent with our interactome analysis showing Tial1 dissociation from RNA and the fact that Tial1 is a component of SGs where RNAs are sequestered until degraded or released once a stress response is terminated [42].
Transcripts produced by RNA polymerase II (PolII) are subject to multiple processing steps, including maturation of 5’and 3’ends and splicing, followed by transport to the cyto-plasm [43–48]. Correlation analysis involving the different steps of RNA maturation was re-vealing of the above-introduced roles of Srsf1 and Srsf2 in the regulation of differential splicing in response to etoposide (Fig 2E and 2F) [43–48]. To further understand the orchestration of post-transcriptional events involved in the DDR, we investigated the possibility of different transcripts being targeted to RBPs by transcriptional activation dependent on differential pro-moter usage (Fig 2D). Interestingly, Lin28a, Ezh2, and Rbm10 emerged as outliers suggesting a role for differential promoter usage of client transcripts in the function of these RBPs. Together with transcriptome analysis of RBPs and protein-RNA interactome analysis, our transcrip-tomic based analysis of RBP activity contributes to characterization of the RBP-mediated re-sponse to etoposide treatment.
Fig 2. Inference of outlying RBP-client interactions from changes in client transcripts. (A)Using gene expression levels, numbers of altered client mRNAs were plotted against number of known client mRNAs for each respective RBP. A linear correlation could be identified between the number of changed client mRNAs and known client mRNAs.(B)Studentized residuals (outlyingness), leverage (potential to influence the linear model) and influence analysis (represented by the size to point) are represented through influence plots. Data points perturbing the model were identified by high leverage and studentized residuals. Outliers representing RBPs with higher number of changed client mRNAs were identified through high absolute values of standardized residuals. The same was done by(C)plotting number of upregulated clients against number of changed clients, as well as using vector information on(D) differential promoter usage,(E)differential splicing, and(F)differential CDS. DNA damage-related RBPs—Elavl1, Tia1, Tial1, Srsf1, Srsf2 could be identified through RBP-client analysis.
doi:10.1371/journal.pone.0125745.g002
differential expression. While only a limited number of alterations in gene expression could be observed after 1h of treatment (104 genes with p<0.05 and 59 genes with q<0.05), the
expres-sion of 1,808 genes was significantly changed after 6h of etoposide treatment (p<0.05,Fig 3A,
771 genes with q<0.05). In agreement with the known role and upregulation ofCdkn1aP21in
the DDR,Cdkn1aP21was transcriptionally upregulated following etoposide treatment (2.2 fold, p = 5.0x10-05). Probably not surprising, GO term analysis revealed a significant enrichment for transcripts involved in cell cycle regulation among the genes with altered expression after eto-poside exposure (Fig 3A). We then investigated the possibility of protein-protein interactions being the basis of the observed interactome changes. To directly address this, we used Gene-MANIA [40] to perform protein-protein based network expansion of the 44 differentially abundant RBPs using linear regression to automatically choose genes that promote the highest number of interactions. GO analysis of the expanded network identified cyclin-dependent pro-tein processes amongst the most significantly enriched processes (Fig 3B). In agreement with this Cdkn1aP21, as well as Cdk1, Cdk2 and Cdk4 emerged as part of the generated network. (Fig 3B). These data connect RBPs to cell cycle regulation during the response to etoposide treatment.
In agreement with the enrichment of GO terms emerging from transcriptome and interac-tome analysis, etoposide treatment of MEFs (20μM, 24hr) resulted in an accumulation of
phos-pho-histone H3-negative cells with 4N DNA content, indicating a G2/M arrest (Fig 3C).
Furthermore, primary MEFs treated with etoposide showed a significant drop of the mitotic index (Fig 3C). Transcriptome and interactome profiling emerged therefore as two useful tools for the characterization of changes involved in the etoposide-driven G2/M arrest.
Mk2/3-mediated regulation of RBPs
We and others have shown that the checkpoint effector kinase pathway that is governed by p38α/β-dependent activation of MK2 is activated in response to DNA-damaging agents, such as UV and different chemotherapeutic drugs [5,9–12,24,25]. Interestingly, our protein-RNA interactome analysis revealed that the known p38 targets, Elavl1 [50], Khsrp [51], Tial1 [25], as well as the MK2 target Pabpc1 [52], are differentially bound to RNA in response to etoposide. To directly investigate the impact of the p38/Mk2 kinase complex on the RBP-RNA interac-tome, we isolated MEFs fromMk2/3knock-out (KO) mice and investigated the interactome changes in response to etoposide treatment (Fig 4A). In contrast to wildtype cells, the p38- and Mk2 targets, Elavl1, Pabpc1 and Khsrp could be co-purified in higher amounts with poly-A-containing RNA onceMk2/3KO cells were treated with etoposide (Fig 4A, p<0.05). Thus,
Ckdn1aP21mRNA bound to Khsrp were observed in non-treatedMk2/3KO cells, when com-pared to untreated wildtype cells. Cell cycle analysis revealed that despite a functional G2/M
ar-rest in response to etoposide treatment (indicated by a stably repressed mitotic index),Mk2/3 KO cells display a decreased G1and increased G2population, when left untreated (Fig 4C and 4D). Thus,Mk2/3KO MEFs display a defect in cell cycle regulation that either promotes a faster progression through G1or a slower progression through G2. In agreement with the latter,
hematopoietic stem cells derived fromMk2KO mice have been previously shown to display in-creased proliferation rates and a diminished G1population [54]. As a faster progression
through G1can be the result of lower Cdkn1aP21levels, we investigated the changes in mRNA
and protein levels ofCdkn1ain wildtype andMk2/3KO cells (Fig 4E and 4F). Interestingly, while mRNA levels inMk2/3KO cells fully copied the values observed in wildtype cells,Mk2/3 KO cells showed decreased Cdkn1aP21protein levels and a complete lack of Cdkn1aP21 upregu-lation in response to genotoxic stress (Fig 4E and 4F). Thus, in agreement with the changes in protein-RNA interactions seen uponMk2/3deletion, transcript and protein levels of
Fig 3. Murine embryonic fibroblasts arrest in G2in response to etoposide treatment. (A)Gene expression changes identified by RNA-Seq following 6h of treatment with 20μM etoposide were analyzed for
enrichments in GO terms. Cell cycle, and specifically mitotic processes, emerged in the top 10 most significant GO terms.(B)Protein-protein interactions-based network expansion of RBPs showing differential protein-RNA interactions upon etoposide treatment identifies enrichments for cyclin-dependent processes. (C)Cell cycle analysis of untreated (black line) and etoposide-treated (gray) cells reveals an accumulation of cells with 4N DNA content and decreased staining of the mitotic marker pHH3.
doi:10.1371/journal.pone.0125745.g003
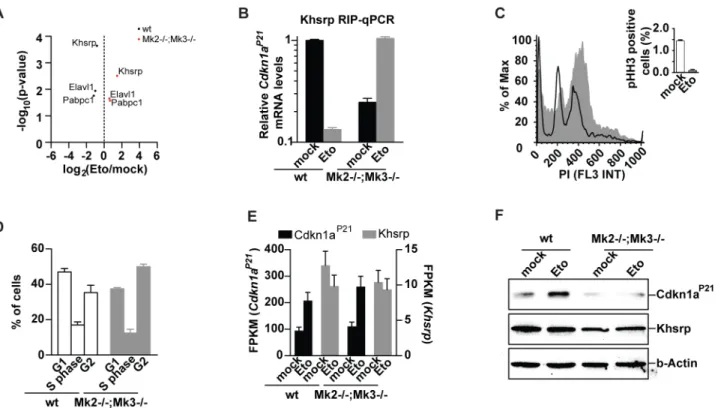
Fig 4. Mk2/3-dependent regulation of Khsrp andCdkn1ap21. (A)Mk2-/-;Mk3-/-cells show a differential protein-RNA interactome in response to etoposide exposure when compared to wildtype cells (most-significant changes are highlighted).(B)KhsrpRNA immunoprecipitations (RIP) followed byCdkn1aP21 qPCR validates interactome changes seen in wildtype andMk2-/-;Mk3-/-cells upon etoposide treatment. Upon etoposide exposure Khsrp is released from
Cdkn1aP21transcripts. In contrast, inMk2-/-;Mk3-/-MEFs, Khsrp-boundCdkn1aP21transcripts increase upon etoposide exposure.(C)Despite a typical arrest in G2upon etoposide treatment,(D)Mk2-/-;Mk3-/-MEFs show a decreased G1population in comparison to wt cells.(E)Increased levels of the Cdkn1aP21transcript inMk2-/-;Mk3-/-cells upon etoposide treatment(F)fail to promote the upregulation of Cdkn1aP21protein levels seen in wildtype cells.
Cdkn1aP21appear to be uncoupled inMk2/3KO cells further suggesting a role for RBPs in the translational control of Cdkn1aP21. These results add another piece of evidence to the notion thatCdkn1aP21is post-transcriptionally regulated in response to DNA damage and particularly etoposide [24,55].
KHSRP-mediated control of cell cycle
Cells with a deficient p38/Mk2 module show an overall altered interaction between Khsrp and poly-A-containing RNAs (Fig 4A). Interestingly, suchMk2/3KO cells have decreased G1
pop-ulations and lower protein levels of the G1regulator and Khsrp client Cdkn1aP21(Fig 4F). To
further investigate the role of Khsrp in cell cycle regulation, we performed cell cycle analysis of Khsrp-deficient MEFs (Fig 5A).KhsrpKO MEFs showed an increase in G1population and
lower mitotic index, indicative of a reduced proliferation rate due to a delayed G1/S transition
(Fig 5A and 5B). In agreement with this, Cdkn1aP21protein levels were higher inKhsrpKO than in wildtype cells. Interestingly, transcript levels ofCdkn1aP21remained equal between KhsrpKO and wt cells (Fig 5C and 5D). Despite a delayed G1/S transitionKhsrpKO cells do
arrest in G2upon exposure to etoposide (S3 Fig). Nonetheless, a significant etoposide
resis-tance can be seen inKhsrp-/-cells (S4 Fig). These results outline the relevance of Khsrp in the post-transcriptional regulation of Cdkn1aP21and control of the cell cycle.
KHSRP as and indicator of overall survival and disease-free survival
The transformation of a normal cell into a cancerous cell is often the result of altered function of proteins involved in cell division [56]. A crucial example is the inactivation ofTP53, a tran-scriptional activator of the cell cycle regulatorCDKN1AP21[57]. It is than plausible to hypothe-size that otherCDKN1AP21regulators might also have a role in malignancy. Thus, we pursued the possibility of an association between theCDKN1AP21post-transcriptional regulator KHSRP and known malignancies. To this end, we recurred to the“cBioPortal for Cancer Geno-mics”to extract data generated by“The Cancer Genome Atlas Research Network”(TCGA) [58,59]. Gene expression data for cases with associated clinical data revealed thatKHSRP ex-pression can be used as an indicator of overall survival (OS) and disease free survival (DFS) for glioblastoma multiforme patients (Fig 6A and 6B). Patients bearing tumors with lower levels ofKHSRPtranscripts showed a decreased OS consistent with a decreased DFS (p<0.0001 andp = 0.0015). In agreement with the increased G1population and reduced mitotic index in
KhsrpKO cells (Fig 5B), tumors with reducedKHSRPexpression might display higher levels of the CDKN1AP21protein and delayed G1progression. However, when usingCDKN1AP21
gene expression as a stratifier, OS and DFS were not significantly different between those pa-tients that expressed high levels ofCDKN1AP21and this with reduced expression (Fig 6C and 6D). We note that KHSRP is regulating not onlyCDKN1AP21mRNA levels, but controls a plethora of different target genes [60]. We thus speculate that the net effect of KHSRP loss might not phenocopy the loss ofCDKN1AP21. Although we could not observe the same signifi-cance levels in the current available data for other tumor entities (S7 Table), the indicative power ofKHSRPin DFS and OS in glioblastoma multiforme further suggests a strong role for this gene in the maintenance of genome stability.
Discussion
Mounting evidence collected over the last few years supports the idea that RBPs involved in dif-ferent steps of mRNA biogenesis, translation and degradation can affect genome stability pro-grams [22,43,61,62]. Here, we employed oligo(dT) pulldowns to profile the changes in the protein-RNA interactome in primary MEFs upon exposure to etoposide (Fig 1). Despite the
Fig 5. Khsrp-dependent regulation ofCdkn1aP21. (A)Cell cycle analysis and(B)mitotic index of wildtype andKhsrp-/-MEFs expose aKhsrp-dependent(A)accumulation of cells in G1and(B)decreased cycling rates.(C)Transcript and(D)protein levels ofCdkn1aP21inKhsrp-/-cells measured by qPCR and immunoblotting reveals an increase of Cdkn1aP21protein levels unrelated toCdkn1aP21mRNA levels.
doi:10.1371/journal.pone.0125745.g005
Fig 6.KHSRPtranscript levels predict survival of human glioblastoma patients. (A)Overall survival (OS) curves and(B)disease free survival (DFS) curves show an increased OS and DFS of patients bearing tumors with higherKHSRPtranscript levels.(C,D)Although not significant, the inverted tendency can be seen when segregating patients in agreement with their tumorCDKN1AP21transcript levels. Upper and lower quartiles are shown.
large number of protein hits identified by others in human cells lines (approx. 1,000 per study) [63–65], we were only able to identify 184 recurrent protein-groups in our interactome study (Fig 1C). While previous studies relied on immortalized human cell lines, we used freshly iso-lated primary MEFs. Another possible reason for the observed differences might be the pres-ence of RNAse in our peptide mixture. While others removed RNAse from the protein mixtures by gel excision and selection of the fragments of interest, we have purposely omitted this step in favor of a higher accuracy of label-free quantification. Of the 335 identified hits, 47 were unique to our study (Fig 1C,S1 Table). Although further work is required to validate these proteins as RBPs our observation points towards a further expansion of the number of known RBPs to 1,549. While immunoblot validation fully supported our LC/MS/MS results, analysis of whole cell lysates revealed that for the studied proteins, etoposide-induced alter-ations in client mRNA binding do not result from changes in overall RBP expression levels (Fig 1F). Thus, the changes in interactome can be the result of changes in the expression pat-terns of the clients (target RNAs), or of signaling events promoting enhanced binding or disso-ciation from the client mRNAs. In agreement with the first, differential promoter usage revealed that the clients of Lin28a, Rbm10, and Ezh2 are expressed through different promoter sequences upon exposure to etoposide (Fig 2D). In support of the latter, protein-protein based network expansion of the significantly changed RBPs revealed that the expanded network is highly enriched for processes involving Cdk activity (Fig 3B).
Using RBP-client interactions catalogued within the AURA database [33], we identify RBPs with etoposide-induced outlying client interactions based on transcript alterations of the re-spective clients. As the number of known clients greatly differs between each RBP, we linear-ized the population by plotting the number of changed clients against the number of known RBPs (changed vs. known clients,Fig 2A). Thisin silicoanalysis allowed us to properly identify RBPs with outlying changes in client mRNA expression, while taking into account the amount of available information for each RBP and its influence on the regression analysis. Interestingly, this approach(Fig 2) identified several RBPs which also showed differential proteRNA in-teractions on our label-free LC/MS/MS assay (Fig 1D): Tia1, Tial1, and Elavl1. The cross-oc-currence of these hits over our interactome and transcriptomics-based analyses strongly enforces a role for these RBPs in the DDR. Intriguingly, Tial1 is known to bind toGadd45a mRNA preventing its association with translating polyribosomes in steady state scenarios [66]. In response to genotoxic stress, translation of GADD45A is then enhanced by dissociation of TIAL1 fromGADD45amRNA [66]. Further, ELAVL1 is known to act as a post-transcriptional regulator in response to genotoxic stress and previous work has shown that UVC exposure re-sults inCDKN1AP21mRNA stabilization through ELAVL1 [67].
MK2 phosphorylation by p38 in response to genotoxic stress drives the export of these two molecules from the nucleus, through the exposure of a nuclear export signal on Mk2 [25,68]. While p38 phosphorylates ELAVL1 [50], KHSRP [51], and TIAL1 [25], MK2 phosphorylates PABPC1 [52], PARN [25], TTP [69], BRF1 [70], and hnRNP A0 [71]. Here we show that dis-ruption of the p38/Mk2 complex throughMk2deletion results in strong protein-RNA interac-tome changes in response to genotoxic stress induced by etoposide (Fig 4A and 4B). InMk2 null cells, the p38 targets Khsrp and Elavl1, as well as the Mk2 target Pabpc11 become more abundant with poly-A-containing RNAs, compared to wildtype cells (Fig 4A and 4B). In agreement with this altered binding pattern, transcriptomics-based identification of outlying RBP-client interactions shows a decreased outlyingness of Elavl1 inMk2depleted cells (Fig 2,
S1andS2Figs). Upon phosphorylation by p38, KHSRP shows a decreased binding to the Cdkn1aP21transcript and other ARE-containing transcripts and fails to promote their rapid decay, while retaining its ability to interact with the mRNA degradation machinery [51]. In agreement with this, Khsrp becomes less abundant with poly-A-containing RNA (Fig 1D) and
in particular withCdkn1aP21mRNA, upon etoposide treatment (Fig 4B). Disruption of the p38/Mk2 module and continuous Khsrp binding toCdkn1aP21mRNA was associated with low Cdkn1aP21protein levels uncoupled from the increase in theCdkn1aP21transcript upon expo-sure to etoposide (Figs1Dand4B).
CDKN1AP21is a potent CDK inhibitor that binds to and inhibits the activity of CDK4 and 6, and thus functions as a regulator of cell cycle progression at G1[72]. We here show that,
Mk2/3KO MEFs have lower CDKN1AP21protein levels and a decreased G1population (Fig 4F and 4D). We further show thatMk2deletion affects the binding pattern of the post-tran-scriptionalCdkn1aP21regulator Khsrp (Fig 4A and 4B). This is most probably the result of nu-clear retention of p38 in the absence of the nunu-clear export signal of Mk2. The need for p38 phosphorylation for Khsrp release of its client RNAs renders the p38/Mk2 module a negative regulator of Khsrp. In agreement with the lower G1population inMk2-deficient cells,Khsrp
KO cells have an increased G1population, increased CDKN1AP21protein levels, and a
de-creased mitotic index (Fig 5). These results underscore the role of the p38/Mk2/Khsrp pathway in cell cycle regulation.
Maintaining genome stability is crucial for cell growth and cell survival. Different genetic disorders, including most human cancers, are associated with different forms of genome insta-bility [57].Cdkn1aP21regulation by the tumor suppressor p53 and the increasing evidence for a role of RBPs in genome stability [22,43,61,62] suggested a role for the post-transcriptional regulator ofCDKN1AP21, KHSRP, in tumorigenesis. In contrast to p53, KHSRP is as negative regulator ofCDNK1AP21. Indeed, analysis of the data curated by“The Cancer Genome Atlas Research Network”(TCGA) [58,59] revealed that highKHSRPtranscript levels are associated with increased overall survival in glioblastoma multiforme (Fig 6A). This might be the result of a better response to therapy as highKHSRPlevels were also associated with increased disease free survival (Fig 6B). The lack of power forKHSRPto predict OS and DFS in other entities might be the reflection of a different relevance ofKHSRPin different tissues and entities, as wells as the result of lower data availability. Thus, tumor cells with high levels of KHSRP, might have a reduced capacity to survive genotoxic therapies due to defective G1checkpoints.
Conclusions
We have shown that RBPs have distinct binding patterns in response to genotoxic stress in-duced by etoposide. We show how differential RBP profiles can be identified using protein-RNA interactome approaches, as well as transcriptomics. In addition to validating the role of many known RBPs in the etoposide-induced DDR (e.g. Srsf1, Srsf2, Elavl1), we add a new col-lection of RBPs to the etoposide-induced DDR. We demonstrate how changes in one key RBP regulating signaling module, p38/Mk2, can affect the entire spectrum of protein-RNA interac-tions. We further validate Khsrp as a cell cycle regulator through the regulation ofCdkn1aP21. Finally we identify KHSRP as a predictor of overall survival, as well as disease free survival in glioblastoma multiforme.
Supporting Information
number of changed client mRNAs were identified through high absolute values of standardized residuals. The same was done by(C)plotting number of upregulated clients against number of changed clients, as well as using vector information on(D)differential promoter usage,(E) dif-ferential splicing, and(F)differential CDS.
(TIF)
S2 Fig. Difference in outlyingness of RBPs between wildtype andMk2-/-;Mk3-/-cells.Shown are the RBPs with the highest changes in RNA-protein interactome changes and for which enough information on client mRNAs changes was available.
(TIF)
S3 Fig. Khsrp-/-cells arrest in G2in response to etoposide.Upon etoposide treatment, Khsrp-/-MEFs arrest in G2as seen by the increase in cells with a 4N DNA content and decrease
in pHH3 positive cells. (TIF)
S4 Fig.Khsrp-/-cells display increased resistance against etoposide.Colony formation assay of etoposide-treated wt andKhsrp-/-cells reveals a significant resistance ofKhsrp-/-cells to eto-poside treatment.(A)Colony formation assays following a 12 hr exposure to 20μM etoposide
are shown for wt andKhsrp-/-cells.(B)Quantification of the data shown in(A). At least 6 high power fields were evaluated for this analysis.(C)Representative microscopic view of the cells shown in(A, B). HPF, high power field; Eto, etoposide.
(TIF)
S1 Table. Label-free quantification of protein-RNA interactome changes in wt MEFs upon 6h exposure to 20μM etoposide.
(XLSX)
S2 Table. Differential gene expression analysis of wt andMk2/3KO MEFs upon 1h and 6h exposure to 20μM etoposide.
(XLSX)
S3 Table. Differential promoter usage in wt andMk2/3KO MEFs upon 1h and 6h exposure to 20μM etoposide.
(GZ)
S4 Table. Differential splicing in wt andMk2/3KO MEFs upon 1h and 6h exposure to 20μM etoposide.
(GZ)
S5 Table. Differential CDS in wt andMk2/3KO MEFs upon 1h and 6h exposure to 20μM etoposide.
(GZ)
S6 Table. Log-rank test results of overall survival Kaplan-Meier plots for clinical studies not showing significant differences between patients with high Khsrp and low Khrsp. (GZ)
S7 Table. Log-rank test results of overall survival Kaplan-Meier plots for clinical studies not showing significant differences between patients with high Khsrp and low Khrsp. (CSV)
Acknowledgments
This work was supported by the Volkswagenstiftung (Lichtenberg Program H.C.R.), the Deutsche Forschungsgemeinschaft (KFO-286, RE2246/2-1 to H.C.R.), the Helmholtz-Gemein-schaft (Preclinical Comprehensive Cancer Center to H.C.R.), Federal Ministry for Research and Education (BMBF, 01ZX1303A to H.C.R.), the Else Kröner-Fresenius Stiftung (EKFS-2014-A06 to H.C.R.), the Deutsche Krebshilfe (DKH-111112 to H.C.R.) and Deutsche Jose Carreras Stiftung (DJCLS-R12/26 to H.C.R.).
Author Contributions
Conceived and designed the experiments: JB HCR. Performed the experiments: JB CF AS UL AR LT. Analyzed the data: JB MP CD HCR. Contributed reagents/materials/analysis tools: JA MG PN CD. Wrote the paper: JB HCR.
References
1. Reinhardt HC, Yaffe MB. Phospho-Ser/Thr-binding domains: navigating the cell cycle and DNA dam-age response. Nat Rev Mol Cell Biol. 2013; 14(9):563–80. doi:10.1038/nrm3640PMID:23969844. 2. Jackson SP, Bartek J. The DNA-damage response in human biology and disease. Nature. 2009; 461
(7267):1071–8. Epub 2009/10/23. nature08467 [pii] doi:10.1038/nature08467PMID:19847258. 3. Kastan MB, Bartek J. Cell-cycle checkpoints and cancer. Nature. 2004; 432(7015):316–23. PMID:
15549093.
4. Lukas J, Lukas C, Bartek J. Mammalian cell cycle checkpoints: signalling pathways and their organiza-tion in space and time. DNA Repair (Amst). 2004; 3(8–9):997–1007. PMID:15279786.
5. Reinhardt HC, Yaffe MB. Kinases that control the cell cycle in response to DNA damage: Chk1, Chk2, and MK2. Current opinion in cell biology. 2009; 21(2):245–55. doi:10.1016/j.ceb.2009.01.018PMID: 19230643; PubMed Central PMCID: PMC2699687.
6. Harper JW, Elledge SJ. The DNA damage response: ten years after. Mol Cell. 2007; 28(5):739–45. Epub 2007/12/18. doi: S1097-2765(07)00783-6 [pii] doi:10.1016/j.molcel.2007.11.015PMID: 18082599.
7. Shiloh Y, Ziv Y. The ATM protein kinase: regulating the cellular response to genotoxic stress, and more. Nat Rev Mol Cell Biol. 2013; 14(4):197–210. PMID:23847781. doi:10.1038/nrm3546
8. Cimprich KA, Cortez D. ATR: an essential regulator of genome integrity. Nat Rev Mol Cell Biol. 2008; 9 (8):616–27. Epub 2008/07/03. nrm2450 [pii] doi:10.1038/nrm2450PMID:18594563.
9. Bulavin DV, Higashimoto Y, Popoff IJ, Gaarde WA, Basrur V, Potapova O, et al. Initiation of a G2/M checkpoint after ultraviolet radiation requires p38 kinase. Nature. 2001; 411(6833):102–7. PMID: 11333986.
10. Manke IA, Nguyen A, Lim D, Stewart MQ, Elia AE, Yaffe MB. MAPKAP kinase-2 is a cell cycle check-point kinase that regulates the G2/M transition and S phase progression in response to UV irradiation. Mol Cell. 2005; 17(1):37–48. PMID:15629715.
11. Reinhardt HC, Aslanian AS, Lees JA, Yaffe MB. p53-deficient cells rely on ATM- and ATR-mediated checkpoint signaling through the p38MAPK/MK2 pathway for survival after DNA damage. Cancer Cell. 2007; 11(2):175–89. doi:10.1016/j.ccr.2006.11.024PMID:17292828; PubMed Central PMCID: PMC2742175.
12. Raman M, Earnest S, Zhang K, Zhao Y, Cobb MH. TAO kinases mediate activation of p38 in response to DNA damage. EMBO J. 2007; 26(8):2005–14. Epub 2007/03/31. 7601668 [pii] doi:10.1038/sj. emboj.7601668PMID:17396146.
13. Kyriakis JM, Avruch J. Sounding the alarm: protein kinase cascades activated by stress and inflamma-tion. J Biol Chem. 1996; 271(40):24313–6. Epub 1996/10/04. PMID:8798679.
14. Kyriakis JM, Avruch J. Mammalian mitogen-activated protein kinase signal transduction pathways acti-vated by stress and inflammation. Physiol Rev. 2001; 81(2):807–69. PMID:11274345.
15. Reinhardt HC, Hasskamp P, Schmedding I, Morandell S, van Vugt MATM, Wang X, et al. DNA Damage Activates a Spatially Distinct Late Cytoplasmic Cell-Cycle Checkpoint Network Controlled by MK2-Me-diated RNA Stabilization. Molecular Cell. 2010; 40(1):34–49. PubMed S1097-2765(10)00746-X—doi: 10.1016/j.molcel.2010.09.018PMID:20932473
17. Sanchez Y, Wong C, Thoma RS, Richman R, Wu Z, Piwnica-Worms H, et al. Conservation of the Chk1 checkpoint pathway in mammals: linkage of DNA damage to Cdk regulation through Cdc25. Science. 1997; 277(5331):1497–501. PMID:9278511.
18. Peng CY, Graves PR, Thoma RS, Wu Z, Shaw AS, Piwnica-Worms H. Mitotic and G2 checkpoint con-trol: regulation of 14-3-3 protein binding by phosphorylation of Cdc25C on serine-216. Science. 1997; 277(5331):1501–5. PMID:9278512.
19. Loewe S, Muischnek H. Über Kombinationswirkungen. Archiv f experiment Pathol u Pharmakol. 1926; 114(5–6):313–26. doi:10.1007/BF01952257
20. Forrest A, Gabrielli B. Cdc25B activity is regulated by 14-3-3. Oncogene. 2001; 20(32):4393–401. PMID:11466620
21. Davezac N, Baldin V, Gabrielli B, Forrest A, Theis-Febvre N, Yashida M, et al. Regulation of CDC25B phosphatases subcellular localization. Oncogene. 2000; 19(18):2179–85. PMID:10822367.
22. Matsuoka S, Ballif BA, Smogorzewska A, McDonald ER 3rd, Hurov KE, Luo J, et al. ATM and ATR sub-strate analysis reveals extensive protein networks responsive to DNA damage. Science. 2007; 316 (5828):1160–6. Epub 2007/05/26. 316/5828/1160 [pii] doi:10.1126/science.1140321PMID: 17525332.
23. Beli P, Lukashchuk N, Wagner SA, Weinert BT, Olsen JV, Baskcomb L, et al. Proteomic investigations reveal a role for RNA processing factor THRAP3 in the DNA damage response. Molecular cell. 2012; 46(2):212–25. doi:10.1016/j.molcel.2012.01.026PMID:22424773; PubMed Central PMCID: PMC3565437.
24. Boucas J, Riabinska A, Jokic M, Herter-Sprie GS, Chen S, Hopker K, et al. Posttranscriptional regula-tion of gene expression-adding another layer of complexity to the DNA damage response. Front Genet. 2012; 3:159. doi:10.3389/fgene.2012.00159PMID:22936947; PubMed Central PMCID:
PMC3427493.
25. Reinhardt HC, Hasskamp P, Schmedding I, Morandell S, van Vugt MA, Wang X, et al. DNA damage ac-tivates a spatially distinct late cytoplasmic cell-cycle checkpoint network controlled by MK2-mediated RNA stabilization. Molecular cell. 2010; 40(1):34–49. doi:10.1016/j.molcel.2010.09.018PMID: 20932473; PubMed Central PMCID: PMC3030122.
26. Reinhardt HC, Cannell IG, Morandell S, Yaffe MB. Is post-transcriptional stabilization, splicing and translation of selective mRNAs a key to the DNA damage response? Cell Cycle. 2011; 10(1):23–7. PMID:21173571; PubMed Central PMCID: PMC3048069.
27. Zhan Q, Antinore MJ, Wang XW, Carrier F, Smith ML, Harris CC, et al. Association with Cdc2 and inhi-bition of Cdc2/Cyclin B1 kinase activity by the p53-regulated protein Gadd45. Oncogene. 1999; 18 (18):2892–900. Epub 1999/06/11. doi:10.1038/sj.onc.1202667PMID:10362260.
28. Kastan MB, Zhan Q, el-Deiry WS, Carrier F, Jacks T, Walsh WV, et al. A mammalian cell cycle check-point pathway utilizing p53 and GADD45 is defective in ataxia-telangiectasia. Cell. 1992; 71(4):587–97. Epub 1992/11/23. doi: 0092-8674(92)90593-2 [pii]. PMID:1423616.
29. Xu J. Preparation, culture, and immortalization of mouse embryonic fibroblasts. Current protocols in molecular biology / edited by Frederick M Ausubel et al. 2005;Chapter 28:Unit 28 1. doi:10.1002/ 0471142727.mb2801s70PMID:18265366.
30. Zaru R, Ronkina N, Gaestel M, Arthur JS, Watts C. The MAPK-activated kinase Rsk controls an acute Toll-like receptor signaling response in dendritic cells and is activated through two distinct pathways. Nature immunology. 2007; 8(11):1227–35. doi:10.1038/ni1517PMID:17906627.
31. Lin WJ, Zheng X, Lin CC, Tsao J, Zhu X, Cody JJ, et al. Posttranscriptional control of type I interferon genes by KSRP in the innate immune response against viral infection. Molecular and cellular biology. 2011; 31(16):3196–207. doi:10.1128/MCB.05073-11PMID:21690298; PubMed Central PMCID: PMC3147801.
32. Trapnell C, Roberts A, Goff L, Pertea G, Kim D, Kelley DR, et al. Differential gene and transcript expres-sion analysis of RNA-seq experiments with TopHat and Cufflinks. Nature protocols. 2012; 7(3):562–78. doi:10.1038/nprot.2012.016PMID:22383036; PubMed Central PMCID: PMC3334321.
33. Dassi E, Re A, Leo S, Tebaldi T, Pasini L, Peroni D, et al. AURA 2: Empowering discovery of post-tran-scriptional networks. Translation. 2014; 2(1).
34. Blake JA, Bult CJ, Eppig JT, Kadin JA, Richardson JE, Mouse Genome Database Group. The Mouse Genome Database: integration of and access to knowledge about the laboratory mouse. Nucleic acids research. 2014; 42(Database issue):D810–7. doi:10.1093/nar/gkt1225PMID:24285300; PubMed Central PMCID: PMC3964950.
35. Huang da W, Sherman BT, Lempicki RA. Systematic and integrative analysis of large gene lists using DAVID bioinformatics resources. Nature protocols. 2009; 4(1):44–57. doi:10.1038/nprot.2008.211 PMID:19131956.
36. Huang da W, Sherman BT, Lempicki RA. Bioinformatics enrichment tools: paths toward the compre-hensive functional analysis of large gene lists. Nucleic acids research. 2009; 37(1):1–13. doi:10.1093/ nar/gkn923PMID:19033363; PubMed Central PMCID: PMC2615629.
37. Castello A, Horos R, Strein C, Fischer B, Eichelbaum K, Steinmetz LM, et al. System-wide identification of RNA-binding proteins by interactome capture. Nature protocols. 2013; 8(3):491–500. doi:10.1038/ nprot.2013.020PMID:23411631.
38. Cox J, Mann M. MaxQuant enables high peptide identification rates, individualized p.p.b.-range mass accuracies and proteome-wide protein quantification. Nature biotechnology. 2008; 26(12):1367–72. doi:10.1038/nbt.1511PMID:19029910.
39. Luber CA, Cox J, Lauterbach H, Fancke B, Selbach M, Tschopp J, et al. Quantitative proteomics re-veals subset-specific viral recognition in dendritic cells. Immunity. 2010; 32(2):279–89. doi:10.1016/j. immuni.2010.01.013PMID:20171123.
40. Mostafavi S, Ray D, Warde-Farley D, Grouios C, Morris Q. GeneMANIA: a real-time multiple associa-tion network integraassocia-tion algorithm for predicting gene funcassocia-tion. Genome biology. 2008; 9 Suppl 1:S4. doi:10.1186/gb-2008-9-s1-s4PMID:18613948; PubMed Central PMCID: PMC2447538.
41. Thissen D. Influence-enhanced scatterplots. Psychological Bulletin. 1981; 90(1):179–84. doi:10.1037/ 0033-2909.90.1.179
42. Wilusz CJ, Wilusz J. Bringing the role of mRNA decay in the control of gene expression into focus. Trends in genetics: TIG. 2004; 20(10):491–7. doi:10.1016/j.tig.2004.07.011PMID:15363903. 43. Montecucco A, Biamonti G. Pre-mRNA processing factors meet the DNA damage response. Frontiers
in genetics. 2013; 4:102. doi:10.3389/fgene.2013.00102PMID:23761808; PubMed Central PMCID: PMC3674313.
44. Leva V, Giuliano S, Bardoni A, Camerini S, Crescenzi M, Lisa A, et al. Phosphorylation of SRSF1 is modulated by replicational stress. Nucleic acids research. 2012; 40(3):1106–17. doi:10.1093/nar/ gkr837PMID:21984412; PubMed Central PMCID: PMC3273819.
45. Blaustein M, Pelisch F, Tanos T, Munoz MJ, Wengier D, Quadrana L, et al. Concerted regulation of nu-clear and cytoplasmic activities of SR proteins by AKT. Nature structural & molecular biology. 2005; 12 (12):1037–44. doi:10.1038/nsmb1020PMID:16299516.
46. Viniegra JG, Martinez N, Modirassari P, Hernandez Losa J, Parada Cobo C, Sanchez-Arevalo Lobo VJ, et al. Full activation of PKB/Akt in response to insulin or ionizing radiation is mediated through ATM. The Journal of biological chemistry. 2005; 280(6):4029–36. doi:10.1074/jbc.M410344200PMID: 15546863.
47. Edmond V, Moysan E, Khochbin S, Matthias P, Brambilla C, Brambilla E, et al. Acetylation and phos-phorylation of SRSF2 control cell fate decision in response to cisplatin. The EMBO journal. 2011; 30 (3):510–23. doi:10.1038/emboj.2010.333PMID:21157427; PubMed Central PMCID: PMC3034009. 48. Merdzhanova G, Edmond V, De Seranno S, Van den Broeck A, Corcos L, Brambilla C, et al. E2F1
con-trols alternative splicing pattern of genes involved in apoptosis through upregulation of the splicing fac-tor SC35. Cell death and differentiation. 2008; 15(12):1815–23. doi:10.1038/cdd.2008.135PMID: 18806759.
49. Ashburner M, Ball CA, Blake JA, Botstein D, Butler H, Cherry JM, et al. Gene ontology: tool for the unifi-cation of biology. The Gene Ontology Consortium. Nat Genet. 2000; 25(1):25–9. doi:10.1038/75556 PMID:10802651; PubMed Central PMCID: PMC3037419.
50. Lafarga V, Cuadrado A, Lopez de Silanes I, Bengoechea R, Fernandez-Capetillo O, Nebreda AR. p38 Mitogen-activated protein kinase- and HuR-dependent stabilization of p21(Cip1) mRNA mediates the G(1)/S checkpoint. Mol Cell Biol. 2009; 29(16):4341–51. Epub 2009/06/17. MCB.00210-09 [pii] doi:10. 1128/MCB.00210-09PMID:19528229.
51. Briata P, Forcales SV, Ponassi M, Corte G, Chen CY, Karin M, et al. p38-dependent phosphorylation of the mRNA decay-promoting factor KSRP controls the stability of select myogenic transcripts. Molecular cell. 2005; 20(6):891–903. doi:10.1016/j.molcel.2005.10.021PMID:16364914.
52. Bollig F, Winzen R, Gaestel M, Kostka S, Resch K, Holtmann H. Affinity purification of ARE-binding pro-teins identifies polyA-binding protein 1 as a potential substrate in MK2-induced mRNA stabilization. Bio-chemical and biophysical research communications. 2003; 301(3):665–70. Epub 2003/02/05. doi: S0006291X03000159 [pii]. PMID:12565831.
53. Gherzi R, Lee KY, Briata P, Wegmuller D, Moroni C, Karin M, et al. A KH domain RNA binding protein, KSRP, promotes ARE-directed mRNA turnover by recruiting the degradation machinery. Molecular cell. 2004; 14(5):571–83. doi:10.1016/j.molcel.2004.05.002PMID:15175153.
55. Macleod KF, Sherry N, Hannon G, Beach D, Tokino T, Kinzler K, et al. p53-dependent and independent expression of p21 during cell growth, differentiation, and DNA damage. Genes & development. 1995; 9 (8):935–44. PMID:7774811.
56. Hanahan D, Weinberg RA. Hallmarks of cancer: the next generation. Cell. 2011; 144(5):646–74. Epub 2011/03/08. doi: S0092-8674(11)00127-9 [pii] doi:10.1016/j.cell.2011.02.013PMID:21376230. 57. Vogelstein B, Kinzler KW. Cancer genes and the pathways they control. Nature medicine. 2004; 10
(8):789–99. doi:10.1038/nm1087PMID:15286780.
58. Cerami E, Gao J, Dogrusoz U, Gross BE, Sumer SO, Aksoy BA, et al. The cBio cancer genomics portal: an open platform for exploring multidimensional cancer genomics data. Cancer discovery. 2012; 2 (5):401–4. doi:10.1158/2159-8290.CD-12-0095PMID:22588877; PubMed Central PMCID: PMC3956037.
59. Gao J, Aksoy BA, Dogrusoz U, Dresdner G, Gross B, Sumer SO, et al. Integrative analysis of complex cancer genomics and clinical profiles using the cBioPortal. Science signaling. 2013; 6(269):pl1. doi:10. 1126/scisignal.2004088PMID:23550210; PubMed Central PMCID: PMC4160307.
60. Briata P, Chen CY, Ramos A, Gherzi R. Functional and molecular insights into KSRP function in mRNA decay. Biochim Biophys Acta. 2013; 1829(6–7):689–94. doi:10.1016/j.bbagrm.2012.11.003PMID: 23178464.
61. Paulsen RD, Soni DV, Wollman R, Hahn AT, Yee MC, Guan A, et al. A genome-wide siRNA screen re-veals diverse cellular processes and pathways that mediate genome stability. Mol Cell. 2009; 35 (2):228–39. Epub 2009/08/04. doi: S1097-2765(09)00459-6 [pii] doi:10.1016/j.molcel.2009.06.021 PMID:19647519.
62. Hurov KE, Cotta-Ramusino C, Elledge SJ. A genetic screen identifies the Triple T complex required for DNA damage signaling and ATM and ATR stability. Genes & development. 2010; 24(17):1939–50. doi: 10.1101/gad.1934210PMID:20810650; PubMed Central PMCID: PMC2932975.
63. Baltz AG, Munschauer M, Schwanhausser B, Vasile A, Murakawa Y, Schueler M, et al. The mRNA-bound proteome and its global occupancy profile on protein-coding transcripts. Molecular cell. 2012; 46 (5):674–90. doi:10.1016/j.molcel.2012.05.021PMID:22681889.
64. Castello A, Fischer B, Eichelbaum K, Horos R, Beckmann BM, Strein C, et al. Insights into RNA biology from an atlas of mammalian mRNA-binding proteins. Cell. 2012; 149(6):1393–406. doi:10.1016/j.cell. 2012.04.031PMID:22658674.
65. Castello A, Fischer B, Hentze MW, Preiss T. RNA-binding proteins in Mendelian disease. Trends in ge-netics: TIG. 2013; 29(5):318–27. doi:10.1016/j.tig.2013.01.004PMID:23415593.
66. Lal A, Abdelmohsen K, Pullmann R, Kawai T, Galban S, Yang X, et al. Posttranscriptional derepression of GADD45alpha by genotoxic stress. Mol Cell. 2006; 22(1):117–28. Epub 2006/04/08. doi: S1097-2765(06)00182-1 [pii] doi:10.1016/j.molcel.2006.03.016PMID:16600875.
67. Wang W, Furneaux H, Cheng H, Caldwell MC, Hutter D, Liu Y, et al. HuR regulates p21 mRNA stabili-zation by UV light. Mol Cell Biol. 2000; 20(3):760–9. Epub 2000/01/11. PMID:10629032.
68. Engel K, Kotlyarov A, Gaestel M. Leptomycin B-sensitive nuclear export of MAPKAP kinase 2 is regu-lated by phosphorylation. EMBO J. 1998; 17(12):3363–71. Epub 1998/06/17. doi:10.1093/emboj/17. 12.3363PMID:9628873.
69. Stoecklin G, Stubbs T, Kedersha N, Wax S, Rigby WF, Blackwell TK, et al. MK2-induced tristetrapro-lin:14-3-3 complexes prevent stress granule association and ARE-mRNA decay. EMBO J. 2004; 23 (6):1313–24. Epub 2004/03/12. doi:10.1038/sj.emboj.76001637600163 [pii]. PMID:15014438. 70. Maitra S, Chou CF, Luber CA, Lee KY, Mann M, Chen CY. The AU-rich element mRNA
decay-promot-ing activity of BRF1 is regulated by mitogen-activated protein kinase-activated protein kinase 2. RNA. 2008; 14(5):950–9. Epub 2008/03/08. rna.983708 [pii] doi:10.1261/rna.983708PMID:18326031. 71. Rousseau S, Morrice N, Peggie M, Campbell DG, Gaestel M, Cohen P. Inhibition of SAPK2a/p38
pre-vents hnRNP A0 phosphorylation by MAPKAP-K2 and its interaction with cytokine mRNAs. EMBO J. 2002; 21(23):6505–14. Epub 2002/11/29. PMID:12456657.
72. Gartel AL, Radhakrishnan SK. Lost in transcription: p21 repression, mechanisms, and consequences. Cancer research. 2005; 65(10):3980–5. doi:10.1158/0008-5472.CAN-04-3995PMID:15899785.